

Abstract
The development of adult-onset diseases is influenced by perinatal exposure to altered environmental conditions. One such exposure, bisphenol A (BPA), has been associated with obesity and diabetes, and consequently labeled an obesogen. Using an isogenic murine model, we examined the effects of perinatal exposure through maternal diet to 50 ng (n=20), 50 μg (n=21), or 50 mg (n=18) BPA/kg diet, as well as controls (n=20) on offspring energy expenditure, spontaneous activity, and body composition at 3, 6, and 9 mo of age, and hormone levels at 9 and 10 mo of age. Overall, exposed females and males exhibited increased energy expenditure (P<0.001 and 0.001, respectively) throughout the life course. In females, horizontal and vertical activity increased (P=0.07 and 0.06, respectively) throughout the life course. Generally, body composition measures were not different throughout the life course in exposed females or males (all P>0.44), although body fat and weight decreased in exposed females at particular ages (all P<0.08). Milligram-exposed females had improved glucose, insulin, adiponectin, and leptin profiles (all P<0.10). Thus, life-course analysis illustrates that BPA is associated with hyperactive and lean phenotypes. Variability across studies may be attributable to differential exposure duration and timing, dietary fat and phytoestrogen content, or lack of sophisticated phenotyping across the life course.—Anderson, O.S., Peterson, K.E., Sanchez, B.N., Zhang, Z., Mancuso, P., Dolinoy, D.C. Perinatal bisphenol A exposure promotes hyperactivity, lean body composition, and hormonal responses across the murine life course.
Keywords: developmental origins of health and disease, energy expenditure, glucose, insulin, metabolic homeostasis
Human exposure to bisphenol A (BPA), the monomer comprising polycarbonate plastic and epoxy resin, is widespread, and several studies have reported detectable levels of total urinary BPA in a majority of individuals in populations around the world, including the United States, China, and Korea (1, 2). BPA is produced in high volumes and found in consumer products, such as food and water containers, baby bottles, receipt paper, dental composites, and metal can linings. BPA can leach from consumer products, which presents many opportunities for human exposure, most commonly via ingestion and, to a lesser extent, via inhalation and dermal routes (3).
BPA can mimic or antagonize endogenous hormones and subsequently perturb endocrine function (4, 5). For example, BPA has a strong binding affinity for the transmembrane estrogen receptor (ER), G-protein-coupled receptor 30 (GPR30), and estrogen-related receptor γ (ERRγ) (6, 7). BPA can activate transcription factors, such as peroxisome proliferator-activated receptors (PPARs) and the aryl hydrocarbon receptor (AhR) (8, 9). BPA has been labeled an environmental obesogen (10, 11), a xenobiotic chemical contributing to obesity and related phenotypes, due to its ability to interfere with the ERs α and β in adipose and pancreatic tissues and to exert antagonistic effects on the thyroid hormone receptor (4, 12, 13). As these receptor pathways play an important role in gene regulation, BPA may influence normal differentiation and maturation processes during embryonic and fetal development, predisposing individuals to chronic disease, such as obesity, throughout the life span (14, 15).
Animal models of perinatal BPA exposure provide insight into potential alterations this chemical elicits on metabolic homeostasis (11, 16). Male offspring developed insulin resistance and glucose intolerance as adults when exposed to 10 μg BPA/kg body weight (BW) from gestational day (GD) 9 to GD 16 (17). In utero BPA exposure was associated with overexpression of lipogenic genes in rats, resulting in enhanced adipogenesis of white adipose tissue measured at postnatal day (PND) 21 (18). In human adipose tissue explants, BPA inhibited the release of adiponectin and stimulated production of cytokines interleukin-6 and tumor necrosis factor α, common proinflammatory markers found in overweight/obese individuals (19). In human epidemiological studies, Lang et al. (20) found a positive association between adult BPA urinary levels and type 2 diabetes and cardiovascular disease, and recent data correlated BPA levels and obesity in children (21). Collectively, this work suggests that BPA may be a contributing factor to the obesity epidemic (22).
Despite the increasing evidence describing BPA as an obesogen, another proposed target of BPA involves impairment of central nervous system (CNS) development (23). Animal studies revealed that perinatal BPA exposure was positively associated with spontaneous activity, aggression, and altered cognitive function (24, 25). Zhou et al. (26) reported that perinatal BPA exposure was associated with hyperactivity and decreased attention mediated by dopaminergic enhancement. Further animal models demonstrated that BPA targets the CNS in early development (27) and resulting behavioral outcomes correlated to human clinical disorders such as attention-deficit and hyperactivity disorder (ADHD) and aggression. These human clinical disorders have also been found to be associated with maternal BPA exposure in human epidemiological studies (26, 28).
Considering the evidence from animal and human models of altered health outcomes resulting from early life BPA exposure, the aim of the present study was to assess the effects of in utero and early postnatal exposure to multiple physiologically relevant BPA levels on spontaneous activity, energy expenditure, body composition, and hormones/adipokines by incorporating sophisticated animal phenotyping at three time-points throughout the murine life course. Herein we report increased energy expenditure and spontaneous activity, decreased body weight and fat, and altered hormonal parameters across BPA-exposed offspring. Effects were most prevalent and observed across all doses in female offspring. Males also exhibited effects, although they were not consistently observed across all outcomes and exposure groups.
MATERIALS AND METHODS
Animals and diets
Mice were obtained from a colony that has been maintained with sibling mating and forced heterozygosity for the viable yellow agouti (Avy) allele for >220 generations, resulting in a genetically invariant background (29). Virgin wild-type a/a dams, 6 wk of age, were randomly assigned to one of 4 phytoestrogen-free AIN-93G diets (diet 95092 with 7% corn oil substituted for 7% soybean oil; Harlan Teklad, Madison, WI, USA): standard diet (n=11 litters); standard diet supplemented with 50 ng BPA/kg diet (n=14 litters); standard diet supplemented with 50 μg BPA/kg diet (n=9 litters); or standard diet supplemented with 50 mg BPA/kg diet (n=13 litters). All diet ingredients were supplied by Harlan Teklad except BPA, which was supplied by the National Toxicology Program (NTP; Durham, NC, USA). The milligram dosage is an order of magnitude lower than the dietary administered maximum nontoxic threshold in rodents (200 mg/kg BW/d; ref. 30), but it is important to note, as previously reported, all three BPA dosages capture human physiologically relevant exposure (31, 32).
Wild-type a/a dams were provided with their respective diet 2 wk prior to mating with 8-wk-old Avy/a males and housed in polycarbonate-free cages with ad libitum access to diet and BPA-free water. The dams remained on the assigned diets throughout pregnancy and lactation, after which offspring were weaned and fed the standard phytoestrogen-free control diet. This mating scheme produces ∼50% a/a genotype offspring and 50% Avy/a offspring. At PND 22, offspring were weighed and changed to the corn oil control diet. For this study, a subset of a/a wild-type animals, representing ∼1 male and 1 female/litter, was followed until 10 mo of age: standard diet (n=20 offspring); 50 ng BPA/kg diet (n=20 offspring); 50 μg BPA/kg diet (n=21 offspring); or 50 mg BPA/kg diet (n=18 offspring). Animals used in this study were maintained in accordance with the Institute of Laboratory Animal Resources guidelines (33) and were treated humanely and with regard for alleviation of suffering. The study protocol was approved by the University of Michigan Committee on Use and Care of Animals.
Life-course evaluation
Only wild-type a/a offspring were followed for life-course animal phenotyping to exclude bias from metabolic disturbance induced by the epigenetically regulated Avy allele in Avy/a offspring (34, 35). These a/a offspring were housed with same-sex Avy/a siblings to avoid physiological disturbances induced by singly housed animals. At 3, 6, and 9 mo of age, energy expenditure, spontaneous activity, food intake, and body composition measurements were completed on a/a offspring at the Animal Phenotyping Core at the Michigan Nutrition and Obesity Research Center (MNORC; Ann Arbor, MI, USA). At the Animal Phenotyping Core, offspring were singly housed and acclimated for a 7-d period in a 12-h light-dark cycle. Proceeding the 7-d acclimation period, offspring were measured for energy expenditure (oxygen consumption, oxygen consumption for lean body mass, and carbon dioxide production) sequentially every 5 s in 20-min intervals throughout a 72-h period using an open-circuit indirect calorimeter [Comprehensive Lab Animal Monitoring System (CLAMS), Columbus Instruments, Columbus, OH, USA]. The respiratory exchange ratio was measured by taking the ratio of carbon dioxide production and oxygen consumption. Also during the 72-h period of testing, spontaneous activity was measured in 3 axes, including ambulatory (walking), total horizontal (ambulatory plus additional horizontal movement), and vertical dimensions. Motion was detected every second in 20-min intervals using infrared (IR) photobeam technology, where the interruption of a single IR beam tallied as a count. In addition, ad libitum food intake was measured using powdered food and a precision scale in 20-min increments. After completion of the 72 h indirect calorimetry testing, body composition was evaluated on conscious mice through nuclear magnetic resonance (NMR; Minispec LF90II; Bruker Optics, Billerica, MA, USA) imaging, distinguishing fat tissue mass, lean tissue mass, and body fluids. Body weight was measured before initiation of the experiments at each life-course time point.
Hormone panel
Following the 72-h period of CLAMS at the 9-mo visit to the MNORC, animals were unfed for a 5-h period and subsequently subjected to an oral glucose tolerance test (OGTT). Each animal received a glucose dose of 2 g/kg BW via oral gavage. Glucose and insulin levels were measured at baseline and at 15, 30, 60, and 120 min via glucometer (Acucheck; Roche, Indianapolis, IN, USA) and enzyme-linked immunosorbent assay (ELISA; Millipore, St. Charles, MO, USA), respectively. At 10 mo of age, the animals were euthanized. Females were euthanized on the first day of estrus according to vaginal cytology (36). Serum was collected by a hepatic vein snip. Adiponectin and leptin serum levels were measured via ELISA according to the manufacturer's instructions.
Data analysis
Life-course energy expenditure, spontaneous activity, and food intake were evaluated at 3, 6, and 9 mo of age over a 72-h (3-d) period in 20-min intervals. Data were collapsed (averaged) to light and dark cycles, and mixed linear regression models for repeated measures, adjusted for sex and light cycles, were estimated. Body composition was evaluated at the end of the 72-h assessment period at 3, 6, and 9 mo of age; a mixed linear regression model was estimated, adjusting for sex. The mixed linear regression models incorporated the correlation within litters with a random intercept, and correlation among repeated measures within individual mice using an autoregressive correlation structure chosen using the maximum likelihood ratio test. Models were evaluated with sex-exposure, time-exposure, and sex-time-exposure interaction terms. As a sensitivity analyses, separate models were run for each day of the 3-d assessment period for energy expenditure, spontaneous activity, and food intake at all ages (3, 6, and 9 mo of age) in order to determine differences in effects across d 1 through d 3 of assessment. Hormone analyses were completed by using a repeated-measures model accounting for within-litter correlation. The homeostatic model assessment of insulin resistance (HOMA-IR) was performed on fasting glucose and insulin levels. Results were considered significant at values of P ≤ 0.05 and marginally significant at values of P > 0.05 and ≤ 0.10. All statistical analyses were completed using SAS 9.2 software (SAS Institutes, Cary, NC, USA).
RESULTS
As previously reported, dietary physiologically relevant perinatal BPA exposure at 50 ng (n=14 litters, 107 total offspring), 50 μg (n=9 litters, 67 total offspring), or 50 mg (n=13 litters, 91 total offspring) BPA/kg diet did not significantly influence litter size (P=0.44), survival (P=0.82), genotypic ratio (P=0.46), or sex ratio (P=0.16) compared to control offspring (n=11 litters, 86 total offspring) (31). BPA exposure was significantly associated with lower wean weight of nanogram-exposed offspring (P=0.03) but not microgram- or milligram-exposed offspring (31).
For the analysis of physiological effects across the life course at 3, 6, and 9 mo, we analyzed offspring exposed to 50 ng (n=20), 50 μg (n=21), or 50 mg (n=18) BPA/kg diet, as well as controls (n=20). Due to nonmonotonic and/or nonlinear trends across the life span within BPA dose groups, we report values for each exposure group (nanogram, microgram, and milligrams) individually in comparison to the control group at 3 time points across the life span. In addition, we report the general (overall) significance of each outcome across exposure groups over time.
Energy expenditure
Overall, oxygen consumption differs following perinatal dietary exposure to all levels of BPA across the life course for females and males (P<0.001 and P<0.001, respectively). Female offspring exposed to 50 ng BPA/kg developed increased oxygen consumption at 6 and 9 mo of age, with an average of 5156 and 4526 ml/kg/h compared to an average of 3814 and 3749 ml/kg/h in controls, respectively (P=0.09 and P<0.001, respectively; Fig. 1A). Females exposed to 50 μg BPA/kg had an average oxygen consumption of 4556 and 4301 ml/kg/h vs. 4152 and 3814 ml/kg/h in the controls at 3 and 6 mo of age, respectively (P=0.06 and P=0.02, respectively; Fig. 1A). Females exposed to 50 mg BPA/kg had an average oxygen consumption of 4783 and 4584 vs. 4152 and 3814 ml/kg/h in the controls at 3 and 6 mo of age, respectively (P=0.004 and P<0.001, respectively; Fig. 1A). At 9 mo of age, males had oxygen consumption levels of 3713 and 3574 ml/kg/h when exposed to 50 μg or 50 mg BPA/kg, respectively, compared to 3052 ml/kg/h in controls (P=0.002 and P=0.02, respectively; Fig. 1A). In addition, oxygen consumption corrected for lean body mass was measured to avoid bias from inactive fat mass (37). Overall, oxygen consumption corrected for lean body mass was significantly different across exposure groups over the life span in females and males (P<0.001 and P<0.001, respectively).
Figure 1.
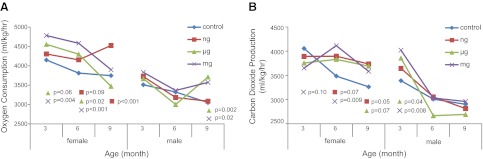
Energy expenditure (ml/kg/h) measured by indirect calorimetry over a 72-h period. Oxygen consumption (A) and carbon dioxide production (B) across the life course, stratified by offspring sex. P values represent nanogram (n=10 female, 10 male), microgram (n=10 female, 11 male), or milligram (n=9 female, 9 male) BPA-exposed offspring compared to control offspring (n=10 female, 10 male).
Carbon dioxide production was different across exposure groups over the life course in females and males (P<0.001 and P<0.001, respectively). Females exposed to 50 ng BPA/kg had average carbon dioxide production levels of 3897 and 3736 ml/kg/h at 6 and 9 mo of age vs. 3487 and 3264 ml/kg/h in the controls, respectively (P=0.07 and P=0.05, respectively; Fig. 1B). Females exposed to 50 μg BPA/kg had average carbon dioxide production of 3692 vs. 3264 ml/kg/h in controls at 9 mo of age (P=0.07; Fig. 1B). At 3 and 6 mo of age, females exposed to 50 mg BPA/kg developed average carbon dioxide production levels of 3652 and 4113 vs. 4057 and 3486 ml/kg/h in controls, respectively (P=0.10 and P=0.009, respectively; Fig. 1B). Males exposed to 50 μg and mg BPA/kg developed an average carbon dioxide production of 5858 and 4021 ml/kg/h at 3 mo of age, respectively, compared to 3391 ml/kg/h in controls (P=0.04 and P=0.008, respectively; Fig. 1B). Respiratory exchange ratio was calculated to determine the source of energy metabolism used by the exposed offspring in comparison to the controls across different time points over the life course. No significant differences were observed. In addition, the control group displayed a natural decline in energy expenditure throughout the life course (Fig. 1), as noted in previous work (38).
Spontaneous activity
Horizontal activity was different across the BPA dosages over the life course in females but not in males (P=0.07 and P=0.58, respectively). Female offspring exposed to 50 ng BPA/kg had an average horizontal activity of 2976 and 3067 counts/h at 3 and 9 mo of age. compared to 2483 and 2591counts/h in controls, respectively (P=0.04 and P=0.05, respectively; Fig. 2A). At 9 mo of age, females exposed to 50 μg or 50 mg BPA/kg displayed an average horizontal activity of 3241 and 3447 counts/h, respectively, compared to 2591 counts/h in control offspring (P=0.007 and P<0.001, respectively; Fig. 2A). Males exposed to 50 μg or 50 mg BPA/kg had an average of 2740 and 2906 counts/h in horizontal activity, respectively, compared to 2196 counts/h in controls at 3 mo of age (P=0.02 and P=0.003; Fig. 2A). Ambulatory activity (subset of total horizontal activity) was not different over the life course across the exposure groups in females, but the trend was different in males (P=0.36 and P=0.001, respectively). Females, however, did exhibit increases in ambulatory activity on exposure at individual assessment points. For example, at 3 and 9 mo of age, females exposed to 50 ng BPA/kg exhibited average ambulatory movement of 1740 and 1739 counts/h, compared to 1281 and 1372 counts/h in controls, respectively, (P=0.01 and P=0.05, respectively).
Figure 2.
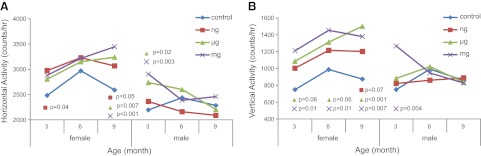
Spontaneous activity (counts/h) measured via IR photobeam detection average over a 72-h period. Horizontal (A) and vertical (B) activity across the life course, stratified by offspring sex. P values represent nanogram (n=10 female, 10 male), microgram (n=10 female, 11 male), or milligram (n=9 female, 9 male) BPA-exposed offspring compared to control offspring (n=10 female, 10 male).
Vertical activity was different across the exposure groups throughout the life course in females, but the trend was not different in males over time (P=0.06 and P=0.87, respectively). Females exposed to 50 ng BPA/kg dietary exposure had average vertical activity of 1202 counts/h at 9 mo vs. 874 counts/h in controls (P=0.07; Fig. 2B). At 3, 6, and 9 mo of age, females in the microgram-exposed group displayed average increase vertical activity of 1086, 1312, and 1501 vs. 749, 987, and 874 counts/h displayed by controls, respectively (P=0.06, P=0.06, and P<0.001, respectively; Fig. 2B). At 3, 6, and 9 mo of age, females exposed to 50 mg BPA/kg displayed average vertical activity of 1210, 1453, and 1379 vs. 749, 987, and 874 counts/h displayed by controls, respectively (P=0.01, P=0.01, and P=0.007, respectively; Fig. 2B). Vertical activity in milligram-exposed males at 3 mo of age was 1267 counts/h, compared to 750 counts/h in controls (P=0.004; Fig. 2B). In addition, the control group displayed a natural decline in spontaneous activity levels throughout the life course (Fig. 2), as previously observed (39).
Food intake
Food intake was different over time across the exposure groups in females and males (P=0.04 and 0.10, respectively). Females exposed to 50 ng BPA/kg had an average food intake of 2.12 vs. 2.40 g in controls at 6 mo of age (P=0.05; Fig. 3). Females exposed to 50 μg BPA/kg had average intake of 2.04 and 2.08 g at 6 and 9 mo of age vs. 2.44 and 2.36 g in controls, respectively (P=0.02 and P=0.10, respectively; Fig. 3). At 3 mo of age, the milligram-exposed females had average intake of 2.15 vs. 2.56 g in the controls (P=0.06; Fig. 3). At 9 mo of age, nanogram- and microgram-exposed males exhibited average food intake of 2.90 and 2.34 g, respectively, vs. 2.63 g in controls (P=0.10 and P=0.08, respectively; Fig. 3).
Figure 3.

Food intake (g) across the life course, measured by powdered food on a precision scale over a 72-h period, stratified by offspring sex. P values represent nanogram (n=10 female, 10 male), microgram (n=10 female, 11 male), or milligram (n=9 female, 9 male) BPA-exposed offspring compared to control offspring (n=10 female, 10 male).
Day-to-day variability assessment
Energy expenditure, spontaneous activity, and food intake were measured over a 72-h period (3 d) at each age of assessment (3, 6, and 9 mo). The mice underwent a 7-d acclimation period prior to the onset of the 3-d phenotypic assessment, but a possibility of variability among results remained from d 1 through 3 of testing. Thus, each day was measured separately to determine whether a particular day primarily contributed to differences between exposure and control groups. We found that differences among exposure groups vs. the control group remain statistically significant from d 1 through 3 of testing. For example, milligram-exposed females had significantly higher oxygen consumption at 6 mo of age on d 1, 2, and 3 of phenotypic assessment (P=0.02, P=0.03, and P=0.005, respectively), and microgram-exposed females had significantly higher ambulatory activity at 3 mo of age on d 1, 2, and 3 of phenotypic assessment (P=0.02, P<0.001, and P=0.001, respectively) compared to controls. Due to homogeneous differences across the 3 d of assessment, we choose to focus on the average measurements across the total 3-d (72-h) period of testing at each age of assessment, as reported above.
Body composition
Overall, body composition measures did not differ significantly over the life course across multiple BPA doses in females and males (all P>0.10), but significant differences occurred in particular exposure groups and time points when compared to controls, especially in females. At 6 and 9 mo of age, nanogram-exposed females displayed an average body weight of 27.2 and 28.4 vs. 30.9 and 32.1 g in controls, respectively (P=0.05 and P=0.06, respectively; Fig. 4A). At 6 and 9 mo of age, nanogram-exposed females had an average fat mass of 4.00 and 4.45 vs. 6.05 and 6.15 g in controls, respectively (P=0.03 and P=0.08, respectively; Fig. 4B). At 3 mo of age, microgram-exposed females had average body fat of 2.33 vs. 4.07 g in control offspring (P=0.06; Fig. 4B). At 6 mo of age, milligram-exposed females had average body fat of 4.50 vs. 6.05 g in controls (P=0.08; Fig. 4B). No significant changes were found in fat mass in males (Fig. 4B) or in lean body mass in all offspring across the life span.
Figure 4.
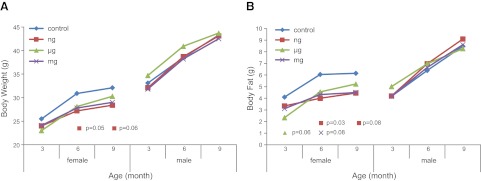
Body composition (g) measured via nuclear magnetic resonance. Body weight (A) and body fat (B) across the life course, stratified by offspring sex. P values represent nanogram (n=10 female, 10 male), microgram (n=10 female, 11 male), or milligram (n=9 female, 9 male) BPA-exposed offspring compared to control offspring (n=10 female, 10 male).
Hormone panel
The mean baseline glucose and insulin levels in milligram-exposed females were lower compared to controls (P=0.05 and P=0.10, respectively; Fig. 5A). HOMA-IR was conducted to capture insulin sensitivity among the exposure groups. The milligram-exposed females displayed a HOMA index of 3.02 vs. 8.12 for the control females (P=0.10; Fig. 5C). The mean adiponectin levels in nanogram- and milligram-exposed females were 57.3 and 47 μg/ml, respectively, compared to 31.1 μg/ml in controls (P=0.02 and P=0.10, respectively; Fig. 5D). Alternatively, males exposed to 50 μg BPA/kg had marginally significant lower levels of adiponectin (P=0.06; Fig. 5D). Serum leptin levels in milligram-exposed females were 11.1 ng/ml compared to female control serum levels of 18 ng/ml (P=0.10; Fig. 5E).
Figure 5.

Hormones measured at 9 or 10 mo of age. A) Glucose (mg/dl) and insulin (ng/ml), measured via a fasting OGTT at baseline and at 15, 30, 60, and 120 min at 9 mo of age. P values represent nanogram (n=9 female), micrograms (n=10 female), or milligrams (n=9 female) BPA-exposed offspring compared to control offspring (n=9 female); nanogram and control offspring sample sizes were altered due to early decease. B) Glucose (mg/dl) and insulin (ng/ml), measured via a fasting OGTT at baseline and at 15, 30, 60, and 120 min at 9 mo of age. P values represent nanogram (n=10 male), microgram (n=11 male), or milligram (n=9 male) BPA-exposed offspring compared to control offspring (n=10 male). C) HOMA-IR calculated from fasting OGTT scores. D, E) Adiponectin (μg/ml; D) and leptin (ng/ml; E) measured via ELISA at 10 mo of age. P values represent nanogram (n=9 female, 10 male), microgram (n=10 female, 11 male), or milligram (n=9 female, 9 male) BPA-exposed offspring compared to control offspring (n=9 female, 10 male); nanogram and control offspring sample sizes were altered due to early decease. *P < 0.10, **P < 0.05.
DISCUSSION
Offspring exposed to 50 ng, 50 μg, and 50 mg of BPA/kg of diet during gestation and lactation developed an overall increase in energy expenditure throughout their life course, measured via indirect calorimetry in comparison to unexposed control offspring across a 72-h period. Limited studies explore in utero environmental exposures, especially BPA, and their effect on oxygen consumption and carbon dioxide production. McKenzie et al. (40) explored heavy metal and organic compound (PAH, PCB, and OCP) exposure on the metabolic rate of adult fish in different geographical species and reported that exposed cyprinid fish in The Netherlands developed an increased resting metabolic rate. In contrast to the increased energy expenditure observed in our perinatal BPA exposure offspring cohort, adult short-term BPA exposure to 100 μg/kg BW via injection in mice resulted in decreased energy expenditure, indicating that timing, duration, and route of BPA exposure may have differing effects on metabolic endpoints (41).
Corresponding to the observed increase in energy expenditure in the current study, spontaneous activity levels were increased in offspring following perinatal BPA exposure, with outcomes more prominent among females. The hyperactive phenotype found in animal models is analogous to human clinical disorders like ADHD and aggression (42). Multiple animal models have been used to assess early life exposure to BPA and its effect on activity and behavior-related outcomes. In mice, a single oral dose of 0.32, 3.2, or 4.8 mg BPA/kg BW at PND 10 initiated hyperactivity in males as adults (43). In 3-wk-old male rats exposed to a maternal diet of 2 μg BPA/kg BW from GD 7 to PND 10, Zhou et al. (26) reported increased activity and discovered corresponding alterations to the dopaminergic system, which is a known target in disorders like ADHD (44). Zebrafish larvae exposed to 0.01 and 0.1, μM of BPA for 48 h during postfertilization revealed hyperactivity as adults compared to unexposed controls (45). Furthermore, human epidemiological evidence noted positive relationships among maternal gestational urinary BPA levels and hyperactivity and aggression in children, especially in females (24, 28).
In this present study, sophisticated NMR body composition analysis revealed marginally significant changes in body weight and fat mass. In a previous report, female and male rats exposed to 2.5 or 5 μg BPA/kg BW/d from GD 6 through PND 21 had significantly lower body weights compared to controls from PND 0 to 21 (46). Using repeated body weight measurements, CD-1 mice exposed to dietary BPA during gestation and lactation were heavier than controls at 4 wk of age, but this association was diminished in adulthood, and the effect did not persist in offspring fed a high-fat diet (47). Alternatively, Wei et al. (48) looked at perinatal exposure to several doses of BPA by oral gavage in rats. As adults, offspring developed increased body weight when exposed to 50 μg/kg perinatally, which was exacerbated when offspring were fed a high-fat diet. Female offspring exposed to 70 μg BPA/kg BW/d via maternal drinking water from GD 6 through lactation displayed increased body weight on weaning, with a corresponding increase in white adipose tissue and expression of lipogenic genes (18).
With much attention focused on body weight and composition after early life BPA exposure, researchers have developed a natural concern of BPA's influence on insulin sensitivity and glucose tolerance as metabolic endpoints. Within this study, our fasting glucose and insulin tolerance test revealed an increase in insulin sensitivity, with further validation using the HOMA-IR index in females treated with 50 mg BPA/kg diet in utero and through lactation. Conflicting evidence has emerged in the literature indicating that BPA exposure in early development induces early signs of type 2 diabetes and metabolic syndrome such as glucose intolerance and insulin resistance (49). For instance, male rat offspring from dams fed a BPA-supplemented diet during gestation exhibited glucose intolerance and insulin insensitivity at 6 mo of age (17). Adult female and male rats exposed to BPA in utero displayed altered glucose and insulin homeostasis, which was exacerbated in males fed a high-fat diet (48).
We found that exposure to 50 ng and 50 mg of BPA/kg diet increased serum adiponectin levels in female adult offspring. Adiponectin enhances insulin responsiveness and glucose uptake, is mainly produced by adipose tissue, and is negatively correlated with fat mass in humans (50). Previous reports have shown that BPA inhibits the release of adiponectin from human adipose tissue, which suggests that BPA may promote the development of insulin resistance (51). Interestingly, the elevated levels of adiponectin in our study were seen concurrently with increased spontaneous activity and reduced fat mass in nanogram- and milligram-exposed female offspring, and reduced insulin and HOMA-IR in milligram-exposed female offspring with modestly lower levels of glucose during an OGTT. Thus, our data suggest that perinatal exposure to BPA elevates adiponectin, and this may have occurred as a consequence to hyperactivity and reduced body fat. Of note, significant effects on these endpoints were not observed in the microgram-dose group, indicating possible nonmonotonic effects of perinatal BPA exposure, an area of active interest and investigation (31, 52, 53).
We report significantly decreased serum leptin following exposure to 50 mg BPA among females and modestly lower (nonsignificant) leptin levels among microgram- and nanogram-, and microgram- and milligram-exposed females and males, respectively. Leptin is a hormone produced by adipose tissue that is positively correlated with body fat mass and plays a key role in energy homeostasis (50). There are limited in vivo studies on leptin following BPA exposure. Briefly, one study has shown that perinatal BPA exposure resulted in increased serum leptin levels in both females and males on both a high-fat and normal-fat diet, which was positively associated with body fat (48). In another report, serum leptin levels at PND 21 were unchanged vs. controls in rats exposed to 2.5 or 5 μg BPA/kg BW/d perinatally (46). In contrast to previous reports, our data propose that decreased leptin levels are correlated with reduced body fat following perinatal BPA exposure.
Alterations in metabolic phenotypes in BPA exposed offspring were more prominent in females than males, within the current study. Other literature describes early life BPA exposure resulting in gender specific outcomes as well (24). Early life BPA exposure can affect sexually dimorphic traits in vivo when normal circulating levels of androgens are needed during brain development to shape sexually distinct behaviors (42, 54, 55). Variable outcomes across studies highlighted throughout this discussion may be attributable to nonstandardized dietary fat and/or phytoestrogen content and/or inconsistent use of sophisticated measurements of body composition and energy expenditure conducted at multiple time-points across the life course. Of note, our exposure paradigm included a phytoestrogen-free and non-high-fat background diet. Future studies are needed to evaluate whether diet modifies the effects of perinatal BPA exposure on metabolic and hormonal parameters throughout the life course. Studies will need to continue to focus on timing of exposure, dose levels (particularly doses relevant to human exposure), and differences among strains and species in order to elucidate the complete phenotypic depiction of early life BPA exposure on the development of adult disease. In addition, the affected biological pathways will need to be determined, for example, by evaluating epigenome-wide methylation and chromatin profiles, in order to understand the mechanism linking early BPA exposure to later disease risk.
Acknowledgments
The authors thank Charles Burant, Nathan Qi, Malcolm Low, Katie Gee, and Melanie Schmidt [University of Michigan Nutrition and Obesity Research Center (MNORC) Animal Phenotyping Core] and Edmund O'Brien (Department of Environmental Health Sciences, University of Michigan) for their technical and intellectual assistance with this project.
This work was supported by a pilot grant from the MNORC (P30 DK089503), as well as U.S. National Institutes of Health grant R01 ES017524, University of Michigan National Institute of Environmental Health Sciences (NIEHS) Center of Excellence grant P30 ES017885, and University of Michigan NIEHS/Environmental Protection Agency Children's Environmental Health Formative Center grant P20 ES018171/RD83480001.
The authors declare no conflicts of interest.
This article includes supplemental data. Please visit http://www.fasebj.org to obtain this information.
- AhR
- aryl hydrocarbon receptor
- ADHD
- attention-deficit and hyperactivity disorder
- BPA
- bisphenol A
- BW
- body weight
- CLAMS
- Comprehensive Lab Animal Monitoring System
- CNS
- central nervous system
- ELISA
- enzyme-linked immunosorbent assay
- ER
- estrogen receptor
- ERR
- estrogen-related receptor
- GD
- gestational day
- GPR30
- G-protein-coupled receptor 30
- HOMA-IR
- homeostatic model assessment of insulin resistance
- IR
- infrared
- NMR
- nuclear magnetic resonance
- OGTT
- oral glucose tolerance test
- PPAR
- peroxisome proliferator-activated receptors
- PND
- postnatal day
REFERENCES
- 1. Calafat A., Ye X., Wong L., Reidy J., Needham L. (2008) Exposure of the U.S. population to bisphenol A and 4-tertiary-octylphenol: 2003–2004. Environ. Health Perspect. 116, 39–44 [DOI] [PMC free article] [PubMed] [Google Scholar]
- 2. Zhang Z., Alomirah H., Cho H. S., Li Y. F., Liao C., Minh T. B., Mohd M. A., Nakata H., Ren N., Kannan K. (2011) Urinary bisphenol A concentrations and their implications for human exposure in several Asian countries. Environ. Sci. Technol. 45, 7044–7050 [DOI] [PubMed] [Google Scholar]
- 3. Vandenberg L. N., Chahoud I., Heindel J. J., Padmanabhan V., Paumgartten F. J. R., Schoenfelder G. (2010) Urinary, circulating, and tissue biomonitoring studies indicate widespread exposure to bisphenol A. Environ. Health Perspect. 118, 1055–1070 [DOI] [PMC free article] [PubMed] [Google Scholar]
- 4. Gould J. C., Leonard L. S., Maness S. C., Wagner B. L., Conner K., Zacharewski T., Safe S., McDonnell D. P., Gaido K. W. (1998) Bisphenol A interacts with the estrogen receptor α in a distinct manner from estradiol. Mol. Cell. Endocrinol. 142, 203–214 [DOI] [PubMed] [Google Scholar]
- 5. Kuiper G. G. J. M., Lemmen J. G., Carlsson B., Corton J. C., Safe S. H., van der Saag P. T., van der Burg B., Gustafsson J.-Å. (1998) Interaction of estrogenic chemicals and phytoestrogens with estrogen receptor β. Endocrinology 139, 4252–4263 [DOI] [PubMed] [Google Scholar]
- 6. Thomas P., Dong J. (2006) Binding and activation of the seven-transmembrane estrogen receptor GPR30 by environmental estrogens: a potential novel mechanism of endocrine disruption. J. Steroid Biochem. Mol. Biol. 102, 175–179 [DOI] [PubMed] [Google Scholar]
- 7. Takayanagi S., Tokunaga T., Liu X., Okada H., Matsushima A., Shimohigashi Y. (2006) Endocrine disruptor bisphenol A strongly binds to human estrogen-related receptor gamma (ERRgamma) with high constitutive activity. Toxicol. Lett. 167, 95–105 [DOI] [PubMed] [Google Scholar]
- 8. Sui Y., Ai N., Park S. H., Rios-Pilier J., Perkins J. T., Welsh W. J., Zhou C. (2012) Bisphenol A and its analogues activate human pregnane X receptor. Environ. Health Perspect. 120, 399–405 [DOI] [PMC free article] [PubMed] [Google Scholar]
- 9. Kruger T., Long M., Bonefeld-Jorgensen E. C. (2008) Plastic components affect the activation of the aryl hydrocarbon and the androgen receptor. Toxicology 246, 112–123 [DOI] [PubMed] [Google Scholar]
- 10. Decherf S., Demeneix B. A. (2011) The Obesogen Hypothesis: A shift of focus from the periphery to the hypothalamus. J. Toxicol. Environ. Health B 14, 423–448 [DOI] [PubMed] [Google Scholar]
- 11. Heindel J. J., vom Saal F. S. (2009) Role of nutrition and environmental endocrine disrupting chemicals during the perinatal period on the aetiology of obesity. Mol. Cell. Endocrinol. 304, 90–96 [DOI] [PubMed] [Google Scholar]
- 12. Kuiper G. G., Lemmen J. G., Carlsson B., Corton J. C., Safe S. H., van der Saag P. T., van der Burg B., Gustafsson J. A. (1998) Interaction of estrogenic chemicals and phytoestrogens with estrogen receptor beta. Endocrinology 139, 4252–4263 [DOI] [PubMed] [Google Scholar]
- 13. Moriyama K., Tagami T., Akamizu T., Usui T., Saijo M., Kanamoto N., Hataya Y., Shimatsu A., Kuzuya H., Nakao K. (2002) Thyroid hormone action is disrupted by bisphenol A as an antagonist. J. Clin. Endocrinol. Metab. 87, 5185–5190 [DOI] [PubMed] [Google Scholar]
- 14. Bateson P., Barker D., Clutton-Brock T., Deb D., D'Udine B., Foley R. A., Gluckman P., Godfrey K., Kirkwood T., Lahr M. M., McNamara J., Metcalfe N. B., Monaghan P., Spencer H. G., Sultan S. E. (2004) Developmental plasticity and human health. Nature 430, 419–421 [DOI] [PubMed] [Google Scholar]
- 15. Jirtle R. L., Skinner M. K. (2007) Environmental epigenomics and disease susceptibility. Nat. Rev. Genet. 8, 253–262 [DOI] [PMC free article] [PubMed] [Google Scholar]
- 16. Rubin B. S., Soto A. M. (2009) Bisphenol A: Perinatal exposure and body weight. Mol. Cell. Endocrinol. 304, 55–62 [DOI] [PMC free article] [PubMed] [Google Scholar]
- 17. Alonso-Magdalena P., Vieira E., Soriano S., Menes L., Burks D., Quesada I., Nadal A. (2010) Bisphenol A exposure during pregnancy disrupts glucose homeostasis in mothers and adult male offspring. Environ. Health Perspect. 118, 1243–1250 [DOI] [PMC free article] [PubMed] [Google Scholar]
- 18. Somm E., Schwitzgebel V., Toulotte A., Cederroth C., Combescure C., Nef S., Aubert M., Hüppi P. (2009) Perinatal exposure to bisphenol A alters early adipogenesis in the rat. Environ. Health Perspect. 117, 1549–1555 [DOI] [PMC free article] [PubMed] [Google Scholar]
- 19. Hugo E.R., Brandebourg T.D., Woo J.G., Loftus J., Alexander J. W., Ben-Jonathan N. (2008) Bisphenol A at environmentally relevant doses inhibits adiponectin release from human adipose tissue explants and adipocytes. Environ. Health Perspect. 116, 1642–1647 [DOI] [PMC free article] [PubMed] [Google Scholar]
- 20. Lang I. A., Galloway T. S., Scarlett A., Henley W. E., Depledge M., Wallace R. B., Melzer D. (2008) Association of urinary bisphenol A concentration with medical disorders and laboratory abnormalities in adults. JAMA 300, 1303–1310 [DOI] [PubMed] [Google Scholar]
- 21. Trasande L., Attina T. M., Blustein J. (2012) Association between urinary bisphenol a concentration and obesity prevalence in children and adolescents. JAMA 308, 1113–1121 [DOI] [PubMed] [Google Scholar]
- 22. Newbold R. R. (2010) Impact of environmental endocrine disrupting chemicals on the development of obesity. Hormones (Athens, Greece) 9, 206–217 [DOI] [PubMed] [Google Scholar]
- 23. Masuo Y., Ishido M. (2011) Neurotoxicity of endocrine disruptors: possible involvement in brain development and neurodegeneration. J. Toxicol. Environ. Health B 14, 346–369 [DOI] [PubMed] [Google Scholar]
- 24. Braun J. M., Kalkbrenner A. E., Calafat A. M., Yolton K., Ye X., Dietrich K. N., Lanphear B. P. (2011) Impact of early-life bisphenol A exposure on behavior and executive function in children. Pediatrics 128, 873–882 [DOI] [PMC free article] [PubMed] [Google Scholar]
- 25. Kundakovic M., Champagne F. A. (2011) Epigenetic perspective on the developmental effects of bisphenol A. Brain Behav. Immun. 25, 1084–1093 [DOI] [PMC free article] [PubMed] [Google Scholar]
- 26. Zhou R., Bai Y., Yang R., Zhu Y., Chi X., Li L., Chen L., Sokabe M., Chen L. (2011) Abnormal synaptic plasticity in basolateral amygdala may account for hyperactivity and attention-deficit in male rat exposed perinatally to low-dose bisphenol-A. Neuropharmacology 60, 789–798 [DOI] [PubMed] [Google Scholar]
- 27. Matsuda S., Saika S., Amano K., Shimizu E., Sajiki J. (2010) Changes in brain monoamine levels in neonatal rats exposed to bisphenol A at low doses. Chemosphere 78, 894–906 [DOI] [PubMed] [Google Scholar]
- 28. Braun J. M., Yolton K., Dietrich K. N., Hornung R., Ye X., Calafat A. M., Lanphear B. P. (2009) Prenatal bisphenol A exposure and early childhood behavior. Environ. Health Perspect. 117, 1945–1952 [DOI] [PMC free article] [PubMed] [Google Scholar]
- 29. Waterland R., Jirtle R. (2003) Transposable elements: targets for early nutritional effects on epigenetic gene regulation. Mol. Cell. Biol. 23, 5293–5300 [DOI] [PMC free article] [PubMed] [Google Scholar]
- 30. Takahashi O., Oishi S. (2003) Testicular toxicity of dietarily or parenterally administered bisphenol A in rats and mice. Food Chem. Toxicol. 41, 1035–1044 [DOI] [PubMed] [Google Scholar]
- 31. Anderson O. S., Nahar M. S., Faulk C., Jones T. R., Liao C., Kannan K., Weinhouse C., Rozek L. S., Dolinoy D. C. (2012) Epigenetic responses following maternal dietary exposure to physiologically relevant levels of bisphenol A. Environ. Mol. Mutagen. 53, 334–342 [DOI] [PMC free article] [PubMed] [Google Scholar]
- 32. Sieli P. T., Jašarević E., Warzak D. A., Mao J., Ellersieck M. R., Liao C., Kannan K., Collet S. H., Toutain P.-L., vom Saal F. S., Rosenfeld C. S. (2011) Comparison of serum bisphenol A concentrations in mice exposed to bisphenol A through the diet versus oral bolus exposure. Environ. Health Perspect. 119, 1260–1265 [DOI] [PMC free article] [PubMed] [Google Scholar]
- 33. Institute of Laboratory Animal Resources (1966) Guide for the Care and Use of Laboratory Animals, National Academy Press, Washington, DC [Google Scholar]
- 34. Miltenberger R., Mynatt R., Wilkinson J., Woychik R. (1997) The role of the agouti gene in the yellow obese syndrome. J. Nutr. 127, 1902S–1907S [DOI] [PubMed] [Google Scholar]
- 35. Morgan H., Sutherland H., Martin D., Whitelaw E. (1999) Epigenetic inheritance at the agouti locus in the mouse. Nat. Genet. 23, 314–318 [DOI] [PubMed] [Google Scholar]
- 36. Becker J. B., Arnold A. P., Berkley K. J., Blaustein J. D., Eckel L. A., Hampson E., Herman J. P., Marts S., Sadee W., Steiner M., Taylor J., Young E. (2005) Strategies and methods for research on sex differences in brain and behavior. Endocrinology 146, 1650–1673 [DOI] [PubMed] [Google Scholar]
- 37. Osman A. F., Mehra M. R., Lavie C. J., Nunez E., Milani R. V. (2000) The incremental prognostic importance of body fat adjusted peak oxygen consumption in chronic heart failure. J. Am. Coll. Cardiol. 36, 2126–2131 [DOI] [PubMed] [Google Scholar]
- 38. Goodell S., Cortopassi G. (1998) Analysis of oxygen consumption and mitochondrial permeability with age in mice. Mech. Ageing Dev. 101, 245–256 [DOI] [PubMed] [Google Scholar]
- 39. Stern J. H., Kim K., Ramsey J. J. (2012) The influence of Shc proteins and aging on whole body energy expenditure and substrate utilization in mice. PLoS ONE 7, e48790. [DOI] [PMC free article] [PubMed] [Google Scholar]
- 40. McKenzie D. J., Garofalo E., Winter M. J., Ceradini S., Verweij F., Day N., Hayes R., van der Oost R., Butler P. J., Chipman J. K., Taylor E. W. (2007) Complex physiological traits as biomarkers of the sub-lethal toxicological effects of pollutant exposure in fishes. Phil. Trans. R. Soc. B Biol. Sci. 362, 2043–2059 [DOI] [PMC free article] [PubMed] [Google Scholar]
- 41. Batista T. M., Alonso-Magdalena P., Vieira E., Amaral M. E. C., Cederroth C. R., Nef S., Quesada I., Carneiro E. M., Nadal A. (2012) Short-term treatment with bisphenol-A leads to metabolic abnormalities in adult male mice. PLoS ONE 7, e33814. [DOI] [PMC free article] [PubMed] [Google Scholar]
- 42. Wolstenholme J. T., Rissman E. F., Connelly J. J. (2011) The role of bisphenol A in shaping the brain, epigenome and behavior. Hormones Behav. 59, 296–305 [DOI] [PMC free article] [PubMed] [Google Scholar]
- 43. Viberg H., Fredriksson A., Buratovic S., Eriksson P. (2011) Dose-dependent behavioral disturbances after a single neonatal bisphenol A dose. Toxicology 290, 188–195 [DOI] [PubMed] [Google Scholar]
- 44. Ishido M., Morita M., Oka S., Masuo Y. (2005) Alteration of gene expression of G protein-coupled receptors in endocrine disruptors-caused hyperactive rats. Reg. Peptides 126, 145–153 [DOI] [PubMed] [Google Scholar]
- 45. Saili K. S., Corvi M. M., Weber D. N., Patel A. U., Das S. R., Przybyla J., Anderson K. A., Tanguay R. L. (2012) Neurodevelopmental low-dose bisphenol A exposure leads to early life-stage hyperactivity and learning deficits in adult zebrafish. Toxicology 291, 83–92 [DOI] [PMC free article] [PubMed] [Google Scholar]
- 46. Ferguson S. A., Law C. D., Abshire J. S. (2011) Developmental treatment with bisphenol A or ethinyl estradiol causes few alterations on early preweaning measures. Toxicol. Sci. 124, 149–160 [DOI] [PubMed] [Google Scholar]
- 47. Ryan K. K., Haller A. M., Sorrell J. E., Woods S. C., Jandacek R. J., Seeley R. J. (2010) Perinatal exposure to bisphenol-a and the development of metabolic syndrome in CD-1 Mice. Endocrinology 151, 2603–2612 [DOI] [PMC free article] [PubMed] [Google Scholar]
- 48. Wei J., Lin Y., Li Y., Ying C., Chen J., Song L., Zhou Z., Lv Z., Xia W., Chen X., Xu S. (2011) Perinatal exposure to bisphenol A at reference dose predisposes offspring to metabolic syndrome in adult rats on a high-fat diet. Endocrinology 152, 3049–3061 [DOI] [PubMed] [Google Scholar]
- 49. Vom Saal F. S., Nagel S. C., Coe B. L., Angle B. M., Taylor J. A. (2012) The estrogenic endocrine disrupting chemical bisphenol A (BPA) and obesity. Mol. Cell. Endocrinol. 354, 74–84 [DOI] [PMC free article] [PubMed] [Google Scholar]
- 50. Ahima R. S. (2006) Metabolic actions of adipocyte hormones: focus on adiponectin. Obesity 14, 9S–15S [DOI] [PubMed] [Google Scholar]
- 51. Ben-Jonathan N., Hugo E. R., Brandebourg T. D. (2009) Effects of bisphenol A on adipokine release from human adipose tissue: implications for the metabolic syndrome. Mol. Cell. Endocrinol. 304, 49–54 [DOI] [PMC free article] [PubMed] [Google Scholar]
- 52. Vandenberg L. N., Colborn T., Hayes T. B., Heindel J. J., Jacobs D. R., Lee D.-H., Shioda T., Soto A. M., vom Saal F. S., Welshons W. V., Zoeller R. T., Myers J. P. (2012) Hormones and endocrine-disrupting chemicals: low-dose effects and nonmonotonic dose responses. Endocr. Rev. 33, 378–455 [DOI] [PMC free article] [PubMed] [Google Scholar]
- 53. Jones B. A., Watson N. V. (2012) Perinatal BPA exposure demasculinizes males in measures of affect but has no effect on water maze learning in adulthood. Hormones Behav. 61, 605–610 [DOI] [PubMed] [Google Scholar]
- 54. Patisaul H. B., Polston E. K. (2008) Influence of endocrine active compounds on the developing rodent brain. Brain Res. Rev. 57, 352–362 [DOI] [PubMed] [Google Scholar]
- 55. Jašarević E., Sieli P. T., Twellman E. E., Welsh T. H., Schachtman T. R., Roberts R. M., Geary D. C., Rosenfeld C. S. (2011) Disruption of adult expression of sexually selected traits by developmental exposure to bisphenol A. Proc. Natl. Acad. Sci. U. S. A. 108, 11715–11720 [DOI] [PMC free article] [PubMed] [Google Scholar]