

Intravenous iodinated contrast material is an independent risk factor for post-CT acute kidney injury, but not in patients with a stable serum creatinine level less than 1.5 mg/dL.
Abstract
Purpose:
To determine whether intravenous low-osmolality iodinated contrast material is associated with post–computed tomography (CT) acute kidney injury (AKI).
Materials and Methods:
Institutional review board approval was obtained and patient consent waived for this HIPAA-compliant retrospective study. CT examinations performed over a 10-year period in adult inpatients with sufficient serum creatinine (SCr) data were identified. A one-to-one propensity-matched matched cohort analysis with multivariate analysis of effects was performed with post-CT AKI as the primary outcome measure (10 121 unenhanced and 10 121 intravenous contrast-enhanced CT examinations in 20 242 patients). Propensity matching was performed with respect to likelihood of patient receiving intravenous contrast material (36 tested covariates). The primary endpoint was post-CT AKI by using Acute Kidney Injury Network SCr criteria; the secondary endpoint was post-CT AKI by using traditional SCr criteria for contrast material–induced nephrotoxicity (CIN; SCr increase ≥0.5 mg/dL [44.20μmol/L] or ≥25%). Multivariate subgroup threshold analysis was performed (SCr <1.5 [<132.60 μmol/L]; ≥1.5 to ≥2.0 mg/dL [≥132.60 to ≥176.80 μmol/L]) and adjusted for assigned propensity scores.
Results:
Intravenous low-osmolality iodinated contrast material had a significant effect on the development of post-CT AKI for patients with pre-CT SCr levels of 1.6 mg/dL (141.44 μmol/L) or greater (odds ratio, 1.45; 95% confidence interval [CI]: 1.11, 1.89;P = .007). This effect strengthened as pre-CT SCr increased. Patients with stable SCr less than 1.5 mg/dL (132.60 μmol/L) were not at risk for developing CIN (P = .25, power > 95%). Both endpoints demonstrated similar results (eg, SCr ≥1.6 mg/dL [141.44 μmol/L] by using traditional CIN criteria: odds ratio, 1.64; 95% CI: 1.18, 2.28; P = .003). Post-CT AKI was prevalent in both the unenhanced and contrast-enhanced CT subgroups, and it increased with increases in pre-CT SCr. Many risk factors contributed to development of post-CT AKI, regardless of iodinated contrast material.
Conclusion:
Intravenous low-osmolality iodinated contrast material is a nephrotoxic risk factor, but not in patients with a stable SCr level less than 1.5 mg/dL. Many factors other than contrast material can affect post-CT AKI rates.
© RSNA, 2013
Introduction
Contrast material–induced nephrotoxicity (CIN) is often cited (1–7) as a common cause of acute kidney injury (AKI). In a fraction of patients, AKI can lead to permanent morbidity and mortality (1,5,6). Some authors (1) have found that CIN is the third most common cause of hospital-acquired AKI. Most studies that investigated CIN assessed increases in serum creatinine (SCr) levels after intravascular contrast material administration (usually for cardiac angiography). Few studies have assessed the risk after intravenous administration, and most studies have not included a control group of patients who were not exposed to intravascular contrast material (8). Therefore, any change in SCr level that meets the defined threshold for postcontrast AKI is diagnosed as CIN. This approach does not account for background fluctuations in SCr, which have been recognized as a common phenomenon (9,10), or other causes of renal dysfunction that happen to be temporally related to the administration of intravascular contrast material. In many cases, CIN is a misnomer, because the name implies that contrast material—and not one of numerous other potential origins—is the causative factor in the development of post–computed tomography (CT) AKI.
Recent attempts to address this problem by Newhouse et al (9) and Bruce et al (10) have produced interesting results. These authors have retrospectively shown that the rates of post-CT AKI in patients who did not receive intravenous contrast material were similar or identical to those in patients who received intravenous iodinated contrast material. These results (11,12) suggested that CIN from intravenous administration of contrast material is either much less common than originally thought or does not occur at all. However, a limitation of these retrospective studies is that although they incorporated a control group of patients who were not exposed to contrast material, they did not account for the selection bias that exists in the unenhanced CT groups (other than absolute values of pre-CT SCr) that may have predisposed certain patients to not receive contrast material.
A matched cohort propensity score analysis is a statistical method by which selection bias can be reduced in a retrospective study (13). In our context, numerous risk factors that could have predicted whether a patient may or may not have been given intravenous contrast material were analyzed and assigned a propensity score—this score indicates the likelihood that contrast material might be administered if the risk factor is present. When multiple risk factors were present in a single patient, each risk factor was considered and an overall propensity score was assigned. Patients who received intravenous contrast material were matched in a one-to-one ratio to patients who did not receive intravenous contrast material and who had an identical overall propensity score. This resulted in a data set composed of matched patients who, based on the risk factors incorporated into the model, had a statistically identical likelihood of exposure to intravenous contrast material.
This study used a propensity-adjusted analysis to compare the incidence of post-CT AKI in patients exposed to intravenous contrast material with that of patients who were not exposed to intravenous contrast material and controlled for the selection bias inherent to these groups. The purpose of our study was to determine whether intravenous iodinated contrast material was associated with post-CT AKI (ie, CIN).
Materials and Methods
Institutional review board approval was obtained before we began this retrospective investigation. The study was carried out in compliance with the Health Insurance Portability and Accountability Act. Patient informed consent was waived. No industry support was provided or utilized for this study. R.H.C. and J.H.E. are consultants to GE Healthcare. M.S.D. and S.K. had control of all data that might present a conflict of interest for those authors.
Patients
All CT examinations, regardless of indication and with or without intravenous contrast material, that were performed in adult (≥18 years) inpatients from January 1, 2000, to May 14, 2010, at a single large academic health system were identified by querying the institutional electronic medical record system (429 681 CT examinations). CT examinations that were not contrast enhanced and were followed by CT examinations with contrast material were treated as contrast-enhanced examinations.
Inclusion criteria were CT examinations that were performed in patients who had never undergone renal replacement therapy (eg, dialysis, renal transplantation) and who had all of the following SCr measurements available: (a) baseline SCr (the most recent SCr obtained more than 5 days prior to the index CT examination), (b) pre-CT SCr (the most recent SCr obtained between the time of index CT and 5 days before), and (c) at least one of three early values of post-CT SCr (the first SCr obtained in each 24-hour period for the first 72 hours after the index CT). There were 75 741 CT examinations that met the inclusion criteria.
We excluded CT examinations if they were in a patient who had an earlier CT examination that met the inclusion criteria (42 330 CT examinations). An additional 241 examinations were excluded because of missing data regarding contrast material administration. Of the remaining 33 170 CT examinations that were performed in unique patients, an additional 12 928 were excluded because they lacked a one-to-one propensity-matched control.
We used 20 242 CT examinations (10 121 with intravenous contrast material and 10 121 without intravenous contrast material) in a study population composed of 20 242 unique patients. Of these patients, 5188 women (mean age, 59 years; range, 18–104 years) and 4933 men (mean age, 58 years; range, 18–101 years) were in the unenhanced CT group, and 5210 women (mean age, 59 years; range, 18–102 years) and 4911 men (mean age, 59 years; range, 18–96 years) were in the contrast-enhanced CT group.
Contrast Material
Several different iodinated contrast materials were used throughout the study. These included the following: iopamidol 300 (957 injections; Bracco Imaging, Princeton, NJ), iopamidol 370 (587 injections; Bracco Imaging), iodixanol 320 (485 injections; GE Healthcare, Princeton, NJ), iopromide 300 (2672 injections; Bayer HealthCare, Wayne, NJ), iopromide 370 (1245 injections; Bayer Healthcare), and iohexol 240 and 300 (unknown number of injections for either agent; GE Healthcare). There were 4175 contrast-enhanced CT examinations in which the specific contrast material could not be identified, although the contrast material was one of the previously listed agents. Choice of contrast material was based on the preference of the radiologist, CT protocol (eg, contrast materials with a higher iodine concentration were used for CT angiography), and/or prime vendor contracts with individual manufacturers that changed periodically throughout the study period. Iodixanol was used primarily in patients with chronic renal insufficiency (≥2.0 mg/dL [176.80 μmol/L] SCr in the general population or ≥1.5 mg/dL [132.60 μmol/L] in patients with diabetes mellitus), although that practice was discontinued after the study period. The volume of contrast material was both weight-based and CT protocol–dependent, and ranged from 30 to 200 mL per examination.
CIN prophylaxis at our institution is not standardized and determined by the clinical services. In our experience, this usually consists of intravenous hydration with isotonic fluids, with or without additional adjunctive measures. The indications for CIN prophylaxis are heterogeneous and vary by clinical service. We were unable to accurately and retrospectively determine what type and dose of prophylaxis was administered for any given patient.
Laboratory Definition of AKI
We elected to use the definition of AKI from the Acute Kidney Injury Network (AKIN) as our primary outcome measure. It is a globally applicable definition of AKI (14) that has been used in recent CIN studies (3,15) and is defined as either an absolute SCr increase of 0.3 mg/dL (26.52 μmol/L) or greater or as an increase in SCr that is 1.5 times above baseline. We did not use the AKIN urine output criteria because these data were not available. If one or more of the post-CT SCr levels met AKIN laboratory criteria for AKI based on comparison to the pre-CT SCr, the patient was considered to have post-CT AKI.
The AKIN criteria are designed to accommodate changes in SCr that are observed within 48 hours of the inciting event. To attempt to satisfy the AKIN criteria in our study, we included the first SCr measurement that was made during the third 24-hour period to account for cases in which there were only daily early morning SCr measurements obtained.
The AKIN definition of AKI utilized in this study has been suggested in a manual from the American College of Radiology (16) as a way to standardize the multifarious definitions of CIN present in the literature. By using the AKIN criteria, we allowed comparison of our AKI rates with other potentially nephrotoxic drugs and conditions. To validate the use of this definition, we also performed a secondary analysis by using an alternative but more traditional definition of CIN, which defined CIN as an absolute SCr increase of 0.5 mg/dL (44.20 μmol/L) or more, or an increase in SCr that is 1.25 times above baseline.
Pre-CT Assessment of Renal Function
For each CT examination, pre-CT SCr was compared with the baseline SCr. If pre-CT SCr met criteria for AKI by using this comparison, it was designated as unstable renal function, worsening. The term unstable renal function, improving was applied when there was an absolute SCr decrease of 0.3 mg/dL or more below baseline, or a decrease in SCr by 50% or more below baseline, when comparing pre-CT SCr with baseline SCr. The term stable renal function was applied to cases in which neither set of conditions was met. These categories refer to the status of the patient’s renal function immediately prior to the index CT.
Risk Factors
Numerous covariates that may have increased the risk of patients developing AKI around the time of CT were derived and extrapolated from relevant publications and guidelines regarding CIN (16–20), and were cataloged for each patient and incorporated into the propensity score analysis. Diagnoses and medications were derived from admission documentation, discharge documentation, and ICD-9 (International Classification of Diseases, ninth edition) code analysis that pertained to the emergency department or hospital visit associated with the index CT.
Power Calculation
A post hoc statistical power calculation was performed to determine the effect size detectable with our patient cohort. With 9000 subjects per arm, α = .05 (two-sided), and an overall observed rate of post-CT AKI of 7%, we would have 95% statistical power to detect a 1.4% difference in the rate of post-CT AKI between the contrast-enhanced and unenhanced CT subgroups.
Statistical Analysis
One-to-one propensity matching was performed by using a previously published algorithm (13), with respect to the likelihood that a patient would be administered intravenous iodinated contrast material on the basis of the tested covariates. The Wilcoxon rank sum test was used to compare the propensity scores of the contrast-enhanced CT group and unenhanced CT group before and after propensity score matching. The Wilcoxon rank sum test (continuous variables) and χ2 test, Fisher exact test, or Cochran-Mantel-Haenszel test (binary multilevel categoric variables) were used to test for statistically significant differences in risk factors between the unenhanced and contrast-enhanced CT groups before propensity matching. The Wilcoxon signed rank test (continuous variables) and McNemar test or Bowker test of symmetry (binary multilevel categoric variables) were used to test for statistically significant differences in risk factors between the two groups after propensity matching. The Breslow-Day test was used to test matched samples and matched pairs.
Post-CT AKI among propensity-matched subjects was analyzed as an outcome measure. AKIN criteria were used as a primary outcome measure, and the historical definition of CIN was used as a secondary outcome measure. Univariate conditional logistic regression analysis was used to test the association between each risk factor and the rate of post-CT AKI. A stepwise multivariate conditional logistic regression model was then performed to identify the effect of all predictors in the presence of other factors associated with post-CT AKI. Variables with a P value less than .15 in the univariate analyses were included in the multivariate analysis. Odds ratios and 95% confidence intervals (CIs) were calculated to compare post-CT AKI as continuous and categoric predictors. The quintiles of the matched propensity scores were calculated and used as strata in the previously mentioned conditional logistic regression models.
Subgroup univariate and multivariate logistic regression analysis was also performed for patients with SCr values that were less than 1.5 mg/dL (132.60 μmol/L), 1.5 mg/dL or greater, 1.6 mg/dL (141.44 μmol/L) or greater, 1.7 mg/dL (150.28 μmol/L) or greater, 1.8 mg/dL (159.12 μmol/L) or greater, 1.9 mg/dL (167.96 μmol/L) or greater, and 2.0 mg/dL (176.80 μmol/L) or greater. These overlapping thresholds were chosen to reflect a range of SCr cutoff values between 1.5 and 2.0 mg/dL (132.60 and 176.80 μmol/L) that are often used in clinical practice to signal a preprocedure risk of CIN (19). Although the overall analysis was performed by treating the propensity-matched observations as matched pairs, subgroup analysis was performed by treating the propensity scored events as independent observations. This was done because there were insufficient data at each SCr threshold to permit one-to-one matching. However, to address any possible selection bias that may have remained regarding contrast material exposure between patients in each subgroup, the final subgroup multivariate models were adjusted for the propensity scores obtained from the original propensity matching analysis. An interaction term between contrast material administration and pre-CT SCr (treated as a continuous variable) was included in the final model for pre-CT SCr subgroups less than 1.5 mg/dL (132.60 μmol/L) and 1.5 mg/dL or more to determine the differential risk of post-CT AKI with incremental increases in pre-CT SCr.
Univariate and multivariate analyses were also performed on patients with SCr 1.6 mg/dL (141.44 μmol/L) or more who received intravenous contrast material to further test the association between contrast material volume (in milliliters) and contrast material iodine concentration (in milligrams of iodine per milliliter) on the development of post-CT AKI. This subgroup was chosen because it was the lowest threshold that demonstrated a significant effect of contrast material on the development of post-CT AKI by using our primary outcome measure.
A P value of .05 or less indicated a statistically significant outcome for all hypothesis tests. The above procedures were performed by using statistical software (SAS 9.2; SAS Institute, Cary, NC).
Results
Effect of Propensity Matching
The c statistic for our overall one-to-one propensity-matched model was 0.74, which indicates good discrimination.
Table 1 shows the list of tested covariates in the unenhanced and contrast-enhanced CT groups before and after propensity matching. The initial summed propensity score (on a scale of 0 to 1, indicating the likelihood that individual patients would be administered intravenous iodinated contrast material) in the nonmatched population (33 170 patients) differed significantly between the unenhanced and contrast-enhanced CT groups (0.44 ± 0.19 [standard deviation] vs 0.59 ± 0.15; P < .001). This and the individual results shown in Table 1 indicated significant baseline clinical differences before CT between the unmatched populations that justified our use of a propensity-matched analysis. Prior to propensity matching, unmatched patients who received unenhanced CT were less likely to be administered intravenous iodinated contrast material based on their baseline characteristics.
Table 1.
Comparison of Baseline and Pre-CT Covariates for Post-CT AKI in the Unenhanced and Contrast-enhanced CT Groups, before and after Propensity Matching

Note.—Numbers in parentheses are percentages. The denominator for percentages is the overall number of patients within the given unenhanced or contrast-enhanced CT subgroup who have the characteristic. ACE-I = angiotensin-converting enzyme inhibitor, HCTZ = hydrochlorothiazide, ICU = intensive care unit, NA = not applicable, NSAID = nonsteroidal anti-inflammatory drug.
To convert to International System of Units (micromoles per liter), multiply by 88.4.
After one-to-one propensity matching (n = 20 242), the propensity scores for the two populations were statistically equivalent (0.53 ± 0.15 for the unenhanced group and 0.53 ± 0.15 for the contrast-enhanced group; P = .93). This indicated that in the one-to-one propensity-matched population, the unenhanced and contrast-enhanced CT cohorts had statistically identical likelihoods of being administered intravenous contrast material based on the tested risk factors (Table 2). The balance between the matched pairs was further confirmed by using the Breslow-Day test of homogeneity across the strata of propensity score quintiles (P = .48).
Table 2.
Characteristics of the One-to-One Propensity-matched Population

Note.—Numbers in parentheses are percentages. Unenhanced CT studies: 10 121 in 10 121 patients; 10 121 contrast-enhanced CT studies in 10 121 patients. The matched groups are statistically equivalent with respect to their statistical likelihood of administration of intravenous iodinated contrast material (P = .93). The denominator for percentages is the overall number of patients within the given unenhanced or contrast-enhanced CT subgroup who have that parameter. ACE-I = angiotensin-converting enzyme inhibitor CE = contrast enhanced, HCTZ = hydrochlorothiazide,ICU = intensive care unit, NSAID = nonsteroidal anti-inflammatory drug, SD = standard deviation.
To convert to International System of Units (micromoles per liter), multiply by 88.4.
P = .93.
Contrast Material–related Risk Factors for Post-CT AKI
Table 3 shows the results of the univariate analyses with post-CT AKI as a primary outcome measure. Table 4 demonstrates a comparison of the rates of post-CT AKI between the unenhanced and contrast-enhanced CT cohorts for a variety of pre-CT SCr thresholds; P values refer to subgroup multivariate analyses and were controlled for all covariates and the initial propensity score. Table 4 presents a side-by-side comparison of the primary (AKIN criteria) and secondary (traditional definition of CIN) outcome measures. The AKIN criteria had an overall event rate of 8.4% (1702 of 20 242) for post-CT AKI, and the traditional definition of CIN had an overall event rate of 12.3% (2480 of 20 242) for post-CT AKI. The trend in the data for both outcomes was similar. Although intravenous contrast material was not significantly associated with the development of post-CT AKI in the overall model (P = .42 [AKIN criteria]), subgroup analysis demonstrated that it was significantly associated for those patients with pre-CT SCr levels that were 1.6 mg/dL or more (with significance at the ≥1.5 mg/dL threshold by using traditional CIN criteria). The relationship between intravenous contrast material and post-CT AKI strengthened as pre-CT SCr increased (Figure).
Table 3.
Covariates Tested for Inclusion in the Overall Multivariate One-to-One Propensity-matched Model with Post-CT AKI (AKIN Criteria) as Primary Outcome Measure
Note.—Univariate predictors of post-CT AKI (covariates with P < .15) were included. Additional CT studies = number of additional contrast-enhanced CT studies performed within 5 days after the index CT. By definition, no contrast-enhanced CT studies were performed prior to any index CT in this study. Cardiac angiography = number of cardiac angiography procedures performed between 10 days before and 5 days after the index CT. ACE-inhibitor = angiotensin-converting enzyme inhibitor, ED = emergency department, ICU = intensive care unit, NSAID = nonsteroidal anti-inflammatory drug.
Includes direct inpatient admission, ED admission, and inpatient admission from ED.
Table 4.
Effect of Intravenous Iodinated Contrast Material on the Development of Post-CT AKI

Note.—Table reflects a comparison of post-CT AKI rates between unenhanced and contrast-enhanced CT for a variety of overlapping pre-CT SCr thresholds in the one-to-one propensity-matched dataset (20 242 CT studies; 10 121 unenhanced and 10 121 contrast-enhanced studies). Odds ratios and P values refer to subgroup multivariate analysis by using post-CT AKI as the primary outcome measure, while controlling for assigned propensity scores. To convert SCr level to International System of Units (micromoles per liter), multiply by 88.4.
SCr increase by ≥0.3 mg/dL or ≥1.50 × baseline.
SCr increase by ≥0.5 mg/dL or ≥1.25 × baseline.
Figure a:

To convert SCr levels to International System of Units (micromoles per liter), multiply by 88.4. (a) Graph shows odds ratios and 95% CIs for development of post-CT AKI (defined by AKIN SCr criteria; SCr increase by ≥0.3 mg/dL or ≥1.50 times above baseline) comparing contrast-enhanced CT to unenhanced CT in the propensity-score adjusted subgroup multivariate analyses, subdivided by common clinical serum creatinine thresholds. Values on x-axis are thresholds for SCr. For example, odds ratio and 95% CI for 1.7 mg/dL represents the results for subgroup of patients whose pre-CT SCr was 1.7 mg/dL or greater. (b) Graph shows odds ratios and 95% CIs for development of post-CT AKI (defined by traditional CIN SCr criteria; SCr increase by ≥0.5 mg/dL or ≥1.25 times above baseline) by comparing contrast-enhanced CT to unenhanced CT in the propensity-score adjusted subgroup multivariate analyses, subdivided by common clinical serum creatinine thresholds. Values on x-axis are thresholds for SCr. For example, odds ratio and 95% CI for 1.7 mg/dL represents results for subgroup of patients whose pre-CT SCr was ≥1.7 mg/dL.
Figure b:

To convert SCr levels to International System of Units (micromoles per liter), multiply by 88.4. (a) Graph shows odds ratios and 95% CIs for development of post-CT AKI (defined by AKIN SCr criteria; SCr increase by ≥0.3 mg/dL or ≥1.50 times above baseline) comparing contrast-enhanced CT to unenhanced CT in the propensity-score adjusted subgroup multivariate analyses, subdivided by common clinical serum creatinine thresholds. Values on x-axis are thresholds for SCr. For example, odds ratio and 95% CI for 1.7 mg/dL represents the results for subgroup of patients whose pre-CT SCr was 1.7 mg/dL or greater. (b) Graph shows odds ratios and 95% CIs for development of post-CT AKI (defined by traditional CIN SCr criteria; SCr increase by ≥0.5 mg/dL or ≥1.25 times above baseline) by comparing contrast-enhanced CT to unenhanced CT in the propensity-score adjusted subgroup multivariate analyses, subdivided by common clinical serum creatinine thresholds. Values on x-axis are thresholds for SCr. For example, odds ratio and 95% CI for 1.7 mg/dL represents results for subgroup of patients whose pre-CT SCr was ≥1.7 mg/dL.
The contrast versus pre-CT SCr interaction term was significant in the final model for patients with pre-CT SCr levels of 1.5 mg/dL or more (P = .006, odds ratio, 1.26; 95% CI: 1.07, 1.49). This indicated that the odds of a patient developing post-CT AKI after administration of intravenous contrast material would increase by 1.26 for every 1.0 mg/dL increase in SCr above an SCr of 1.5 mg/dL, after controlling for other tested factors. There was no significant effect of intravenous contrast material on the development of post-CT AKI for patients with SCr less than 1.5 mg/dL, with or without the interaction in the model; this finding is appropriately powered, according to our post hoc power calculation. The failure of the overall model to show a significant effect of intravenous contrast material on the development of post-CT AKI is likely because of the large fraction of patients (18 375 of 20 242 patients) in the overall model with a SCr level less than 1.5 mg/dL—a patient population in which intravenous contrast material does not appear to represent a nephrotoxic risk factor for those with stable renal function.
Contrast material volume and iodine concentration were not associated with post-CT AKI.
Risk Factors of Unenhanced CT for Post-CT AKI
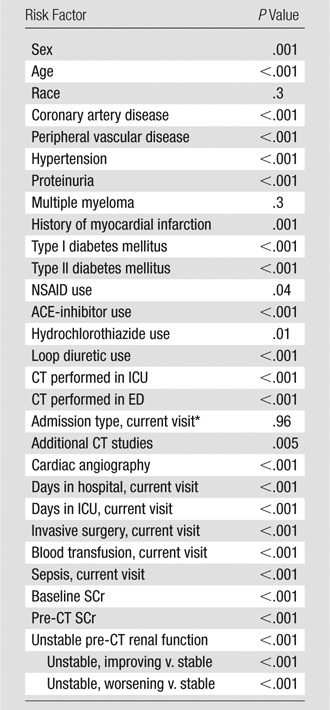
Table 5 lists the tested risk factors that were statistically significant predictors of post-CT AKI in the overall model. These risk factors contribute to the development of post-CT AKI irrespective of intravenous contrast material administration. Therefore, they are not risk factors for CIN specifically, but rather for post-CT AKI in general.
Table 5.
Risk Factors for the Development of Post-CT AKI

Note.—All of the following risk factors were significantly and independently associated with the development of post-CT AKI in the overall multivariate one-to-one propensity-matched analysis of effects model by using post-CT AKI (AKIN criteria) as the primary outcome measure, irrespective of iodinated contrast material administration. ICU = intensive care unit.
Discussion
For years, the CIN literature has been affected by an assumption that much of the AKI temporally related to the administration of iodinated contrast material must be attributable to the contrast material itself and not to other preexisting nephrotoxic risk factors (8). Newhouse et al (9) drew attention to this problem in 2008 by reporting that a substantial fraction of patients who did not receive intravenous contrast material had changes in SCr that would have met typical criteria for CIN had contrast material been administered. The results of Newhouse et al were corroborated by Bruce et al (10), who showed that the frequency of patients meeting criteria for CIN after unenhanced CT was similar to those who received contrast-enhanced CT in all but a single subset of patients (intravenous iohexol; SCr > 1.8 mg/dL [159.12 μmol/L]). Other recent studies that included a control group of unmatched patients who were not exposed to intravenous contrast material have found no difference between post-CT AKI rates of unenhanced and contrast-enhanced CT cohorts (21–26). The radiology community has been left with the impression that intravenous contrast material administration is either not associated with AKI or that it is much rarer than previously believed (11,12).
While the inclusion of control groups of patients who did not receive contrast material represents an important methodological advancement, we believe that there is a selection bias in retrospective studies that attempt to directly compare post-CT AKI rates between unique populations of patients. For example, two of the reasons that a patient might not be given intravenous contrast material are impaired renal function and the presence baseline nephrotoxic risk factors. Simple controls that use pre-CT SCr are important but inadequate if these other factors are not also simultaneously addressed. Hypothetically, the reason no difference is seen in post-CT AKI rates between the contrast-enhanced and unenhanced CT populations could be because the contrast-enhanced CT groups are populated by patients with AKI related to CIN, and the unenhanced CT groups are populated by patients with AKI of a different origin.
Our study attempted to address this problem by matching patients who had contrast-enhanced CT in a one-to-one fashion with patients who had unenhanced CT based on the propensity or likelihood that contrast material would be administered in light of tested risk factors, and by performing multivariate subgroup analyses that simultaneously controlled for a variety of risk factors that may contribute to the development of post-CT AKI and the initial assigned propensity score. By propensity-score adjustment, we are able to compare patients not merely based on SCr or the presence of other individual covariates, but by an assessment of whether other patients in similar situations would be administered intravenous contrast material.
Our principal finding was that intravenous iodinated contrast material was a significant risk factor for nephrotoxicity (ie, CIN) for patients with a pre-CT SCr level of 1.6 mg/dL (141.44 μmol/L) or greater (P = .007; odds ratio, 1.45 [1.11–1.89]). This relationship strengthened as pre-CT SCr increased (SCr ≥ 2.0 mg/dL [176.80 μmol/L]; P < .001; odds ratio, 2.15 [1.38–3.34]), even when all other tested risk factors, including but not limited to baseline SCr, pre-CT SCr, and the likelihood of being administered contrast material, are controlled. The pattern was similar for both tested post-CT AKI endpoints (AKIN criteria and traditional CIN criteria), and was further supported by the significant interaction of contrast material with pre-CT SCr (P = .006). Our conclusions differed from those in recently published reports (21–26), perhaps because of the different methodologic parameters used in this study.
Patients with a stable SCr level that was less than 1.5 mg/dL (132.60 μmol/L) did not have a significantly increased risk of post-CT AKI (P = .25). This finding was appropriately statistically powered (>95%) and suggests that studies evaluating measures to prevent CIN or discriminate it from other causes of post-CT AKI and studies comparing CIN rates between contrast media must take this into consideration if meaningful results are to be produced.
The volume of contrast material and concentration of iodine were not associated with post-CT AKI. Our model was not designed to control for differences that could have favored the use of one type of contrast material over another. This would have required initial propensity matching with respect to specific contrast agents. Additionally, 41.3% (4175 of 10 121) of contrast agent administrations were associated with an unknown agent. These factors precluded meaningful comparisons between the types of contrast materials that were used in this study.
Regardless of the pre-CT SCr value, there were numerous additional risk factors that were associated with the development of post-CT AKI (irrespective of contrast material administration). These additional risk factors indicated that although intravenous iodinated contrast material may contribute to the development of post-CT AKI in certain patient subgroups with impaired renal function, pre-CT SCr value was not the only explanation. Historic data suggest that CIN is widely prevalent (1), but these data likely overestimate the role of iodinated contrast material and do not adequately account for the wide array of other factors that may contribute to the development of post-CT AKI (8). It is likely that these other factors are responsible for a substantial fraction of post-CT AKI seen in the clinical setting after contrast-enhanced CT.
Patients who were identified to be at particular risk for post-CT AKI regardless of intravenous contrast material administration were those who received loop diuretics (odds ratio, 2.25; 95% CI: 2.00, 2.53) and those with volatile renal function (unstable renal function, improving; odds ratio, 1.83; 95% CI: 1.56, 2.16; unstable renal function, worsening; odds ratio 1.56; 95% CI: 1.30, 1.86). The increased risk in patients with improving renal function is particularly interesting and may have several explanations. For example, patients with renal function that is improving may have recently had a significant nephrotoxic exposure and could remain at risk for additive injury. Alternatively, in patients with elevated SCr levels that fluctuated (9,10), a recent improvement in SCr could simply indicate that the fluctuation reached its lowest value and should be expected to increase in the coming days.
Our study had several limitations. It is possible that some of the covariates we included in our multivariate propensity model were statistically significant but had weak effects that were only made evident by our large sample size. Other covariates dealt with factors that pertained to the same hospitalization period as the CT, and were not exclusive to a time period before CT. These factors may have reduced the efficiency of the propensity model. Additionally, it is likely that there are untested covariates that influenced whether we administered contrast material; this was inevitable. Although our overall model was performed with one-to-one propensity matching, we did not have sufficient data to permit one-to-one propensity matching within each SCr subgroup; however, we accounted for potential selection bias in these subgroups by further adjusting each subgroup multivariate model by the initial propensity score assigned to each patient.
Although there were not many patients in our study with a pre-CT SCr level of 2.0 mg/dL (176.80 μmol/L) or more, the trend in our data suggested that these patients were at the same or greater risk for CIN. Because we defined AKI on the basis of SCr, we are subjected to the limitations of using SCr as a marker of renal injury. Elevated SCr levels are much more likely to fluctuate than are low SCr levels, which may result in a spurious diagnosis of AKI (9,12), particularly when sensitive AKIN criteria are applied. However, we controlled for this variation in our matched propensity analysis. We did not assess CIN risk relative to pre-CT estimated glomerular filtration rates because SCr is the tool most commonly used to assess CIN risk in clinical practice (20). Future analyses with cohorts that are matched based on baseline and/or pre-CT estimated glomerular filtration rates are warranted. Lastly, we only measured short-term changes in SCr and not “hard” endpoints, such as mortality and renal replacement therapy. Future analyses directed at these endpoints are needed.
In conclusion, intravenous low-osmolality iodinated contrast material is an important independent risk factor for post-CT AKI, but not in patients with a stable SCr level less than 1.5 mg/dL (132.60 μmol/L). This association strengthens with increasing pre-CT SCr. However, there are many other factors that contribute to the development of post-CT AKI, and not all cases of post-CT AKI are due to CIN. These factors likely account for the equivalence in post-CT AKI rates after unenhanced and contrast-enhanced CT shown in recent reports (21–26). If these factors are not controlled, it is impossible to isolate the role of contrast material in the development of post-CT AKI.
Advances in Knowledge.
• Intravenously administered low-osmolality iodinated contrast material is an independent risk factor for post–computed tomography (CT) acute kidney injury (AKI) (serum creatinine [SCr] level ≥1.6 mg/dL (141.44 μmol/L); P = .007, odds ratio, 1.45; 95% confidence interval: 1.11, 1.89; risk increases with increases in pre-CT SCr).
• Intravenous low-osmolality iodinated contrast material is not a risk factor for post-CT AKI in patients with a stable pre-CT SCr level less than 1.5 mg/dL (132.60 μmol/L) (P = .25, power >95%).
Implication for Patient Care.
• Intravenous low-osmolality iodinated contrast material is a risk factor for post-CT AKI (contrast-induced nephrotoxicity), but it is not a risk factor in patients with SCr levels less than 1.5 mg/dL (132.60 μmol/L) (P = .25, power >95%). This information can be used to make decisions regarding administration of intravenous low-osmolality iodinated contrast material to at-risk patients.
Disclosures of Conflicts of Interest: M.S.D. Financial activities related to the present article: receives grant money paid by the Society of Uroradiology; institution receives grant money paid by the Society of Uroradiology. Financial activities not related to the present article: none to disclose. Other relationships: none to disclose. S.K. Financial activities related to the present article: grant money paid to institution by the Society of Uroradiology. Financial activities not related to the present article: none to disclose. Other relationships: none to disclose. J.R.D. Financial activities related to the present article: grant money paid to institution by Bracco Diagnostics, and some of the data presented was collected as part of Phase IV surveillance of MultiHance; minimal salary provided by Bracco for chart review; GE Healthcare provided investigator-initiated grant to compare iohexol vs iopamidol. Financial activities not related to the present article: grants pending from Bracco and Siemens Medical Solutions. Other relationships: none to disclose. R.H.C. Financial activities related to the present article: consultancy with GE Healthcare; provided expert testimony for GE Healthcare. Financial activities not related to the present article: royalties from Lippincott, Williams, and Wilkins. Other relationships: none to disclose. E.M.C. No relevant conflicts of interest to disclose. J.H.E. Financial activities related to the present article: none to disclose. Financial activities not related to the present article: consultancy for GE Healthcare for medical advisory board on iodinated contrast agents; provided expert testimony for GE Healthcare. Other relationships: none to disclose.
Acknowledgments
We thank James Myles, PhD, of the Michigan Institute for Clinical and Health Research, for his help with the initial study design.
Received June 23, 2012; revision requested August 10; revision received August 24; accepted September 12; final version accepted September 27.
Supported by a grant from the Society of Uroradiology.
Funding: This research was supported by the National Institutes of Health (grant UL1RR024986).
See also the articles by McDonald et al and the editorial by Newhouse and Choudhury in this issue.
Abbreviations:
- AKI
- acute kidney injury
- AKIN
- Acute Kidney Injury Network
- CI
- confidence interval
- CIN
- contrast material–induced nephrotoxicity
- SCr
- serum creatinine
References
- 1.Nash K, Hafeez A, Hou S. Hospital-acquired renal insufficiency. Am J Kidney Dis 2002;39(5):930–936 [DOI] [PubMed] [Google Scholar]
- 2.Briguori C, Tavano D, Colombo A. Contrast agent–associated nephrotoxicity. Prog Cardiovasc Dis 2003;45(6):493–503 [DOI] [PubMed] [Google Scholar]
- 3.Lakhal K, Ehrmann S, Chaari A, et al. Acute Kidney Injury Network definition of contrast-induced nephropathy in the critically ill: incidence and outcome. J Crit Care 2011;26(6):593–599 [DOI] [PubMed] [Google Scholar]
- 4.Gleeson TG, Bulugahapitiya S. Contrast-induced nephropathy. AJR Am J Roentgenol 2004;183(6):1673–1689 [DOI] [PubMed] [Google Scholar]
- 5.Tublin ME, Murphy ME, Tessler FN. Current concepts in contrast media-induced nephropathy. AJR Am J Roentgenol 1998;171(4):933–939 [DOI] [PubMed] [Google Scholar]
- 6.Murphy SW, Barrett BJ, Parfrey PS. Contrast nephropathy. J Am Soc Nephrol 2000;11(1):177–182 [DOI] [PubMed] [Google Scholar]
- 7.McCullough PA, Wolyn R, Rocher LL, Levin RN, O’Neill WW. Acute renal failure after coronary intervention: incidence, risk factors, and relationship to mortality. Am J Med 1997;103(5):368–375 [DOI] [PubMed] [Google Scholar]
- 8.Rao QA, Newhouse JH. Risk of nephropathy after intravenous administration of contrast material: a critical literature analysis. Radiology 2006;239(2):392–397 [DOI] [PubMed] [Google Scholar]
- 9.Newhouse JH, Kho D, Rao QA, Starren J. Frequency of serum creatinine changes in the absence of iodinated contrast material: implications for studies of contrast nephrotoxicity. AJR Am J Roentgenol 2008;191(2):376–382 [DOI] [PubMed] [Google Scholar]
- 10.Bruce RJ, Djamali A, Shinki K, Michel SJ, Fine JP, Pozniak MA. Background fluctuation of kidney function versus contrast-induced nephrotoxicity. AJR Am J Roentgenol 2009;192(3):711–718 [DOI] [PubMed] [Google Scholar]
- 11.Baumgarten DA, Ellis JH. Contrast-induced nephropathy: contrast material not required? AJR Am J Roentgenol 2008;191(2):383–386 [DOI] [PubMed] [Google Scholar]
- 12.Katzberg RW, Newhouse JH. Intravenous contrast medium-induced nephrotoxicity: is the medical risk really as great as we have come to believe? Radiology 2010;256(1):21–28 [DOI] [PubMed] [Google Scholar]
- 13.Parsons LS. Performing a 1:N case-control match on propensity score. SAS proceedings SUGI 29; 165–29
- 14.Mehta RL, Kellum JA, Shah SV, et al. Acute Kidney Injury Network: report of an initiative to improve outcomes in acute kidney injury. Crit Care 2007;11(2):R31. [DOI] [PMC free article] [PubMed] [Google Scholar]
- 15.Valette X, Parienti JJ, Plaud B, et al. Incidence, morbidity, and mortality of contrast-induced acute kidney injury in a surgical intensive care unit: a prospective cohort study. J Crit Care 2012;27(3):322.e1–e5 [DOI] [PubMed] [Google Scholar]
- 16.American College of Radiology Committee on Drugs and Contrast Media Manual on contrast media. 8th ed. Reston, Va: American College of Radiology, YEAR [Google Scholar]
- 17.Stacul F, van der Molen AJ, Reimer P, et al. Contrast induced nephropathy: updated ESUR Contrast Media Safety Committee guidelines. Eur Radiol 2011;21(12):2527–2541 [DOI] [PubMed] [Google Scholar]
- 18.Choyke PL, Cady J, DePollar SL, Austin H. Determination of serum creatinine prior to iodinated contrast media: is it necessary in all patients? Tech Urol 1998;4(2):65–69 [PubMed] [Google Scholar]
- 19.Tippins RB, Torres WE, Baumgartner BR, Baumgarten DA. Are screening serum creatinine levels necessary prior to outpatient CT examinations? Radiology 2000;216(2):481–484 [DOI] [PubMed] [Google Scholar]
- 20.Elicker BM, Cypel YS, Weinreb JC. IV contrast administration for CT: a survey of practices for the screening and prevention of contrast nephropathy. AJR Am J Roentgenol 2006;186(6):1651–1658 [DOI] [PubMed] [Google Scholar]
- 21.Tremblay LN, Tien H, Hamilton P, et al. Risk and benefit of intravenous contrast in trauma patients with an elevated serum creatinine. J Trauma 2005;59(5):1162–1166; discussion 1166–1167 [DOI] [PubMed] [Google Scholar]
- 22.Langner S, Stumpe S, Kirsch M, Petrik M, Hosten N. No increased risk for contrast-induced nephropathy after multiple CT perfusion studies of the brain with a nonionic, dimeric, iso-osmolal contrast medium. AJNR Am J Neuroradiol 2008;29(8):1525–1529 [DOI] [PMC free article] [PubMed] [Google Scholar]
- 23.Oleinik A, Romero JM, Schwab K, et al. CT angiography for intracerebral hemorrhage does not increase risk of acute nephropathy. Stroke 2009;40(7):2393–2397 [DOI] [PMC free article] [PubMed] [Google Scholar]
- 24.Bansal GJ, Darby M. Measurement of change in estimated glomerular filtration rate in patients with renal insufficiency after contrast-enhanced computed tomography: a case-control study. J Comput Assist Tomogr 2009;33(3):455–459 [DOI] [PubMed] [Google Scholar]
- 25.Lima FO, Lev MH, Levy RA, et al. Functional contrast-enhanced CT for evaluation of acute ischemic stroke does not increase the risk of contrast-induced nephropathy. AJNR Am J Neuroradiol 2010;31(5):817–821 [DOI] [PMC free article] [PubMed] [Google Scholar]
- 26.McGillicuddy EA, Schuster KM, Kaplan LJ, et al. Contrast-induced nephropathy in elderly trauma patients. J Trauma 2010;68(2):294–297 [DOI] [PubMed] [Google Scholar]