Hemodynamic imaging biomarkers (relative cerebral blood volume [rCBV] measures) did not show any significant correlation with the various molecular subclasses by using the two most commonly accepted subclassification schema of glioblastoma but did provide important prognostic information independent of the molecular subclasses, and patients with higher rCBV showed worse prognosis and poor survival.
Abstract
Purpose:
To correlate tumor blood volume, measured by using dynamic susceptibility contrast material–enhanced T2*-weighted magnetic resonance (MR) perfusion studies, with patient survival and determine its association with molecular subclasses of glioblastoma (GBM).
Materials and Methods:
This HIPAA-compliant retrospective study was approved by institutional review board. Fifty patients underwent dynamic susceptibility contrast-enhanced T2*-weighted MR perfusion studies and had gene expression data available from the Cancer Genome Atlas. Relative cerebral blood volume (rCBV) (maximum rCBV [rCBVmax] and mean rCBV [rCBVmean]) of the contrast-enhanced lesion as well as rCBV of the nonenhanced lesion (rCBVNEL) were measured. Patients were subclassified according to the Verhaak and Phillips classification schemas, which are based on similarity to defined genomic expression signature. We correlated rCBV measures with the molecular subclasses as well as with patient overall survival by using Cox regression analysis.
Results:
No statistically significant differences were noted for rCBVmax, rCBVmean of contrast-enhanced lesion or rCBVNEL between the four Verhaak classes or the three Phillips classes. However, increased rCBV measures are associated with poor overall survival in GBM. The rCBVmax (P = .0131) is the strongest predictor of overall survival regardless of potential confounders or molecular classification. Interestingly, including the Verhaak molecular GBM classification in the survival model clarifies the association of rCBVmean with patient overall survival (hazard ratio: 1.46, P = .0212) compared with rCBVmean alone (hazard ratio: 1.25, P = .1918). Phillips subclasses are not predictive of overall survival nor do they affect the predictive ability of rCBV measures on overall survival.
Conclusion:
The rCBVmax measurements could be used to predict patient overall survival independent of the molecular subclasses of GBM; however, Verhaak classifiers provided additional information, suggesting that molecular markers could be used in combination with hemodynamic imaging biomarkers in the future.
© RSNA, 2012
Introduction
Glioblastoma (GBM) is the most common primary malignant neoplasm in adults and is nearly uniformly fatal, with a median survival of 1 year (1). Recently, there has been progress in understanding the molecular basis of the tumor aggressiveness and heterogeneity. Various molecular subclassifications have been proposed on the basis of the genetic makeup of these tumors with the hope that a better understanding of origin of tumor cells and molecular pathogenesis may predict response to targeted therapies (2–4). Verhaak et al (4) subclassified GBM into four subtypes–classic, mesenchymal, proneural, and neural–based on similarity to defined genomic expression signature. Aberrations and gene expression of endothelial growth factor receptor, NF1, and PDGFRA/IDH1 defined the classic, mesenchymal, and proneural subtypes, respectively (4). The neural subtype was typified by the expression of neuron markers such as NEFL, GABRA1, SYT1, and SLC12A5 (4). Phillips et al (3) subclassified high-grade glioma into three subtypes–proneural, proliferative, and mesenchymal. However, whether this additional information provides any prognostic information is still an open question. Imaging biomarkers, and particularly tumor blood volume estimates (5–10), on the other hand have been shown to provide additional patient prognostic information even independent of the histologic grade in gliomas.
The Cancer Genome Atlas (TCGA) researchers have recently cataloged recurrent genomic abnormalities in GBM, providing a platform for better understanding of the molecular basis of these aggressive but heterogeneous tumors (11–13). In parallel, the Cancer Imaging Program is retrospectively obtaining radiologic imaging data for TCGA patients and making it available via the Cancer Imaging Archive (http://cancerimagingarchive.net) (14). Integration of this vast genomic information with imaging data (radiogenomics) may not only strengthen this understanding but also provide an opportunity to use some of the noninvasive imaging features or parameters as biomarkers. A limited number of publications on this topic have correlated presence or absence of contrast material enhancement with various gene expression pathways affecting tumor cell mitosis, migration, angiogenesis, hypoxia, edema, and apoptosis (15–19). All of these studies except two (18,19) focused on morphologic imaging features. Although Barajas et al (18) correlated histologic features with apparent diffusion coefficient and relative cerebral blood volume (rCBV) estimates, they did not directly correlate physiologic measures with gene expression. Jain et al (19) showed a promising correlation of perfusion parameters (tumor blood volume and permeability) with pro- and antiangiogenic gene expression in GBM. However, to our knowledge, no studies to date have compared any of the quantifiable hemodynamic or physiologic imaging biomarkers and molecular markers to patient prognosis.
The purpose of this study was to correlate tumor blood volume, measured by using dynamic susceptibility contrast material–enhanced T2*-weighted magnetic resonance (MR) perfusion studies, with patient survival and to determine its association with molecular subclasses of GBM.
Materials and Methods
Patient Characteristics
Our Health Insurance Portability and Accountability Act–compliant retrospective study was approved by the institutional review board (IRB no. 6381). Ninety-eight patients with treatment-naïve GBM who had imaging data uploaded on the Cancer Imaging Archive’s TCGA-GBM collection (https://wiki.cancerimagingarchive.net/display/Public/TCGA-GBM) (20) were reviewed. Fifty-seven patients (evaluated at two different institutions between 1998 and 2007) who had both dynamic susceptibility contrast-enhanced T2*-weighted MR perfusion studies and gene expression data available from TCGA (11,12) were included in the final analysis; 41 patients who did not have dynamic susceptibility contrast-enhanced T2*-weighted perfusion studies available were excluded. Seven patients were also excluded due to poor quality of imaging/perfusion data. Of the 35 patients at the first institution, 14 underwent MR perfusion with a 3.0-T imager; the 21 remaining patients, and all 15 patients at the second institution, were imaged with a 1.5-T MR imager. All 57 patients underwent surgical resection, and tumor specimens were collected as specified by TCGA bio-specimen methodology (11,12). According to those TCGA requirements, the pathologic diagnosis was confirmed as GBM by using adequate frozen tissue 0.5 g or greater, consisting of 70% or more tumor nuclei and less than 50% necrosis. Of the 35 patients at institution 1, eight underwent gross total resection and 27 underwent subtotal resection. Information on the extent of resection was not available from institution 2.
For comparison, survival information and molecular classification were collected for the larger cohort of GBM samples submitted to TCGA (n = 382). Our present study sample (n = 50) is the subset of this larger cohort, which has available both MR perfusion imaging and genomic expression data.
MR Perfusion: Image Acquisition
At institution 1 studies were obtained with either 1.5-T (n = 21) or 3-T (n = 14) MR imagers (Signa Excite; GE Healthcare, Milwaukee, Wis). Perfusion imaging was performed during the injection of gadopentetate dimeglumine (Magnevist, 0.1 mmol/kg; Bayer Healthcare, Berlin, Germany). The contrast agent was infused by means of a power injector at a constant rate of 5 mL∕sec. A series of 95 phases of T2*-weighted gradient-echo echo-planar images were acquired (repetition time msec/echo time msec, 1900/40; flip angle, 90°). The acquisition matrix was 128 × 128 with a 26-cm field of view and 5-mm section thickness. The temporal resolution was 2.0 seconds. The number of sections varied depending on tumor size, with an effort to include the entire tumor in the acquisition. Routine unenhanced MR images were obtained before obtaining a perfusion study, and T1-weighted contrast-enhanced images were acquired after the perfusion study.
In cases from institution 2, the studies were obtained by using a 1.5-T imager (Genesis Signa; GE Healthcare). Perfusion imaging was performed during injection of gadopentetate dimeglumine. The 0.1 mmol/kg gadolinium-based contrast agent was infused at a constant rate of 5 mL∕sec by means of power injector. A series of 60 phases of T2*-weighted gradient-echo echo-planar images were acquired (2000/54; flip angle, 30°) with a temporal resolution of 2.0 seconds. The acquisition matrix was 128 × 128 with a 26-cm field of view. The nominal section thickness was 3–6 mm, depending on the size and position of the tumor.
MR Perfusion: Image Postprocessing
Studies from both institutions were processed by using NordicICE software (Nordic Imaging Lab, Bergen, Norway) using the U.S. Food and Drug Administration–approved DSCT2* perfusion module. The module corrects for contrast agent leakage from the intravascular to extracellular space by using the method published by Boxerman et al (21). rCBV maps with leakage correction were produced by the software, which normalizes the cerebral blood volume relative to a globally determined mean value. The postprocessed images were subsequently uploaded to the Cancer Imaging Archive and can be retrieved from the TCGA-GBM image collection (https://wiki.cancerimagingarchive.net/display/Public/TCGA-GBM) (20).
MR Perfusion Parametric Map Analysis
All the regions of interest were drawn by two authors in consensus (R.J., a board-certified neuroradiologist with more than 9 years of experience with perfusion imaging, and J.N., a trained radiologist and research fellow) who were blinded to the genomic data on the rCBV maps fused with postcontrast T1-weighted images and fluid-attenuated inversion recovery images. The mean rCBV (rCBVmean), maximum rCBV (rCBVmax), and rCBV of nonenhanced lesion (rCBVNEL) were measured from the rCBV maps. For measuring rCBVmean, regions of interest were drawn on the contrast-enhanced portion of the tumor (excluding any areas of necrosis and vessels) on all the sections that contained the tumor defined as contrast-enhanced lesion, and a mean of these was obtained. For measuring rCBVmax, a region of interest of 10 × 10 voxels was placed on the hottest-appearing part of the tumor on the basis of the qualitative perfusion maps. A region of interest of 10 × 10 voxels was placed on three spots on the nonenhanced fluid-attenuated inversion recovery study abnormality within 1 cm of the edge of the contrast-enhanced lesion, defined as nonenhanced lesion, to measure rCBVNEL and obtain a mean (Fig 1).
Figure 1a:
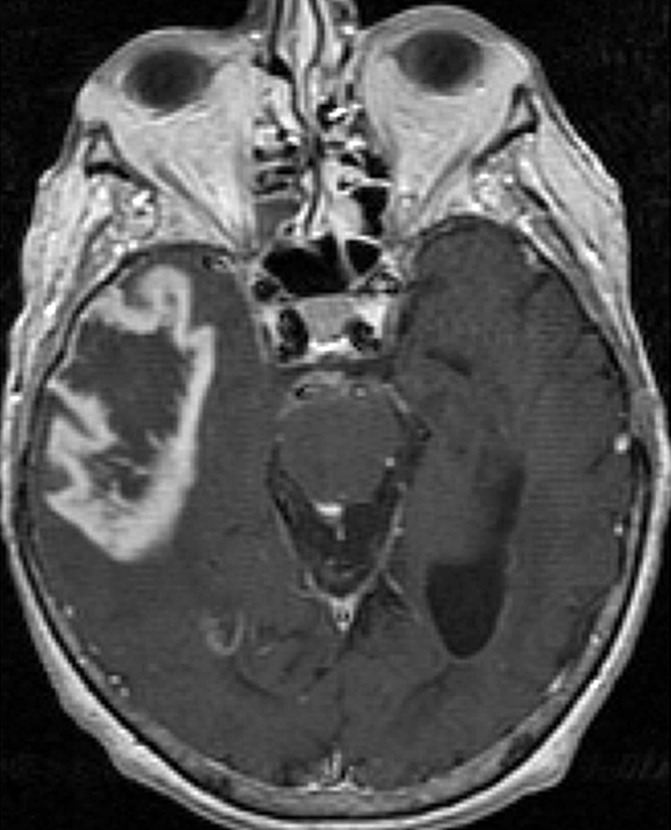
Axial (a) contrast-enhanced T1-weighted and (b) fluid-attenuated inversion recovery images in a patient with right temporal GBM. Cerebral blood volume parametric maps at the same axial level show (c) manually drawn region of interest including contrast-enhanced tumor avoiding any cystic necrotic part to measure rCBVmean and (d) region of interest (arrow) drawn to measure rCBVmax from the “hottest” part of the tumor and three other regions of interest (arrowheads) drawn to measure CBVNEL.
Figure 1b:
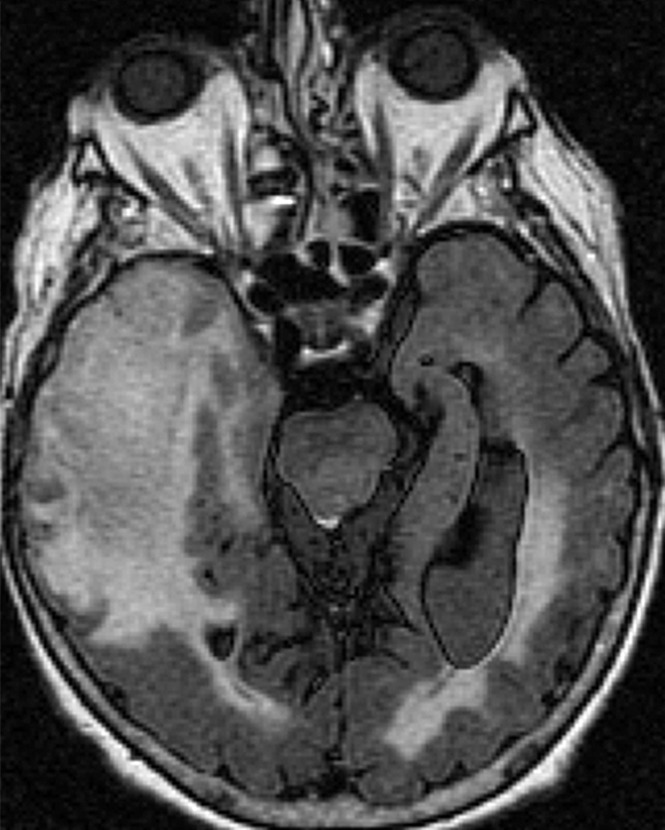
Axial (a) contrast-enhanced T1-weighted and (b) fluid-attenuated inversion recovery images in a patient with right temporal GBM. Cerebral blood volume parametric maps at the same axial level show (c) manually drawn region of interest including contrast-enhanced tumor avoiding any cystic necrotic part to measure rCBVmean and (d) region of interest (arrow) drawn to measure rCBVmax from the “hottest” part of the tumor and three other regions of interest (arrowheads) drawn to measure CBVNEL.
Figure 1c:
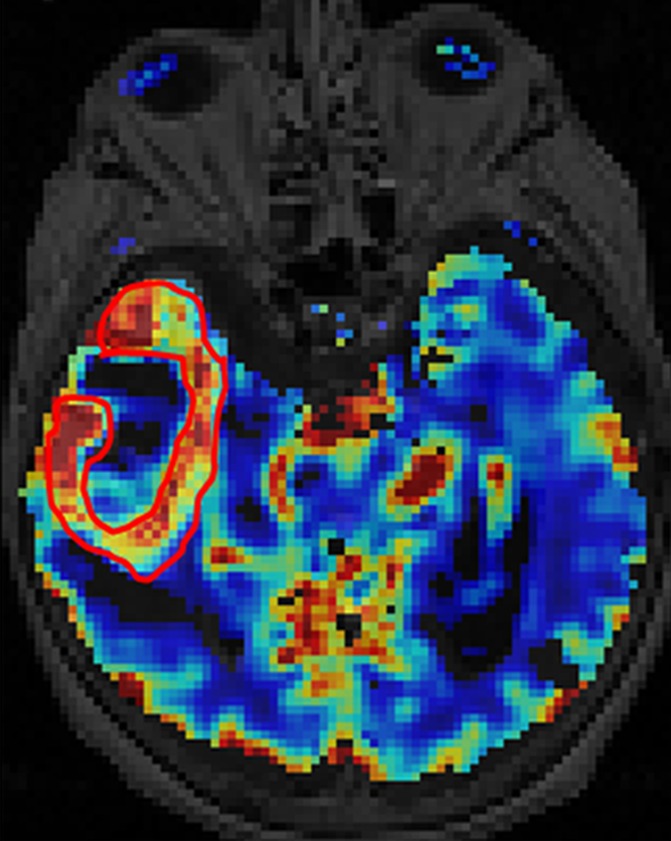
Axial (a) contrast-enhanced T1-weighted and (b) fluid-attenuated inversion recovery images in a patient with right temporal GBM. Cerebral blood volume parametric maps at the same axial level show (c) manually drawn region of interest including contrast-enhanced tumor avoiding any cystic necrotic part to measure rCBVmean and (d) region of interest (arrow) drawn to measure rCBVmax from the “hottest” part of the tumor and three other regions of interest (arrowheads) drawn to measure CBVNEL.
Figure 1d:

Axial (a) contrast-enhanced T1-weighted and (b) fluid-attenuated inversion recovery images in a patient with right temporal GBM. Cerebral blood volume parametric maps at the same axial level show (c) manually drawn region of interest including contrast-enhanced tumor avoiding any cystic necrotic part to measure rCBVmean and (d) region of interest (arrow) drawn to measure rCBVmax from the “hottest” part of the tumor and three other regions of interest (arrowheads) drawn to measure CBVNEL.
Statistical Analysis
For all tests, statistical significance was determined at P < .05. Comparison of average rCBV measures between groups was performed by using two-sample t tests or one-way analysis of variance. Kaplan-Meier estimation was used to calculate median survival and for some univariate testing. For the Kaplan-Meier curves, the log-rank statistic assesses group differences equally across the full observation time, whereas the Wilcoxon statistic weights the early events more heavily, thus identifying early separation in the curves; results from both tests are considered. Survival analysis with Cox proportional hazards models was used primarily to estimate hazard ratios (HRs) and for testing multivariable models. Patient age at diagnosis (years, continuous), Karnofsky performance score (KPS, continuous), and level of resection (gross-total, subtotal) are standard predictors of survival for GBM and were considered as potential covariates in the multivariable models along with the MR imager type (1.5 T or 3 T) and molecular classification. Verhaak and Phillips molecular classification schema were used, as determined in a recent publication by Huse et al (22). A stepwise model-fitting strategy was used beginning with the rCBV measure, adding age and MR imager followed by molecular class (either Verhaak or Phillips). Age and MR imager were not significant predictors of survival and did not show evidence of being confounders in the models so they were excluded from the presented models for the sake of parsimony given the sample size. KPS and extent of resection were only available for samples from institution 1. Exploratory analysis of models including these predictors of survival was conducted on the patients from institution 1.
Results
rCBV Analysis Using Molecular Subclassification
No statistically significant differences were noted for average rCBVmax, rCBVmean of contrast-enhanced lesion, or for rCBVNEL between the four Verhaak subclasses or the three Phillips subclasses (Table 1).
Table 1.
rCBV Analysis with Molecular Subclasses Defined by Verhaak and Phillips
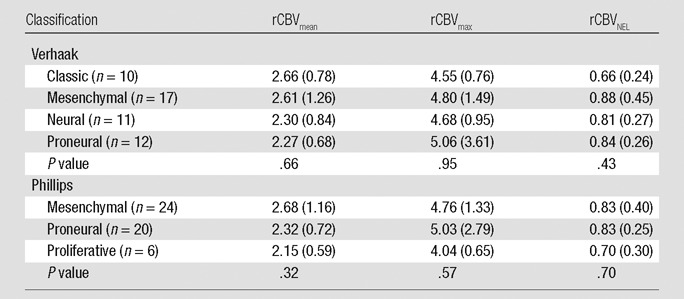
Note.—The mean rCBV measure per subclass is listed, with the global F test P value listed for the one-way analysis of variance across subclasses. Numbers in parentheses are standard deviation.
Survival Analysis Using Molecular Subclassification
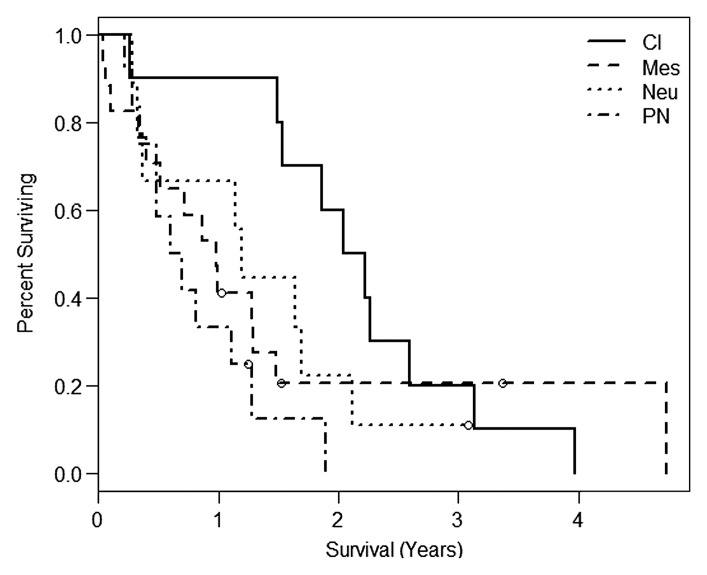
In the present study, the median overall survival was 1.14 years (interquartile range, or IQR: 0.49, 2.11). When the Verhaak classification scheme was applied to these samples, the classic subclass had the best survival, with a median of 2.13 years (IQR: 1.53, 2.59), and the proneural subclass had the worst survival, with median 0.41 years (IQR: 0.65, 1.19) (Fig 2a). The difference in survival by means of Verhaak subclassification was significant between groups, with the difference being more prominent earlier during follow-up (Wilcoxon, P = .0445; log-rank, P = .0696).
Figure 2a:
Kaplan-Meier survival curves for the (a) Verhaak (Wilcoxon, P = .0445; log-rank, P = .0696) and (b) Phillips (log-rank, P = .6432; Wilcoxon, P = .4548) subclassification for the present study. Cl = classic, Mes = mesenchymal, Neu = neural, PN = proneural, Prolif = proliferative.
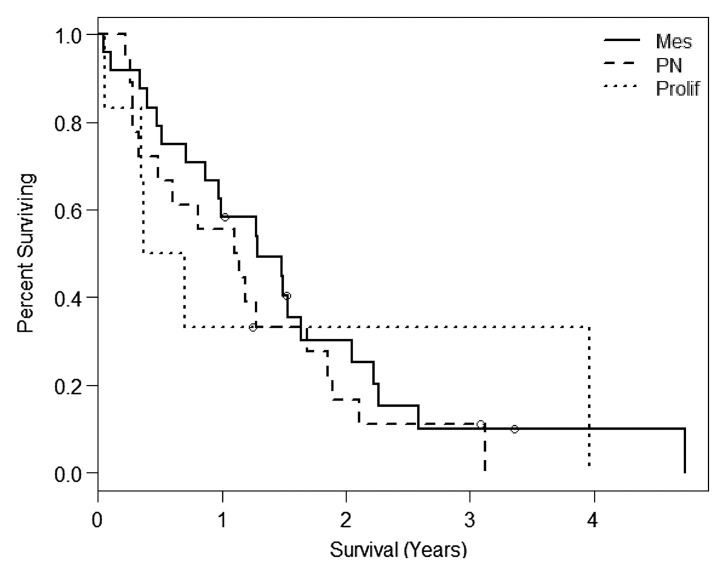
There was no evidence that the Phillips classification was associated with survival in our sample (log-rank, P = .6432; Wilcoxon, P = .4548). Median survival times for the three classes are mesenchymal with 1.28 years (IQR: 0.61, 2.22), proneural with 1.12 years (IQR: 0.33, 1.86), and proliferative with 0.54 year (IQR: 0.34, 3.96). Note that the proliferative class was only represented by six patients (five deaths), one of whom was still surviving at 3.96 years (Fig 2b).
Figure 2b:
Kaplan-Meier survival curves for the (a) Verhaak (Wilcoxon, P = .0445; log-rank, P = .0696) and (b) Phillips (log-rank, P = .6432; Wilcoxon, P = .4548) subclassification for the present study. Cl = classic, Mes = mesenchymal, Neu = neural, PN = proneural, Prolif = proliferative.
Survival Analysis Using Only rCBV Measures
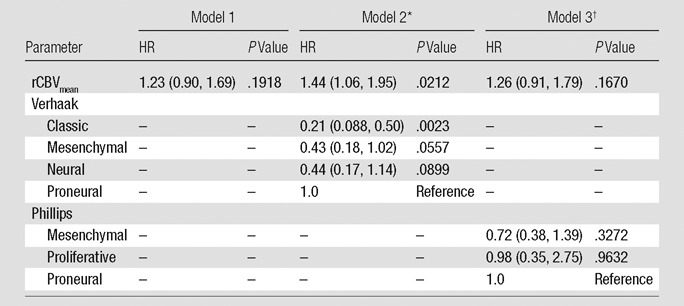
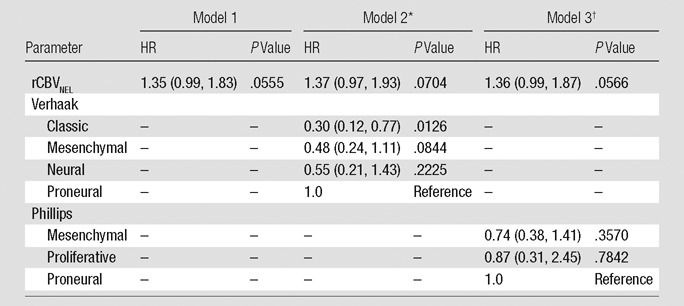
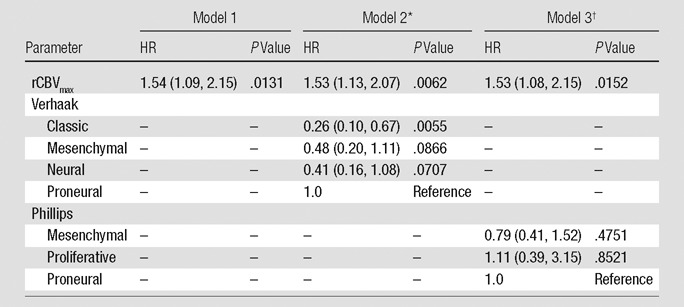
When we looked at rCBV as the sole predictor of survival, we observed that each measure infers greater risk of death as it increases. The HRs are 1.23 (P = .1918) for rCBVmean, 1.54 (P = .0131) for rCBVmax, and 1.35 (P = .0555) for rCBVNEL (Tables 2–4, model 1). Adjusting for patient age at diagnosis and MR imager type used showed no effect on the prediction of survival and were dropped from subsequent models for the sake of parsimony.
Table 2.
Estimated HRs for rCBVmean Alone or Adjusted for a Molecular Signature
Note.—rCBV is scaled so that the unit is 1 standard deviation. Numbers in parentheses are 95% confidence intervals.
The global P value for the Verhaak classification is .0250.
The global P value for the Phillips classification is .5892.
Table 4.
Estimated HRs for rCBVNEL Alone or Adjusted for a Molecular Signature
Note.—rCBV is scaled so that the unit is 1 standard deviation. Numbers in parentheses are 95% confidence intervals.
The global P value for the Verhaak classification is .0917.
The global P value for the Phillips classification is .6533.
Table 3.
Estimated HRs for rCBVmax Alone or Adjusted for a Molecular Signature
Note.—rCBV is scaled so that the unit is 1 standard deviation. Numbers in parentheses are 95% confidence intervals.
The global P value for the Verhaak classification is .0476.
The global P value for the Phillips classification is .6888.
Survival Analysis Using rCBV and Molecular Subclassification
When the Verhaak classification was considered in conjunction with rCBV measures, we observed that rCBVmean becomes a significant predictor of survival (HR: 1.44; P = .0212), rCBVmax remains significant (HR: 1.53; P = .0062), and rCBVNEL retains a trend toward increased risk of death (HR: 1.37; P = .0704). Verhaak classification is a significant predictor of survival in the models with rCBVmean (P = .0250) or rCBVmax (P = .0476) (Tables 2–4, model 2). The Phillips classification had no effect on the survival model with respect to the estimated HRs of the rCBV measures (rCBVmean HR: 1.26, P = .1670; rCBVmax HR: 1.53, P = .0152; rCBVNEL HR: 1.36, P = .0566). Likewise, it does not provide any independent prediction of survival (2 degrees of freedom x2, P = .5892, P = .6888, and P = .6533, respectively) (Tables 2–4, model 3).
Survival Analysis Using rCBV, Molecular Subclassification, KPS, and Extent of Resection
For the patient group (n = 35) at institution 1 we were able to include two standard predictors of survival–extent of tumor resection (gross total resection vs subtotal resection) and KPS. As expected, patients who underwent gross total resection had better overall survival (median, 4.74 years) than those with subtotal resection (median, 0.98 year; log-rank, P = .0075). However, subtotal resection was associated with higher rCBVmean (2.59 ± 1.14 [standard deviation] vs 1.96 ± 0.38; t test, P = .0192) and we saw a trend toward higher rCBVmax (4.66 ± 1.32 vs 3.97 ± 0.83; t test, P = .0904), suggesting that rCBV association with survival could be confounded by extent of resection in this particular group. Each 10-point increase in KPS showed a decreasing trend in the risk of death by a factor of 0.53 (HR = 0.652; P = .052; n = 29).
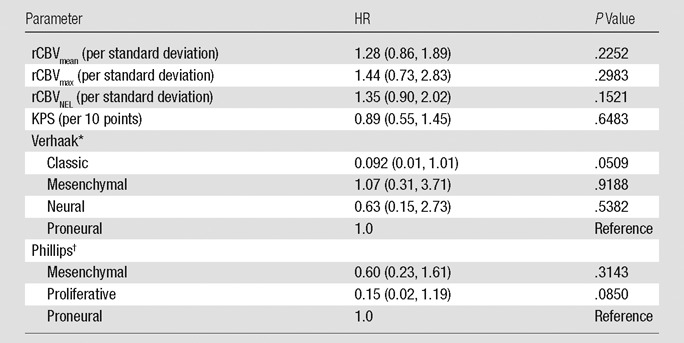
Focusing only on those patients who underwent subtotal resection and had a KPS measure (n = 22; 20 deaths), we found that none of the predictors alone are significantly associated with survival (rCBVmean, rCBVmax, rCBVNEL, Verhaak class, Phillips class, and KPS); see Table 5. However, the estimated HRs for each rCBV measure were similar to those of the full population (including gross total resection and patients from institution 2) with rCBVmean HR of 1.28, rCBVmax HR of 1.44, and rCBVNEL HR of 1.35, suggesting that the loss of significance is due to the low power of the small sample size. Including KPS status and Verhaak classification jointly in a survival model demonstrated the significant effect of KPS (P = .0482) and near-significant association with Verhaak class (P = .0701). This interaction effect was maintained with or without an rCBV measure included in the model.
Table 5.
HR Estimates from Single-Predictor Cox Regression Models of Survival (22 Patients with Subtotal Resection)
Note.—Numbers in parentheses are 95% confidence intervals.
The global P value for the Verhaak classification is .2150.
The global P value for the Phillips classification is .2014.
Discussion
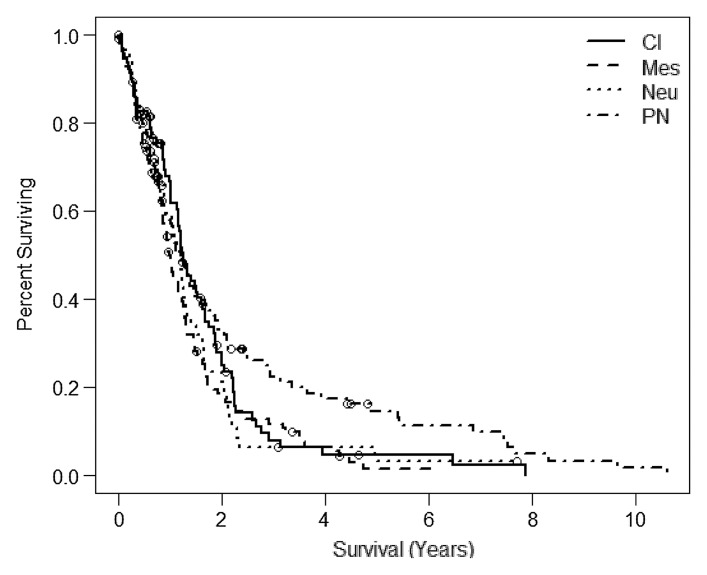
Molecular subclassification of GBM has partly laid the groundwork for a deeper understanding of the molecular basis that probably is responsible for the heterogeneity of aggressiveness and prognosis seen in this subgroup. Though often perceived as beneficial, the proneural subclass had the worst survival rate in our study. However, the proneural subclass also had the worst median survival rate in the publication by Verhaak et al (4). In the expanded TCGA sample set, the classic subclass had the best median survival followed closely by the proneural subclass (Fig 3a) (22). In our study, the advantage of the proneural subclass arises only for those who survive beyond 1.5 years, suggesting a possible interaction effect with the treatment of progressive disease. In our sample set, only one patient with proneural classification survived beyond 1.5 years. It would be interesting to look at time to progression rather than overall survival time. We do not currently have reliable data on time to progression for all patients in the present study.
Figure 3a:
Kaplan-Meier survival curves for the (a) Verhaak and (b) the Phillips subclassification from the expanded TCGA study (20) (n = 382). The samples described in this study are subsets of the larger TCGA population for which MR perfusion images are available. Cl = classic, Mes = mesenchymal, Neu = neural, PN = proneural, Prolif = proliferative.
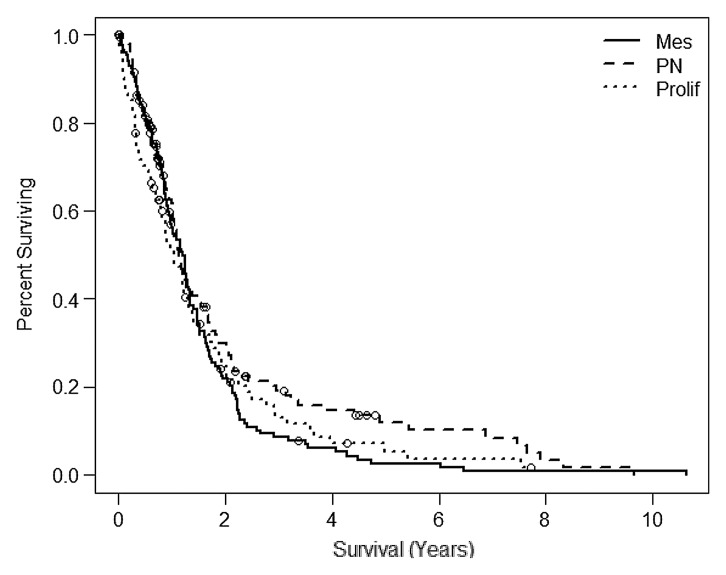
Phillips et al (3) showed that tumor subtype had significant prognostic value that was independent of the World Health Organization tumor grade and/or the presence of necrosis. However, nearly all (89%) of their grade III gliomas were classified as proneural. This finding follows closely to what is seen in the broader TCGA population for the Phillips classification (n = 382; log-rank, P = .1748; Wilcoxon, P = .2152) (22). The median survival times were 1.21 years for mesenchymal, 1.14 years for proneural, and 1.05 years for proliferative subclass (Fig 3b). Again the proneural subclass did not show the best survival; however, we see from the Phillips et al publication (3) that the long-term survival of the proneural subclass is bolstered by the inclusion of grade III tumors in the analysis, where as in the present analysis we included only GBM.
Figure 3b:
Kaplan-Meier survival curves for the (a) Verhaak and (b) the Phillips subclassification from the expanded TCGA study (20) (n = 382). The samples described in this study are subsets of the larger TCGA population for which MR perfusion images are available. Cl = classic, Mes = mesenchymal, Neu = neural, PN = proneural, Prolif = proliferative.
Even though these molecular studies provide important information about the possibility of different cells of origin for GBM and raise the question about specific therapies targeted to different pathways for the future, they fail to demonstrate any clear difference in survival in these subtypes. Various functional/physiologic imaging biomarkers have been used in the past to grade gliomas, predict survival, and assess treatment response, as well as correlate with immunohistologic or molecular markers. Perfusion parameters and particularly tumor blood volume estimates have been used in the past as prognostic markers for time to progression or survival (5–10); however, most of the studies either focused on or included low-grade gliomas in their analysis (5,6,8,23,24). Law et al (8) showed that gliomas with rCBV of greater than 1.75 had more rapid time to progression than those with low rCBV independent of pathologic findings; however, these authors did not perform a similar analysis for the high-grade glioma group wherein grade III and IV gliomas were separated. Hirai et al (25) is the only study, to our knowledge, about prognostic value of rCBV in high-grade gliomas and showed that high-grade gliomas with higher rCBV (>2.3) had significantly lower 2-year overall survival compared with those with lower rCBV. In our study, we did not find any significant difference in various rCBV measures among the various GBM subclasses whether using the Verhaak or Phillips classification scheme. But our results do show that rCBVmax measurements in this group of highly aggressive tumors showed statistically significant correlation with overall survival independent of the molecular subclassification systems. Phillips classifiers did not affect the association of rCBV measures with patient survival. Verhaak classifiers also did not have any effect on the rCBVmax and rCBVNEL measurements but did significantly affect the association of rCBVmean measurements with patient overall survival (improved HR from 1.23 to 1.44, Table 2). This suggests that Verhaak subclassification provides additional information. and hence molecular markers could potentially be used as an adjunct to hemodynamic imaging biomarkers in the future, particularly with increasing emphasis on individualized pathway specific targeted therapy regimens.
There were some limitations to our study. Subset analysis reduces the effective sample size and large models are not supported. Future studies with larger sample size must be conducted to validate these model results. Lack of clinical data (extent of surgical resection and KPS) regarding 15 patients from institution 2 limits our ability to generalize the results. The survival models do not account for postsurgical treatments received.
In summary, molecular subclassification schema of GBM provide insight into tumor cell origin and molecular basis for tumor aggressiveness and heterogeneity that could lead to specific, pathway targeted therapy; however, molecular information alone has not provided sufficient data for patient prognosis and part of the reason could be that current treatment practices do not yet triage patients for specific pathways. Hemodynamic imaging biomarkers (rCBV measures) did not show any significant correlation with the various molecular subclasses using the two most commonly accepted subclassification schema of GBM but did provide important prognostic information independent of the molecular subclasses and patients with higher rCBV showed worse prognosis and poor survival. However, Verhaak subclassification schema remained significant in the survival models providing additional survival information about rCBVmean measurements. Although this needs to be confirmed with a larger sample size, it highlights the importance of in vivo hemodynamic imaging biomarkers and their potential role as adjuncts to molecular/genomic markers, particularly in predicting patient survival and prognosis.
Advances in Knowledge.
• No statistically significant difference was noted for relative cerebral blood volume (rCBV) measurements between molecular subclasses of glioblastoma (GBM) employing the two commonly used schemas (Verhaak and Phillips).
• Tumor rCBV measures enhance patient survival models based on molecular subclassification systems of GBM.
Implication for Patient Care.
• Molecular mapping of GBM can provide important therapy targets by providing insight into the molecular basis for tumor cell origin; however, in vivo imaging biomarkers (such as rCBV measures) can provide important prognostic information that may be used as an adjunct to genomic markers in the future.
Disclosures of Conflicts of Interest: R.J. No relevant conflicts of interest to disclose. L.P. No relevant conflicts of interest to disclose. J.N. No relevant conflicts of interest to disclose. D.G. No relevant conflicts of interest to disclose. L.S. No relevant conflicts of interest to disclose. S.N.H. No relevant conflicts of interest to disclose. C.H. No relevant conflicts of interest to disclose. M.W. Financial activities related to the present article: none to disclose. Financial activities not related to the present article: grants/grants pending to institution from GE Healthcare, Philips Healthcare, NIH. Other relationships: none to disclose. R.R.C. No relevant conflicts of interest to disclose. J.K. No relevant conflicts of interest to disclose. J.F. No relevant conflicts of interest to disclose. D.J.B. No relevant conflicts of interest to disclose. C.J. No relevant conflicts of interest to disclose. T.M. Financial activities related to the present article: none to disclose. Financial activities not related to the present article: consultancy for Merck Schering and Roche Genentech; payment for lectures including service on speakers’ bureaus for Merck Schering and Roche Genentech; payment for development of educational presentations from Merck Schering. Other relationships: none to disclose.
Acknowledgments
We thank Adam Flanders, MD, for his help and guidance with data collection and manuscript preparation and Susan MacPhee-Gray, BA, MA, for her assistance with manuscript editing and formatting.
Received April 15, 2012; revision requested June 19; revision received July 18; accepted August 2; final version accepted September 7.
Funding: This research was supported by the National Institutes of Health (grant HHSN261200800001E).
Abbreviations:
- GBM
- glioblastoma
- HR
- hazard ratio
- IQR
- interquartile range
- KPS
- Karnofsky performance score
- rCBV
- relative cerebral blood volume
- rCBVmax
- maximum rCBV
- rCBVmean
- mean rCBV
- rCBVNEL
- rCBV of nonenhanced lesion
- TCGA
- the Cancer Genome Atlas
References
- 1.Ohgaki H, Kleihues P. Population-based studies on incidence, survival rates, and genetic alterations in astrocytic and oligodendroglial gliomas. J Neuropathol Exp Neurol 2005;64(6):479–489 [DOI] [PubMed] [Google Scholar]
- 2.Liang Y, Diehn M, Watson N, et al. Gene expression profiling reveals molecularly and clinically distinct subtypes of glioblastoma multiforme. Proc Natl Acad Sci U S A 2005;102(16):5814–5819 [DOI] [PMC free article] [PubMed] [Google Scholar]
- 3.Phillips HS, Kharbanda S, Chen R, et al. Molecular subclasses of high-grade glioma predict prognosis, delineate a pattern of disease progression, and resemble stages in neurogenesis. Cancer Cell 2006;9(3):157–173 [DOI] [PubMed] [Google Scholar]
- 4.Verhaak RG, Hoadley KA, Purdom E, et al. Integrated genomic analysis identifies clinically relevant subtypes of glioblastoma characterized by abnormalities in PDGFRA, IDH1, EGFR, and NF1. Cancer Cell 2010;17(1):98–110 [DOI] [PMC free article] [PubMed] [Google Scholar]
- 5.Aronen HJ, Gazit IE, Louis DN, et al. Cerebral blood volume maps of gliomas: comparison with tumor grade and histologic findings. Radiology 1994;191(1):41–51 [DOI] [PubMed] [Google Scholar]
- 6.Lev MH, Ozsunar Y, Henson JW, et al. Glial tumor grading and outcome prediction using dynamic spin-echo MR susceptibility mapping compared with conventional contrast-enhanced MR: confounding effect of elevated rCBV of oligodendrogliomas [corrected]. AJNR Am J Neuroradiol 2004;25(2):214–221 [PMC free article] [PubMed] [Google Scholar]
- 7.Law M, Oh S, Babb JS, et al. Low-grade gliomas: dynamic susceptibility-weighted contrast-enhanced perfusion MR imaging—prediction of patient clinical response. Radiology 2006;238(2):658–667 [DOI] [PubMed] [Google Scholar]
- 8.Law M, Young RJ, Babb JS, et al. Gliomas: predicting time to progression or survival with cerebral blood volume measurements at dynamic susceptibility-weighted contrast-enhanced perfusion MR imaging. Radiology 2008;247(2):490–498 [DOI] [PMC free article] [PubMed] [Google Scholar]
- 9.Bisdas S, Kirkpatrick M, Giglio P, Welsh C, Spampinato MV, Rumboldt Z. Cerebral blood volume measurements by perfusion-weighted MR imaging in gliomas: ready for prime time in predicting short-term outcome and recurrent disease? AJNR Am J Neuroradiol 2009;30(4):681–688 [DOI] [PMC free article] [PubMed] [Google Scholar]
- 10.Mills SJ, Patankar TA, Haroon HA, Balériaux D, Swindell R, Jackson A. Do cerebral blood volume and contrast transfer coefficient predict prognosis in human glioma? AJNR Am J Neuroradiol 2006;27(4):853–858 [PMC free article] [PubMed] [Google Scholar]
- 11.Cancer Genome Atlas Research Network Comprehensive genomic characterization defines human glioblastoma genes and core pathways. Nature 2008;455(7216):1061–1068 [DOI] [PMC free article] [PubMed] [Google Scholar]
- 12.Preprocessed level 2 data, obtained from the TCGA Data Portal http://tcga-data.nci.nih.gov/tcga/. Accessed August 19, 2010.
- 13.Cooper LA, Kong J, Gutman DA, et al. An integrative approach for in silico glioma research. IEEE Trans Biomed Eng 2010;57(10):2617–2621 [DOI] [PMC free article] [PubMed] [Google Scholar]
- 14.Cancer Imaging Program, via The Cancer Imaging Archive (TCIA) http://cancerimagingarchive.net. Accessed March 3, 2011.
- 15.Diehn M, Nardini C, Wang DS, et al. Identification of noninvasive imaging surrogates for brain tumor gene-expression modules. Proc Natl Acad Sci U S A 2008;105(13):5213–5218 [DOI] [PMC free article] [PubMed] [Google Scholar]
- 16.Van Meter T, Dumur C, Hafez N, Garrett C, Fillmore H, Broaddus WC. Microarray analysis of MRI-defined tissue samples in glioblastoma reveals differences in regional expression of therapeutic targets. Diagn Mol Pathol 2006;15(4):195–205 [DOI] [PubMed] [Google Scholar]
- 17.Pope WB, Chen JH, Dong J, et al. Relationship between gene expression and enhancement in glioblastoma multiforme: exploratory DNA microarray analysis. Radiology 2008;249(1):268–277 [DOI] [PMC free article] [PubMed] [Google Scholar]
- 18.Barajas RF, Jr, Hodgson JG, Chang JS, et al. Glioblastoma multiforme regional genetic and cellular expression patterns: influence on anatomic and physiologic MR imaging. Radiology 2010;254(2):564–576 [DOI] [PMC free article] [PubMed] [Google Scholar]
- 19.Jain R, Poisson L, Narang J, et al. Correlation of perfusion parameters with genes related to angiogenesis regulation in glioblastoma: a feasibility study. AJNR Am J Neuroradiol 2012;33(7):1343–1348 [DOI] [PMC free article] [PubMed] [Google Scholar]
- 20.TCGA-GBM collection from The Cancer Imaging Archive (TCIA) https://wiki.cancerimagingarchive.net/display/Public/TCGA-GBM. Accessed March 3, 2011.
- 21.Boxerman JL, Schmainda KM, Weisskoff RM. Relative cerebral blood volume maps corrected for contrast agent extravasation significantly correlate with glioma tumor grade, whereas uncorrected maps do not. AJNR Am J Neuroradiol 2006;27(4):859–867 [PMC free article] [PubMed] [Google Scholar]
- 22.Huse JT, Phillips HS, Brennan CW. Molecular subclassification of diffuse gliomas: seeing order in the chaos. Glia 2011;59(8):1190–1199 [DOI] [PubMed] [Google Scholar]
- 23.Stupp R, Mason WP, van den Bent MJ, et al. Radiotherapy plus concomitant and adjuvant temozolomide for glioblastoma. N Engl J Med 2005;352(10):987–996 [DOI] [PubMed] [Google Scholar]
- 24.Krex D, Klink B, Hartmann C, et al. German Glioma Network Long-term survival with glioblastoma multiforme. Brain 2007;130(Pt 10):2596–2606 [DOI] [PubMed] [Google Scholar]
- 25.Hirai T, Murakami R, Nakamura H, et al. Prognostic value of perfusion MR imaging of high-grade astrocytomas: long-term follow-up study. AJNR Am J Neuroradiol 2008;29(8):1505–1510 [DOI] [PMC free article] [PubMed] [Google Scholar]


