The crystallization of three recombinant mutants of Vaccinia virus uracil DNA glycosylase is reported.
Keywords: Vaccinia virus, uracil DNA glycosylase
Abstract
Amino-acid residues located at a highly flexible area in the uracil DNA glycosylase of Vaccinia virus were mutated. In the crystal structure of wild-type D4 these residues lie at the dimer interface. Specifically, three mutants were generated: (i) residue Arg167 was replaced with an alanine (R167AD4), (ii) residues Glu171, Ser172 and Pro173 were substituted with three glycine residues (3GD4) and (iii) residues Glu171 and Ser172 were deleted (Δ171-172D4). Mutant proteins were expressed, purified and crystallized in order to investigate the effects of these mutations on the structure of the protein.
1. Introduction
Uracil DNA glycosylases (UDGs) represent a large superfamily of enzymes which are involved in the recognition of uracil and other unnatural bases in DNA and initiation of the base excision repair pathway. UDG of Vaccinia virus (referred to as D4) belongs to the family I UDGs, which are highly specific for DNA substrates containing uracil. D4, however, is a unique member of this family in that it is an intrinsic component of the viral replication machinery (Ishii & Moss, 2002 ▶). D4, together with viral proteins A20 and DNA polymerase E9, form the polymerase holoenzyme, which is necessary for processive DNA synthesis (Stanitsa et al., 2006 ▶; Boyle et al., 2011 ▶). This essential role of D4 in processivity is not dependent on its glycosylase activity (DeSilva & Moss, 2003 ▶).
D4 (gene D4R; GenBank accession YP_232991) contains 218 amino acids and has a calculated molecular mass of 25 068 Da. Molecular-weight estimation by analytical size-exclusion chromatography (SEC) indicated that D4 exists as a monomer (Boyle et al., 2011 ▶). UDGs from various organisms are catalytically active in the monomeric form (Slupphaug et al., 1993 ▶; Lanes et al., 2000 ▶). Although we have previously assigned a dimeric state for D4, the physiological relevance of this form remains unknown (Schormann et al., 2007 ▶). At the same time results of SEC may not accurately reflect the dynamic nature of protein–protein interactions in solution. While further investigation on the oligomeric state of D4 is in progress, the crystal structure of D4 in diverse crystallographic environments exhibited a characteristic dimeric assembly (PDB codes: 2owr, 2owq, Schormann et al., 2007 ▶; 3nt7, Druck Shudofsky et al., 2010 ▶). In a recently published solution study Sèle et al. (2013 ▶) suggested that the dimer interface noticed in the crystal structure may play a significant role in the formation of the processive polymerase complex.
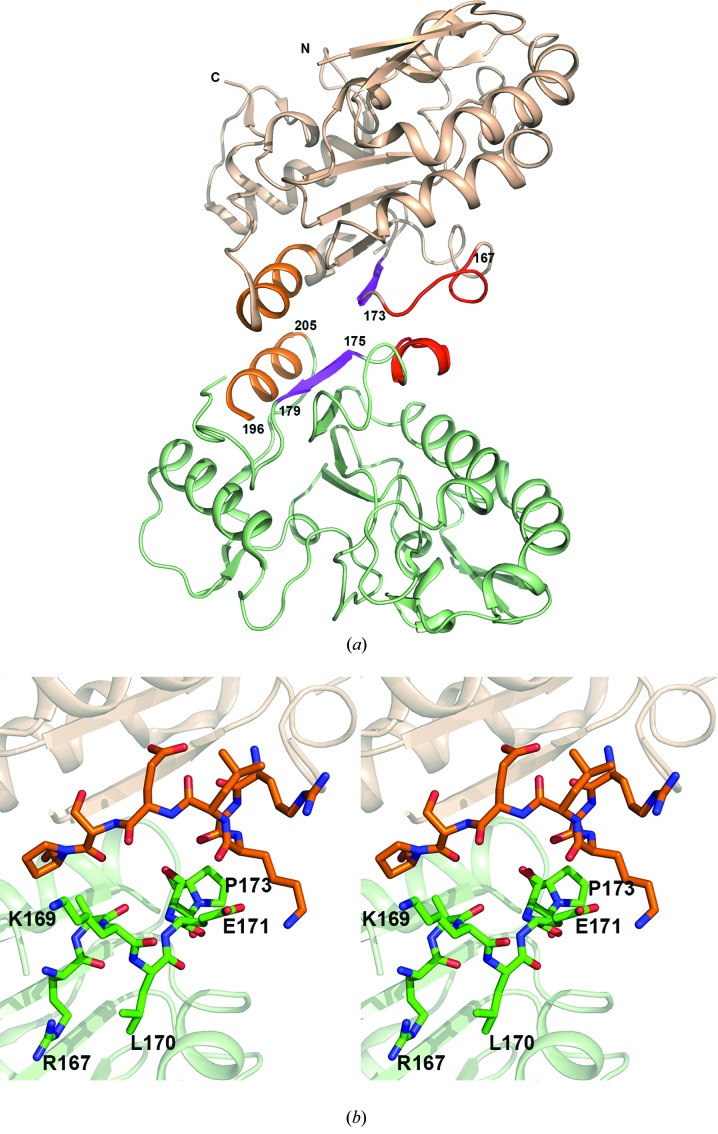
D4 is a single-domain protein and displays an α/β-fold, typical of UDGs, composed of a four-stranded β-sheet and four α-helices. In the crystal structures, D4 subunits, related by crystallographic or non-crystallographic twofold symmetry, are arranged in such a way that the C-terminal β-strands (residues 175–179, shown in magenta in Fig. 1 ▶ a) of the central four-stranded β-sheet from each subunit form an extended sheet structure (Fig. 1 ▶ a). The dimer interface is lined by a helix (from each symmetrical D4 subunit, shown in orange in Fig. 1 ▶ a) on one side of the β-sheet and a loop/short helix on the other side (shown in red in Fig. 1 ▶ a). This latter loop/helix segment (residues 160–175) represents one of the most flexible regions in all D4 structures, often missing several residues from the final model because of disorder (Fig. 1 ▶). Amino-acid residues at this interface, especially the ones which remain exposed on the surface, may be important for macromolecular interactions required for D4’s function. In order to further investigate the role this region plays in the structure and function of D4 we have expressed mutant forms of recombinant D4 in which one or more residues in this area were altered. Specifically, residue Arg167 of D4 was changed to alanine (R167AD4), residues Glu171, Ser172 and Pro173 were all mutated to glycine (3GD4), and residues Glu171 and Ser172 were deleted (Δ171-172D4). Amino-acid residues in the area selected for mutation do not have a major role in the association of the subunits in the crystal structures of wild-type D4 (Fig. 1 ▶ b). These mutations are, therefore, not expected to cause any major impact on the interactions between the subunits and the quaternary structure of the protein. In order to analyze the effect of these mutations on the structure at the specific interface, and the overall structure and packing of D4, we have crystallized each mutant. Here, we report the crystallization and preliminary X-ray diffraction analysis of these mutants.
Figure 1.
Site of mutations. (a) Cartoon diagram showing the dimer interface between the C and D subunits (shown in wheat and light green color) of the orthorhombic crystal form of wild-type D4 (PDB code: 2owr). The segments of subunits that contribute to dimer interfaces are shown in different colors. In each subunit the β-strand (residues 175–179) is shown in magenta, the α-helix (residues 196–205) is shown in orange and the loop/helix (residues 167–173) on the opposite side of the β-sheet is shown in red. The subunit pair was chosen because all residues in the range were present in the model. (b) A close-up view of the site of mutations shown in stereo. Residues in the range 167–173 in each subunit are shown as a stick model. Some residues have been labeled.
2. Materials and methods
2.1. Construction of mutant plasmids
Specific mutations in the D4 sequence were introduced in the expression plasmid pET15b (Novagen) by site-directed mutagenesis using the QuickChange mutagenesis kit (Stratagene). The R167AD4 mutant was constructed using the following primers: forward, 5′-CAGATTTCTCGAATATAGCGGCCAAGTTAGAATCCCCGG-3′, and reverse, 5′-CCGGGGATTCTAACTTGGCCGCTATATTCGAGAAATCTG-3′. The 3GD4 mutant was constructed with the following primers: forward, 5′-CGAATATACGGGCCAAGTTAGGAGGCGGGGTAACTACCATAGTCGG-3′, and reverse, 5′-CCGACTATGGTAGTTACCCCGCCTCCTAACTTGGCCCGTATATTCG-3′. The Δ171-172D4 mutant was constructed with the following primers: forward, 5′- CGAATATACGGGCCAAGTTACCGGTAACTACCATAGTCGG-3′, and reverse, 5′- CCGACTATGGTAGTTACCGGTAACTTGGCCCGTATATTCG-3′. The cycles were as follows: denaturation at 368 K for 4 min, followed by 12 cycles of 368 K for 30 s, 328 K for 1 min and 345 K for 6 min. The DNA sequence of each construct was confirmed by automated DNA sequencing.
2.2. Expression and purification of D4 mutants
Mutant D4 proteins were expressed following the protocol described for expression of wild-type D4 (Schormann et al., 2007 ▶). Recombinant plasmids were transformed into Escherichia coli strain Rosetta(DE3)plysS and recombinants were selected on LB agar plates containing ampicillin (50 µg ml−1) and chloramphenicol (34 µg ml−1). For protein expression single colonies were grown overnight at 310 K in LB medium containing ampicillin (50 µg ml−1) and chloramphenicol (34 µg ml−1). Overnight cultures were diluted 1:100 in the same medium supplemented with 0.2% glucose and the cultures were grown at 310 K until the OD (600 nm) reached approximately 0.8. Induction of protein expression was initiated by the addition of isopropyl β-d-1-thiogalactopyranoside to a final concentration of 0.4 mM and cultures were grown at 295 K for an additional 16 h.
Recombinant mutant D4 protein samples were purified by cobalt-ion chelate affinity and SEC at 277 K. Frozen bacterial pellet was suspended in lysis buffer [25 mM HEPES pH 7.3, 0.3 M KCl, 5 mM β-mercaptoethanol, 0.1 mM phenylmethyl sulfonyl fluoride (PMSF), 5 mM benzamidine hydrochloride] and lysed by two cycles of freezing and thawing. The lysate was incubated with 0.5 µg ml−1 DNAse I at 277 K for 30 min and centrifuged at 46 000g for 30 min. The supernatant was loaded onto a TALON column (Clontech Laboratories) equilibrated with lysis buffer. The column was then washed with approximately 20 column volumes of wash buffer (lysis buffer containing 30 mM imidazole). Bound protein was eluted with a linear gradient of imidazole (30–300 mM) and concentrated for loading onto a Superdex 75 HR16/60 column (∼120 ml) equilibrated with 25 mM HEPES pH 7.3, 0.3 M KCl, 1 mM tris(2-carboxyethyl)phosphine (TCEP). Protein fractions were pooled and concentrated using an Amicon ultracentrifugal unit with a 10 kDa cut-off (EMD Millipore Chemicals). Each mutant contained an N-terminal tag of the following sequence: MGSSHHHHHHSSGLVPRGSH (thrombin cleavage sequence is in bold).
Hexa-histidine tags were removed from the 3GD4 and R167AD4 mutants by incubating with thrombin (1 unit per mg of protein) overnight at 277 K. Progression of cleavage was monitored on 12% SDS–PAGE. The digestion product was passed over a small TALON or Ni–NTA (Qiagen) column to remove any residual undigested his-tagged protein; the tag-free protein collected in the column flow-through was concentrated and fractionated on a Superdex 75 HR16/60 column. Fractions containing the tag-free mutant proteins 3GD4 and R167AD4 were pooled, concentrated and stored at 193 K. In the his-tag-free form, Δ171-172D4 showed a tendency to aggregate at approximately 4 mg ml−1 concentration and, therefore, was crystallized in the tagged form. Protein concentration was determined by the Bradford method.
2.3. Crystallization and diffraction data collection
All three proteins were crystallized using the hanging-drop vapor-diffusion technique. Protein preparations used for crystallization were in 25 mM HEPES pH 7.3, 0.3 M KCl, 1 mM TCEP. Our initial crystallization trials with mutant proteins involved screening around the conditions previously used for crystallization of wild-type D4 (Schormann et al., 2007 ▶). Small crystals of Δ171-172D4 were obtained at room temperature but the other two mutants did not produce any crystals in similar conditions. Crystallization conditions for R167AD4 and 3GD4 were identified in new screening experiments.
2.3.1. Δ171-172D4
The sample of Δ171-172D4 used for crystallization contained the hexa-histidine tag. Initial crystals were obtained by mixing 2 µl of protein solution (12 mg ml−1) with 1 µl of water and 1 µl of reservoir solution consisting of 1.0 M ammonium sulfate, 0.1 M HEPES buffer pH 7.4. The mixture was allowed to equilibrate against 1 ml reservoir solution at 295 K. A seed stock was prepared using a small crystal (<0.04 mm), which was thoroughly washed and crushed in 100 µl of reservoir solution using a needle, followed by mixing using a vortex. The seed stock was diluted 1:10 using the new reservoir solution consisting of 0.9 M ammonium sulfate in 0.1 M HEPES buffer pH 7.4, 10% glycerol (GOL). For crystallization 2 µl of protein solution was mixed with 1 µl of water and 1 µl of reservoir solution containing diluted seed solution and sealed over a reservoir consisting of 0.6–1.0 M ammonium sulfate, 0.1 M HEPES buffer pH 7.4, 10% GOL. Three rounds of seeding were performed, each time preparing seeds from freshly grown crystals. The reservoir solution for growing the crystal, which was used for data collection, contained 0.9 M ammonium sulfate.
X-ray diffraction data for Δ171-172D4 were collected in-house using Cu Kα radiation on an R-AXIS IV image-plate detector (Rigaku Corporation). A single crystal was quickly soaked in a cryo-solution containing 22.5% GOL in the reservoir solution and placed in a nitrogen stream at 100 K. A total of 320 frames of oscillation data were collected for 15 min each using an image width of 0.5°. The crystal-to-detector distance was 150 mm. Intensity data were processed using d*TREK (version 9.4L; Pflugrath, 1999 ▶) and SCALA (Evans, 2006 ▶).
2.3.2. R167AD4
A crystallization condition for tag-free R167AD4 was identified using a PEG/Ion screening kit (Hampton Research) at 277 K. Initial crystals were obtained by mixing 1 µl protein solution (10.7 mg ml−1), 0.5 µl water and 0.5 µl reagent #2 (20% PEG 3350, 0.2 M potassium fluoride). Crystals used for X-ray diffraction were obtained using the following reservoir solution: 16% PEG 3350, 0.15 M potassium fluoride, 10% GOL. X-ray diffraction data were collected at the APS (Advanced Photon Source), on beamline NE-CAT 24-ID-C on a Pilatus6M detector. A single crystal, quickly soaked in a cryo-solution that contained 22%(w/v) GOL in the reservoir solution, was flash-cooled in liquid nitrogen. A total of 360 images (0.5°/frame) were collected at a crystal-to-detector distance of 300 mm. Intensity data were processed by using HKL-2000 (Otwinowski & Minor, 1997 ▶) and SCALA (Evans, 2006 ▶).
2.3.3. 3GD4
Crystals of tag-free 3GD4 mutant were grown at 277 K. Initial crystals were identified in a Natrix crystallization screen (Hampton Research) using protein at a concentration of 9.6 mg ml−1. Small needle-shaped crystals were obtained in reagent #1 (1.8 M lithium sulfate, 50 mM MES buffer pH 5.6, 10 mM magnesium chloride). A seed stock was prepared in the above reagent using a crystal (∼0.02 mm in length). Diffraction-quality crystals were obtained by mixing 1 µl of protein solution, 0.5 µl of reservoir solution and 0.5 µl of seed solution. The optimized reservoir solution contained 2.0 M lithium sulfate in 50 mM MES buffer pH 5.6, 5 mM magnesium chloride, 5% ethylene glycol (EDO).
For intensity data collection a single crystal was quickly soaked in 22% EDO in the reservoir solution and flash-cooled in liquid nitrogen. X-ray diffraction data were collected at the APS, on beamline NE-CAT 24-ID-C on a Pilatus6M detector. A total of 135° of oscillation data (1°/frame) were collected at a crystal-to-detector distance of 380 mm. Intensity data were processed by using HKL-2000 (Otwinowski & Minor, 1997 ▶) and SCALA (Evans, 2006 ▶). Data-collection statistics are given in Table 1 ▶.
Table 1. Data-collection statistics.
Values in parentheses are for the highest-resolution bin. R p.i.m. and R meas were calculated with SCALA (Evans, 2006 ▶) in the CCP4 program suite (Winn et al., 2011 ▶) using unmerged and not scaled data preprocessed by HKL-2000 (Otwinowski & Minor, 1997 ▶) and d*TREK (Pflugrath, 1999 ▶). R meas is a merging R factor that is independent of data redundancy while R p.i.m. provides the precision of the averaged measurement, which improves with higher multiplicity (Weiss, 2001 ▶). The SCALA output was only used to generate merging R values.
| Δ171-172D4 | R167AD4 | 3GD4 | |
|---|---|---|---|
| Wavelength (Å) | 1.5418 | 0.9792 | 0.9792 |
| Resolution range (Å) | 19.87–2.30 (2.42–2.30) | 46.57–1.90 (2.00–1.90) | 47.53–2.26 (2.38–2.26) |
| Space group | P21212 | P212121 | P3121 or P3221 |
| Unit-cell dimensions (Å) | a = 101.90, b = 130.51, c = 86.31 | a = 72.14, b = 118.27, c = 121.97 | a = 93.38, b = 93.38, c = 285.18 |
| No. molecules in asymmetric unit | 4 | 4 | 6 |
| V M (Å3 Da−1) | 2.86 | 2.59 | 2.37 |
| Solvent content (%) | 56.0 | 52.5 | 48.2 |
| Total no. of observed reflections | 324440 (45680) | 621747 (95130) | 337223 (51114) |
| No. of unique reflections | 51717 (7419) | 80549 (11684) | 68116 (9832) |
| Completeness (%) | 99.7 (99.6) | 97.4 (97.6) | 99.3 (99.7) |
| Multiplicity | 6.3 (6.2) | 7.7 (8.1) | 5.0 (5.2) |
| Mean I/σ(I) | 15.1 (4.3) | 13.4 (3.9) | 20.2 (2.2) |
| R merge † | 0.089 (0.514) | 0.110 (0.597) | 0.044 (0.508) |
| R p.i.m. ‡ | 0.038 (0.219) | 0.046 (0.233) | 0.026 (0.277) |
| R meas § | 0.097 (0.560) | 0.128 (0.673) | 0.057 (0.639) |
R
merge = 
 .
.
R
p.i.m. = 
 .
.
R
meas = 
 .
.
3. Results and discussion
The mutant D4 preparations purified from the TALON column were nearly homogeneous. When pooled fractions were concentrated and subjected to SEC, each protein eluted as a single peak. Fractions representing the protein peak were concentrated. Each purified protein contained a vector-derived N-terminal hexa-histidine tag and a thrombin cleavage sequence. The tag was cleaved from R167AD4 and 3GD4 mutants by treatment with thrombin. Tag-free R167AD4 and 3GD4 contained three additional residues (GSH) at the N-terminus. The tag-free protein was subsequently purified by affinity chromatography on a TALON column and SEC on Superdex 75. The elution volumes for tag-free R167AD4 and 3GD4 and his-tagged Δ171-172D4 were in the range of 63.4–67.6 ml (see Table 2 ▶). Under similar conditions ovalbumin (M r = 44 000 Da) and chymotrypsinogen (M r = 25 000 Da) eluted at 63.9 and 71.5 ml, respectively. By comparison, the elution volume for wild-type tag-free D4 (M r = 25 168 Da) was 68.3 ml. Thus, no significant change in the assembly of D4 (as a result of these mutations) was detected. SDS–PAGE analysis of protein samples used for crystallization is shown in Fig. 2 ▶. It should be noted that the Δ171-172D4 mutant used for crystallization contained the hexa-histidine tag.
Table 2. Comparison of elution volumes of the mutants and standard proteins.
| Protein | Theoretical molecular mass (Da) | Elution volume (ml) |
|---|---|---|
| Standard | ||
| Ovalbumin | 44 000 | 63.9 |
| Carbonic anhydrase | 29 000 | 70.4 |
| Chymotrypsinogen | 25 000 | 71.5 |
| Sample | ||
| R167AD4 | 25 246 | 67.6 |
| 3GD4 | 25 190 | 63.6 |
| Δ171-172D4 | 26 998 | 63.4 |
Figure 2.
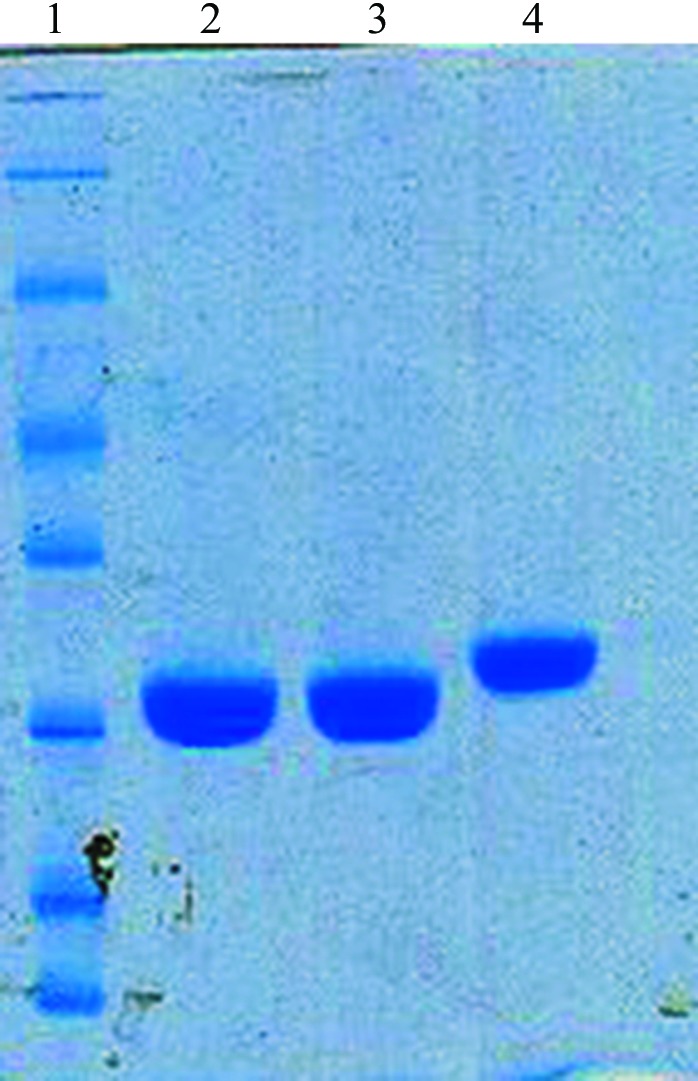
SDS–PAGE analysis of D4 mutants. Purified protein samples (2 µl) used in crystallization mixed with 20 µl of SDS denaturing sample buffer, heated at 363 K for 1 min. 5 µl of each sample were loaded onto 12% PAGE containing 1% SDS and subjected to electrophoresis. Gel was fixed in 50% ethanol, 5% acetic acid mixture, stained with Coomassie Blue R250 (BioRad) and destained in 5% acetic acid. Lane 1: molecular-weight standards (M r from top: 116, 66.2, 45.0, 35.0, 25.0, 18.4 and 14.4 kDa). Lane 2: tag-free R167AD4. Lane 3: tag-free 3GD4. Lane 4: hexa-histidine-tagged Δ171-172D4.
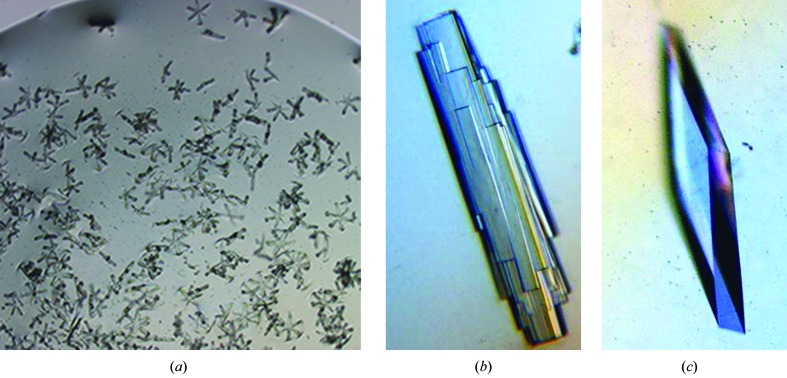
Of the three mutants only Δ171-172D4 produced crystals in a condition similar to that used for crystallizing wild-type D4. Therefore, crystallization conditions for R167AD4 and 3GD4 were identified by manual screening. Crystals of Δ171-172D4 were grown by microseeding using initial small crystals, which grew as star-shaped needles, to prepare a seed stock (Fig. 3 ▶ a). New seed stocks were prepared from crystals obtained in subsequent experiments. Occasionally, crystals appeared as stacks of plates but the addition of 5–10% GOL reduced the nucleation and improved the shape and size of the crystals significantly (Figs. 3 ▶ b and 3 ▶ c). Finally, crystals longer than 0.5 mm in dimension were grown from 2 µl droplets. These crystals belong to the orthorhombic space group P21212 and diffracted to 2.3 Å resolution at our in-house source.
Figure 3.
Crystals of Δ171-172D4. (a) Initial crystals of Δ171-172D4. (b) Crystals of Δ171-172D4 grown by microseeding. (c) Final crystals of Δ171-172D4 grown after optimization. These crystals were up to 1.0 × 0.5 × 0.1 mm in size.
Crystals of tag-free R167AD4 appeared at 277 K as thin needles or clusters of needles. Optimization of the initial conditions (pH and precipitant concentration) and the inclusion of additives such as glycerol and ethylene glycol did not change the crystal morphology significantly (Fig. 4 ▶). A thin needle-shaped crystal was flash-cooled and used for data collection. This crystal diffracted to 1.9 Å resolution. Systematic absences indicated that the R167AD4 crystal belongs to the orthorhombic space group P212121.
Figure 4.
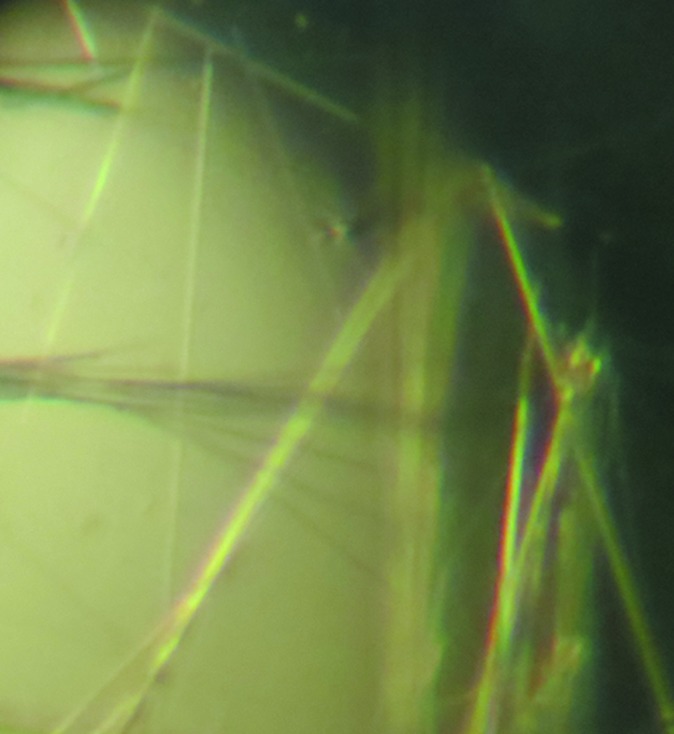
Crystals of R167AD4. Crystals of R167AD4 grew as thin needles at 277 K. Needles were extremely thin but approximately 1.0 mm or longer.
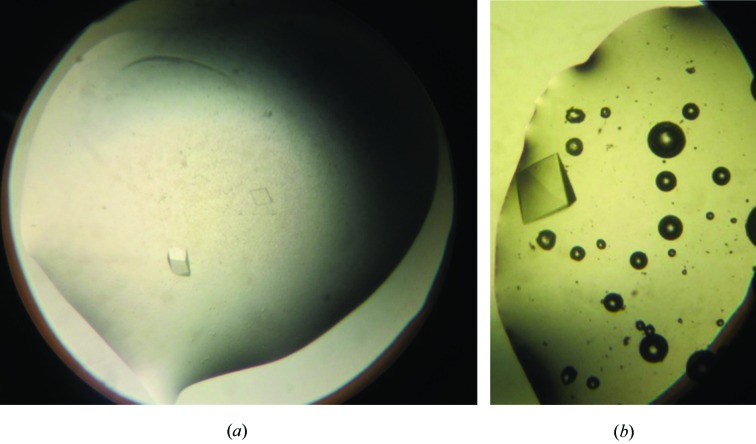
Crystals of tag-free 3GD4 suitable for diffraction analysis were grown by microseeding (Figs. 5 ▶ a, 5 ▶ b). Initial screening of 48 reagents of the Natrix kit resulted in one hit at 277 K. Small needle-shaped crystals were observed in reagent #1, which contained 1.8 M lithium sulfate, 10 mM magnesium chloride, 50 mM MES buffer pH 5.6. Efforts to improve the size and quality of crystals by altering the precipitant concentration, pH and drop size were not successful. Finally, a small crystal from the original screen was used to produce a seed stock. Small pyramid-shaped crystals (∼0.1 mm in longest dimensions) were obtained overnight when drops were supplemented with diluted seed stock (Fig. 5 ▶ a). The addition of EDO (5% in the reservoir) resulted in reduced nucleation and improvement in the size of the crystals which grew up to ∼0.2 mm in the longest dimension (Fig. 5 ▶ b). These crystals diffracted to at least 2.2 Å resolution at the synchrotron and belong to the trigonal space group P3121 or P3221. Diffraction patterns for all mutants are shown in Fig. 6 ▶. The structure of each mutant will be described elsewhere.
Figure 5.
Crystals of 3GD4. (a) Crystals of tag-free 3GD4 grown by microseeding. (b) Crystals of tag-free 3GD4 grown in the presence of ethylene glycol. These crystals were ∼0.2 × 0.2 × 0.1 mm.
Figure 6.
Diffraction images for crystals of mutant D4. (a) An X-ray diffraction image for the Δ171-172D4 crystal. The edge of the detector corresponds to a resolution of 2.05 Å. (b) An X-ray diffraction image for R167AD4. The edge of the detector corresponds to a resolution of 1.59 Å. (c) An X-ray diffraction image for 3GD4. The edge of the detector corresponds to a resolution of 1.99 Å.
Acknowledgments
This work was supported by the National Institutes of Health grant No. 5U01-A1 082211. Intensity data were collected at the Advanced Photon Source on the North-Eastern Collaborative Access Team beamlines, which are supported by grants from the National Center for Research Resources (5P41RR015301-10) and the National Institute of General Medical Sciences (8 P41 GM103403-10) from the National Institutes of Health. Use of the Advanced Photon Source, an Office of Science User Facility operated for the US Department of Energy (DOE) Office of Science by Argonne National Laboratory, was supported by the US DOE under contract No. DE-AC02-06CH11357.
References
- Boyle, K. A., Stanitsa, E. S., Greseth, M. D., Lindgren, J. K. & Traktman, P. (2011). J. Biol. Chem. 286, 24702–24713. [DOI] [PMC free article] [PubMed]
- De Silva, F. S. & Moss, B. (2003). J. Virol. 77, 159–166. [DOI] [PMC free article] [PubMed]
- Druck Shudofsky, A. M., Silverman, J. E., Chattopadhyay, D. & Ricciardi, R. P. (2010). J. Virol. 84, 12325–12335. [DOI] [PMC free article] [PubMed]
- Evans, P. (2006). Acta Cryst. D62, 72–82. [DOI] [PubMed]
- Ishii, K. & Moss, B. (2002). Virology, 303, 232–239. [DOI] [PubMed]
- Lanes, O., Guddal, P. H., Gjellesvik, D. R. & Willassen, N. P. (2000). Comput. Biochem. Physiol. B, 127, 399–410. [DOI] [PubMed]
- Otwinowski, Z. & Minor, W. (1997). Methods Enzymol. 276, 307–326. [DOI] [PubMed]
- Pflugrath, J. W. (1999). Acta Cryst. D55, 1718–1725. [DOI] [PubMed]
- Schormann, N., Grigorian, A., Samal, A., Krishnan, R., DeLucas, L. & Chattopadhyay, D. (2007). BMC Struct. Biol. 7, 45. [DOI] [PMC free article] [PubMed]
- Sèle, C., Gabel, F., Gutsche, I., Ivanov, I., Burmeister, W. P., Iseni, F. & Tarbouriech, N. (2013). J. Virol. 87, 1679–1689. [DOI] [PMC free article] [PubMed]
- Slupphaug, G., Markussen, F. H., Olsen, L. C., Aasland, R., Aarsaether, N., Bakke, O., Krokan, H. E. & Helland, D. E. (1993). Nucleic Acids Res. 21, 2579–2584. [DOI] [PMC free article] [PubMed]
- Stanitsa, E. S., Arps, L. & Traktman, P. (2006). J. Biol. Chem. 281, 3439–3451. [DOI] [PubMed]
- Weiss, M. S. (2001). J. Appl. Cryst. 34, 130–135.
- Winn, M. D. et al. (2011). Acta Cryst. D67, 235–242.


