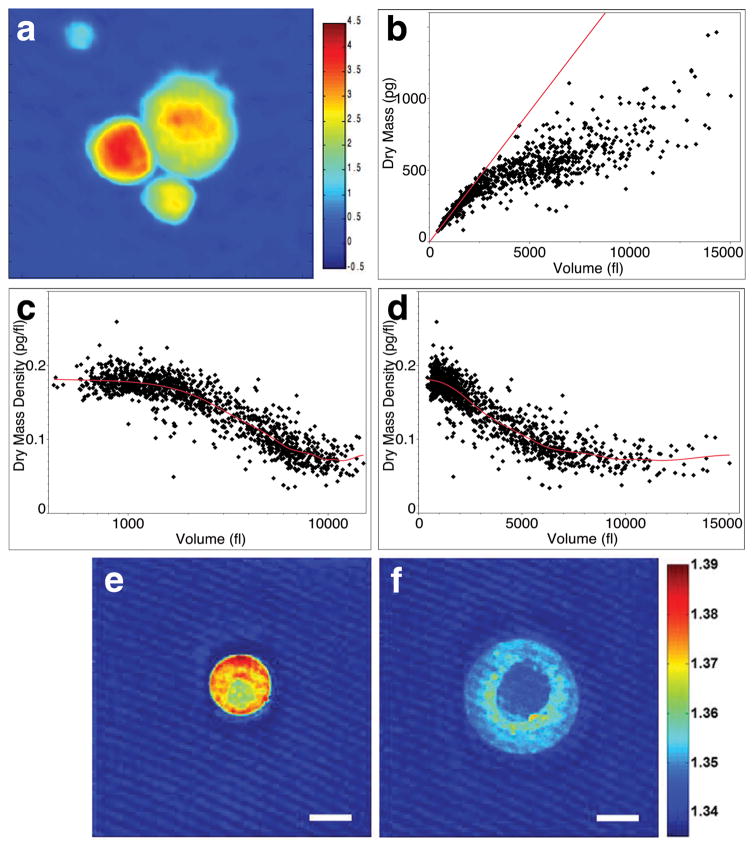
Figure 1. Hypertrophic chondrocytes increase in volume through three distinct phases including a phase of massive cell swelling.
a, Phase image of dissociated mouse proximal tibia hypertrophic chondrocytes at postnatal day 5 (P5). Color bar represents phase shift in radians. b, Volume versus dry mass plotted for individual chondrocytes. Linear regression for cells up to 1,000 fl highlights divergence of larger cells from an initial slope of 0.183 pg/fl. Log scale (c) and linear scale (d) plots of volume versus dry mass density. Lambda for the smoothened spline in (c) and (d) is 5e+9. R2 value is 0.84. n=1249 cells summed across five independent experiments. e, f, Horizontal cross sections from regularized tomographic phase microscopy density reconstructions of a small (e) and a large (f) mouse tibia chondrocyte. Color bar represents refractive index and thus dry mass density. Scale bar is 10 μm.

