

Abstract
Mountaintop removal mining (MTR) is a major industry in southern West Virginia with many detrimental effects for small to mid-sized streams, and interest in alternative, sustainable industries is on the rise. As a first step in a larger effort to assess the value of sport fisheries in southern West Virginia, we estimate the potential abundances of two popular sport fishes—smallmouth bass (Micropterus dolomieu) and brook trout (Salvelinus fontinalis)—in the Coal River Basin (CRB). A self-thinning model that incorporates net primary production and terrestrial insect subsidies is first used to predict potential densities of adult (age 1+) smallmouth bass and brook trout. Predicted densities (fish ha−1) are then multiplied by the surface area of the CRB stream network (ha) to estimate regional abundance. Median predicted abundances of bass and trout are 38 806 and 118 094 fish (total abundances with the CRB), respectively. However, when streams that intersect permitted MTR areas in the CRB are removed from the dataset, predicted abundances of bass and trout decrease by ~12–14 %. We conclude that significant potential exists in the CRB to capitalize on sport fisheries, but MTR may be undermining this potential.
Electronic supplementary material
The online version of this article (doi:10.1007/s13280-012-0346-6) contains supplementary material, which is available to authorized users.
Keywords: Smallmouth bass, Brook trout, Coal River Basin, West Virginia, Sport fisheries, Regional fish abundance
Introduction
Mountaintop removal mining (MTR), which includes most forms of surface coal mining, is an enormous industry in the Central Appalachian region, USA, and is particularly prevalent in the state of West Virginia (WV). For example, in 2008 the MTR industry employed 6991 people at 115 mines throughout WV, producing 69.4 million short tons of coal (Energy Information Administration 2010).
Unfortunately, MTR entails a host of negative side-effects including degradation of natural landscapes and topography, extensive deforestation, burial of headwater streams (i.e., valley fills), and the consequent declines in water quality and biodiversity (Bernhardt and Palmer 2011). MTR may also threaten human health via elevated risk of flooding (Phillips 2004) and by causing pollutants such as selenium to exceed toxicity thresholds (U.S. Environmental Protection Agency 2011).
Given these concerns, many scientists, legal professionals, and grass roots organizations have organized against MTR (e.g., Baller and Pantilat 2007; Bernhardt and Palmer 2011). However, MTR opponents face a fundamental socioeconomic problem: the MTR industry is most active in regions where poverty is high and alternative income is limited (Stewart Burns 2005). Prospects for generating other sources of revenue should therefore be central to anti-MTR campaigns (McIlmoil and Hansen 2009).
Sport fisheries are marketable resources that can help sustain the transition to post-MTR economies in WV. For instance, sport fishing generates >350 million USD in annual retail sales and >130 million USD in annual wages and business earnings throughout the state of WV (Southwick Associates 2007). Notably, much of this revenue (~86 %) is generated through stream and river fisheries. In other states where lakes and reservoirs are more prevalent, streams and rivers account for a smaller percentage of sport fishing revenues (Fisher et al. 1998). This means that WV’s streams and rivers are uniquely valuable. But they are also uniquely vulnerable to the damages caused by MTR (see Bernhardt and Palmer 2011; U.S. Environmental Protection Agency 2011). We therefore suspect that MTR is undermining the potential value of sport fisheries in southern WV.
Study Objectives
In this study, we begin to assess the potential value of sport fisheries within southern WV streams by predicting potential abundances of two popular sport fishes: smallmouth bass (Micropterus dolomieu) and eastern brook trout (Salvelinus fontinalis). Our primary objective is to place boundaries on the total abundances of adult smallmouth bass and adult brook trout that could potentially live within southern WV streams. A secondary objective is to perform an initial assessment of MTR effects, by comparing potential sport fish abundances when MTR-impacted streams are and are not included in the regional dataset. More precise estimates that can guide fisheries managers in specific streams will be addressed in subsequent research, as will direct estimates of the economic benefits of enhanced sport fisheries within the region.
To predict regional sport fish abundances, we first partition the regional stream network into potential smallmouth bass and brook trout habitat. Next, we use a simple fish density model that builds upon the robust self-thinning relationship—the inverse relationship between body size and population density (Dunham and Vinyard 1997; Marquet et al. 2005)—to predict average sport fish densities. Finally, we estimate the surface area of the stream network and multiply surface area (ha) by the predicted sport fish densities (fish ha−1) to estimate potential fish abundances. A modeling approach is used because, to our knowledge, quantitative field estimates (e.g., mark-recapture surveys) of sport fish densities and/or abundances are not available in southern WV streams. Our model-based assessment also provides a mechanism to compare potential fish abundance in an extensively MTR-impacted landscape with potential fish abundance in the absence of MTR.
Materials And Methods
Study Area
Our study focused on the Coal River Basin (CRB; 2300 km2 basin area) in south-central WV (Fig. 1). The Coal River intersects the Central Appalachian Mountains and the Allegheny Plateau, and it drains into the Kanawha River. We chose the CRB because MTR is so prevalent within it: MTR activity, inclusive of all permitted surface mines (current and expired), encompasses ~20 % of the basin’s total surface area (see Fig. 1).
Fig. 1.
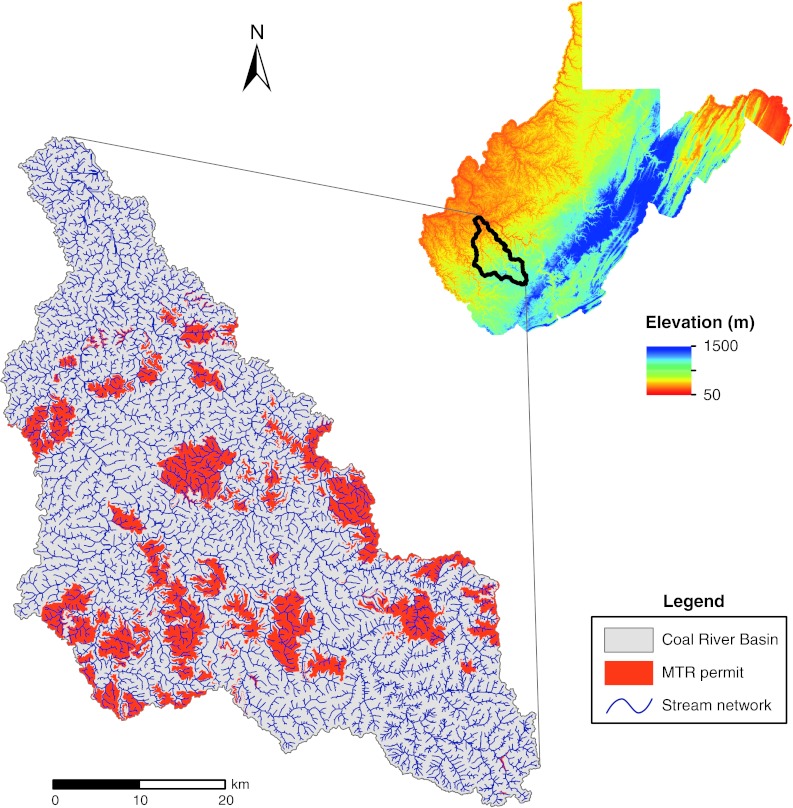
Map of streams and mountaintop removal mining (MTR) permits in the Coal River Basin, south-central West Virginia. The stream network is shown at the 1:24 000 scale. MTR permit data were downloaded from the West Virginia Department of Environmental Protection, Division of Mining and Reclamation and are current as of September 27, 2011
The CRB stream network was mapped using data from the U.S. National Hydrography Dataset, scale 1:24 000 (2011). MTR permit data were obtained from the WV Department of Environmental Protection, Division of Mining and Reclamation (2011). Elevation data were obtained from the U.S. National Elevation Dataset (2011).
Sport Fish Distributions
We modeled densities of two of the most popular sport fishes in WV: the smallmouth bass and the eastern brook trout. Smallmouth bass are native to and common in warm streams and rivers throughout WV, including the CRB (Stauffer et al. 1995). Brook trout are common in cool to cold-water streams throughout much of the Central Appalachian region (Hudy et al. 2008) but are presently limited to several stocked, headwater streams in the CRB (Marsh Fork, Pond Fork, Spruce Laurel Fork, and Hopkins Fork; see West Virginia Department of Natural Resources 2011). Anecdotal sources indicate that wild, self-sustaining brook trout populations were historically present in the region (Goldsborough and Clark 1908), but there is currently insufficient evidence to confirm this (Hudy et al. 2008).
Because the historical status of brook trout in the CRB is unknown, we used two scenarios to predict regional distributions of smallmouth bass and brook trout. In Scenario 1, we assumed that brook trout were native to a subset of small, cold-water, high gradient streams within the CRB and that they could re-colonize these streams if appropriate habitat restoration efforts, such as stream bank stabilization, addition of large woody debris, and/or liming to mitigate acidic conditions were completed (e.g., Hunter 1991; Hudy et al. 2000). We also assumed that smallmouth bass occupy all remaining small to mid-size streams, but that bass and trout do not co-occur in the same streams (Martin and Petty 2009). The resulting distributions of brook trout (cold-water) and smallmouth bass (warm-water) streams are shown in Fig. 2a for Scenario 1. In Scenario 2, we assumed that brook trout are not native to the CRB (i.e., trout abundance is zero) and that smallmouth bass are the most abundant sport fish in small to mid-size streams throughout the basin. All streams shown in Fig. 2a (red and blue segments) were therefore assumed to represent smallmouth bass habitat in Scenario 2. Complete details on the criteria used to predict bass and trout distributions in the CRB are shown in Table 1 for both Scenarios 1 and 2.
Fig. 2.

a Predicted distribution of cold-water (i.e., brook trout habitat) and warm-water (i.e., smallmouth bass habitat) streams in Scenario 1, within the Coal River Basin. All streams were predicted to be warm-water habitats in Scenario 2. Mainstream river segments in the Coal River Basin are populated by multiple large, apex predators and were not included in our analyses. b Observed relationship between stream order and stream channel width. Stream order was inferred for select segments from the National Hydrography Dataset and corresponding channel width measurements were obtained from West Virginia Department of Environmental Protection (1997)
Table 1.
Outline of criteria used to predict brook trout and smallmouth bass habitats/distributions within the Coal River Basin, WV, and total stream surface area estimates of trout and bass habitats in Scenarios 1 and 2
| Distribution criteria | Total surface area of stream habitat (ha) | ||
|---|---|---|---|
| All streams included | MTR streams removed | ||
| Scenario 1 | |||
| Brook trout | All 1st–4th order streamsa ≥500 m elevationb | 66 | 58 |
| Smallmouth bass | 1st–4th order streams <500 m elevation + all 5th order streamsc | 437 | 373 |
| Scenario 2 | |||
| Brook trout | No habitat available | 0 | 0 |
| Smallmouth bass | All 1st–5th order streamsd | 503 | 431 |
aStream order is an index of stream size; stream networks originate from 1st order streams, whereas 2nd order streams are formed by the confluence of two 1st order streams, 3rd order streams are formed by the confluence of two 2nd order streams, etc. (Strahler 1957)
bStream temperature decreases with elevation and streams below 500 m elevation are generally too warm to support resident trout populations in WV (Clingerman 2008)
cStreams ≥6th order were not included in our analyses because these large, mainstream rivers are populated by a variety of large-bodied, predatory fishes (e.g., blue catfish, Ictalurus furcatus, and walleye, Sander vitreus; Stauffer et al. 1995) that are also harvested by recreational anglers, and we did not have data to calibrate the fish density model for use in multi-species assemblages or to simultaneously predict the densities of multiple competing sport fish species
dSome 1st–2nd order streams may be too small to provide suitable habitat for smallmouth bass, but these headwater streams were maintained in the dataset because bass have been documented in small, high elevation WV streams (e.g., Martin and Petty 2009)
Modeling Sport Fish Densities
To predict potential sport fish densities, we used the self-thinning model of McGarvey and Johnston (2011). Complete details on the modeling procedure are provided in the Electronic Supplementary Material. Interested readers should also consult McGarvey and Johnston (2011). Briefly, we used the self-thinning relationship to predict fish population density (D, in fish ha−1) as
 |
1 |
where M is the average body mass (in grams wet-weight; g WW) of individuals within a given population, a is a constant that reflects resource availability and is approximated as fish population biomass (in g WW ha−1; see below), and b is a unit-less scaling exponent that reflects individual metabolism (Marquet et al. 2005). Self-thinning predicts that D is an inverse function of M in resource-limited systems because large individuals consume more resources than smaller individuals, and it is one of the most robust patterns in fisheries science (e.g., Grant 1993; Dunham and Vinyard 1997).
We estimated M independently for adult (age 1+) smallmouth bass and brook trout using field measurements from Central Appalachian streams (Table 2). To estimate the self-thinning exponent b, we used a Monte Carlo procedure: 5000 samples were drawn at random from the empirical b distribution shown in McGarvey and Johnston (2011; see their Fig. 2d). Each b sample was then used in a single model simulation and the results from all 5000 simulations were compiled to generate a range of model-predicted D values.
Table 2.
Parameter estimates and data sources used in the brook trout and smallmouth bass density models
| Parameter/variable | Value | Source(s) | Comments |
|---|---|---|---|
| NPPauto | 4.1 g C m−2 year−1 | Hornick et al. (1981) | Average value in Piney Branch (Rockbridge County, VA) |
| NPPallo | 230.0 g C m−2 year−1 | Hornick et al. (1981) | Combined average for Piney Branch and Guys Run (Rockbridge County, VA) |
| INSterr | 28.3 g WW m−2 year−1 | Cloe and Garman (1996) | Sum of seasonal totals (daily averages × 91 days season−1) in Little Whittle and Byrd Creek, VA |
| Brook trout M | 29.3 g WW | Carline and McCullough (2003) | Average total length of age 1+ trout in Vance Run, WV (1995 data); converted to mass with a length-mass regression from Carlander (1969) |
| Brook trout observed D | 530–1119 fish ha−1 (median = 1071) | Neves and Pardue (1983) | Guys Run, VA data; all sites combined |
| 280–2370 fish ha−1 (median = 850) | Utz and Hartman (2009) | Middle Fork River, WV data; all sites combined | |
| Smallmouth bass M | 104.4 g WW | Austen and Orth (1988) | Average total length of age 1+ bass in the New River, WV (1982 and 1983 data combined); converted to mass with a length-mass regression from Carlander (1977) |
| Smallmouth bass observed D | 84–146 fish ha−1 (median = 115) | Roell and Orth (1993) | New River, WV data; all years and age 1+ smallmouth bass combined |
| 3–115 fish ha−1 (median = 32) | Odenkirk and Smith (2005) | James and Rappahannock Rivers, VA data; all sites combined | |
| 8–655 fish ha−1 (median = 149) | Dauwalter et al. (2007) | Eastern OK streams data; all sites with smallmouth bass present combined |
Net primary production (NPP) estimates are reported in grams of carbon (C). Terrestrial insect production (INSterr) and fish body masses (M) are reported in grams wet-weight (WW)
Fish population biomasses (independent estimates for bass and trout) were used as approximations of the constant a (see McGarvey and Johnston 2011). To calculate bass and trout biomass, we first compiled and summed estimates of all basal in-stream (algal production) and terrestrial (leaf litter) energetic resources that contribute to bass and trout growth within Central Appalachian streams (see Electronic Supplementary Material; Table 2). Next, we added terrestrial insect subsidies (i.e., terrestrial insects that fall into the stream and can be consumed by fish) to the sum of basal resources, after accounting for their differing trophic levels (i.e., plants occur at trophic level 1, while insects consume plants and therefore occur at trophic level 2; see Electronic Supplementary Material). We then removed a fraction of the total available resources to account for consumption by interspecific competitors, such as predatory salamanders. To do this, we drew random samples from a uniform distribution ranging from 0.25 to 0.75 (i.e., interspecific competitors consume between 25 and 75 % of the available resources) and used each sample in a Monte Carlo simulation (5000 iterations) where competitor consumption was subtracted from the sum of available resources (see Electronic Supplementary Material).
Once the energetic resources available to smallmouth bass and brook trout (expressed as primary and secondary production) had been summed and the quantity consumed by competitors had been removed, we used trophic transfer efficiency (i.e., the fraction of production at one trophic level that is converted to consumer tissue at the next trophic level; Lindeman 1942) estimates to predict bass and trout (i.e., tertiary) production values. Fish production estimates were then converted to population biomass estimates with the production:biomass ratio data of Randall et al. (1995). Random samples were drawn from the empirical production:biomass distribution and used in Monte Carlo simulations (5000 iterations; see Electronic Supplementary Material and Fig. 2c in McGarvey and Johnston 2011). Finally, the predicted bass and trout biomass estimates were used to approximate the self-thinning constant a, allowing us to complete Eq. 1 and predict bass and trout densities. 5000 Monte Carlo iterations were performed for each species, using the randomly sampled b, competitor consumption, and production:biomass ratio values (see above). Model-predicted bass and trout D estimates were then converted from fish m−2 to fish ha−1 values.
Regional Fish Abundances and MTR Effects
To estimate total potential smallmouth bass and brook trout abundances within the CRB, we multiplied the predicted densities (fish ha−1) by the surface areas (ha) of their respective habitats (red and blue segments in Fig. 2a). Stream surface area was estimated by multiplying the length of each stream segment by its average width, while stream width was inferred from stream order. To do this, we first matched field-measured stream widths from West Virginia Department of Environmental Protection (1997) to their corresponding digital stream segments. We then plotted stream order, which was interpolated from the digital stream network for each segment, against stream channel width. The resulting plot showed that stream order was an effective predictor of channel width (Fig. 2b) and the median observed widths were, respectively, used as channel width estimates for all 2nd, 3rd, 4th, and 5th order stream segments. Because 1st order streams were not included in West Virginia Department of Environmental Protection (1997), we assumed they were 0.5 m wide, or half the median width of 2nd order streams.
To assess MTR effects, we then estimated potential fish abundances when all streams that coincided with a MTR permit were removed from the stream network. This method assumed that all streams coinciding with an MTR permit were spoiled or eliminated, and therefore unavailable to smallmouth bass and brook trout. Thus, it provided a simple means of comparing potential sport fish abundance with and without MTR. Our method did not, however, incorporate chronic, downstream effects of MTR, such as elevated water temperatures or pollutant concentrations (Bernhardt and Palmer 2011; U.S. Environmental Protection Agency 2011). Our numbers are therefore only an indication of acute MTR effects, and they are likely to underestimate chronic MTR effects (see “Discussion”).
Results
Predicted smallmouth bass D was highly variable, with an interquartile range of 21–347 bass ha−1 (Fig. 3). Model-predicted D was, however, comparable to observed (i.e., field-measured; see Table 2) estimates of smallmouth bass D. For instance, the observed interquartile range of smallmouth bass D was also wide and it overlapped extensively with the predicted interquartile range. The median predicted and observed D (89 and 84 bass ha−1, respectively) were also very similar. We therefore concluded that the predicted D, particularly the medians and interquartile ranges, were useful indicators of potential smallmouth bass densities within the CRB.
Fig. 3.

Predicted and observed (i.e., field-measured) densities of brook trout and smallmouth bass. Boxplots show the interquartile ranges of the predicted (5000 Monte Carlo simulations) and observed (all field samples combined; see Table 2) fish densities. Whiskers show the 5th and 95th percentiles. Fish graphics are courtesy of the Integration and Application Network (http://ian.umces.edu/symbols/), University of Maryland Center for Environmental Science
Predicted brook trout D was also highly variable, yet comparable to the spread of the observed D in Appalachian streams (Fig. 3; see Table 2 for observed D data sources). The predicted D was, however, positively biased: it tended to overestimate brook trout D by ~60 %, relative to observed D (comparison of median values). This was not surprising because brook trout densities are typically lower in Central Appalachian streams than in other regions (Utz and Hartman 2009). Furthermore, our D model does not account for secondary constraints on population size, such as pollution or spawning habitat availability, and is therefore more likely to overestimate than to underestimate population density. Thus, we cautiously suggest that our predicted D provides a reasonable starting point for regional estimation of brook trout carrying capacity in the CRB.
The total surface area of brook trout habitat under Scenario 1 was estimated to be 58 ha when all streams that coincide with a permitted MTR region (see Fig. 1) were excluded (‘MTR streams removed’ in Table 1), and 66 ha when these streams were included (‘All streams included’ in Table 1). Total surface area of smallmouth bass habitat was estimated to be 373 ha when MTR was accounted for and 437 ha when MTR was not accounted for. Under Scenario 2, the total surface area of smallmouth bass habitat was estimated to be 431 and 503 ha, respectively, when MTR effects were and were not accounted for (Table 1).
When the model-predicted fish densities were multiplied by their respective stream surface areas in Scenario 1, we estimated that small to mid-size streams within the CRB can potentially support ~39 000 smallmouth bass and ~118 000 brook trout (median abundances of age 1+ individuals) when MTR effects were not accounted for (i.e., all streams were included; Table 3). Median predicted abundances of smallmouth bass and brook trout were ~33 000 and ~104 000, respectively, when MTR effects were accounted for (i.e., MTR streams were removed). Under Scenario 2, we estimated that CRB streams can potentially support ~38 000 smallmouth bass when MTR effects are accounted for, or ~45 000 bass when MTR effects are not accounted for. Complete abundance results, including interquartile ranges, are shown in Table 3.
Table 3.
Total predicted brook trout and smallmouth bass abundances within the Coal River Basin, West Virginia
| All streams included | MTR streams removed | |||||
|---|---|---|---|---|---|---|
| Predicted abundance | Predicted abundance | |||||
| 25 % | 50 % | 75 % | 25 % | 50 % | 75 % | |
| Scenario 1 | ||||||
| Brook trout | 50 774 | 118 094 | 253 070 | 44 619 | 103 779 | 222 395 |
| Smallmouth bass | 9 264 | 38 806 | 151 464 | 7 908 | 33 122 | 129 282 |
| Scenario 2 | ||||||
| Brook trout | 0 | 0 | 0 | 0 | 0 | 0 |
| Smallmouth bass | 10 664 | 44 666 | 174 340 | 9 137 | 38 273 | 149 385 |
The 25th, 50th, and 75th percentiles of the predicted sport fish abundances are shown with and without mountaintop removal mining (MTR) streams for Scenarios 1 and 2
Discussion
Sport fisheries are already a key source of revenue in many Central Appalachian communities (e.g., Fisher et al. 1998; McIntosh 1998; Southwick Associates 2007). By predicting sport fish abundances in CRB streams, we have taken a first step in characterizing the benefits that sport fisheries could potentially provide to heavily MTR-impacted communities in southern WV. When the acute effects of MTR were not accounted for (i.e., streams that overlie MTR permitted areas were included in our predictions), the median predicted abundance of adult smallmouth bass exceeded 35 000 in both Scenarios 1 and 2, and abundance exceeded 110 000 adult brook trout in Scenario 1. When MTR effects were accounted for (i.e., streams that overlie MTR permitted areas were removed), median potential abundance decreased by ~14 % for smallmouth bass (Scenarios 1 and 2) and ~12 % for brook trout (Scenario 1).
One critical limitation of this study is the simplistic method we used to predict the effects of MTR. Our MTR effect estimates will be conservative because we only incorporated acute losses of sport fish habitat via direct excavation of stream channels within MTR permitted areas. We did not account for ancillary MTR land-use activities that also eliminate stream habitat, but were not included in the map of permitted areas (Fig. 1), such as slurry impoundments, refuse piles, and valley fills (Bernhardt and Palmer 2011). Nor did we account for the chronic, downstream effects of MTR byproducts, such as selenium toxicity (Lindberg et al. 2011; U.S. Environmental Protection Agency 2011), or the legacy effects of previous mining activity, such as acid mine drainage (e.g., Herlihy et al. 1990; Bulger et al. 2000). These chronic influences can have severe effects on resident fishes. For example, rates of larval fish deformities in WV streams can be as high as 48 % in selenium enriched streams, while rates of deformities in reference streams are <2 % (West Virginia Department of Environmental Protection 2010). Unfortunately, the population-level effects of these individual deformities have not yet been documented, and so we were not able to include them in our analyses. Furthermore, we did not incorporate the indirect effects that MTR may have on tourism in general, such as limiting access to fishing sites via private property conflicts, or repelling tourists who are reluctant to visit visibly degraded landscapes (Stewart Burns 2005). This esthetic concern may be particularly important because Seneca and Davis (1976) have shown that fishing license sales in WV are directly related to the quality and quantity of locally available stream habitats. We therefore strongly caution readers that our assessments (‘MTR accounted for’ vs. ‘MTR not accounted for’ in Table 3) may grossly underestimate the true impacts of MTR.
Four other caveats of this study also warrant discussion. First, none of the parameters in the fish density model (average body mass, net primary production, terrestrial insect production, and competitor consumption; see Electronic Supplementary Material) were estimated using data from CRB streams. Rather, parameter estimates from comparable systems (e.g., Vance Run, WV and Guys Run, VA; see Table 2) were used because the necessary data were not yet available from CRB streams. These data were collected from streams with physico-chemical properties (e.g., stream width, gradient, and riparian habitat) that were similar to CRB streams, and therefore provided useful surrogates for our study. But confirming or refining the parameter estimates with data that were collected in CRB streams should be a priority in future research.
Second, the model predictions should be compared with and/or confirmed using outputs from traditional bioenergetics models. We used a self-thinning model to predict smallmouth bass and brook trout densities (D) because the method is relatively simple to implement and it is well-suited for regional applications (see McGarvey et al. 2010; McGarvey and Johnston 2011). Our results do, however, lack the precision and mechanistic understanding of bioenergetics models. For instance, Utz and Hartman (2009) estimated consumption and growth rates of individual brook trout with bioenergetics models, then used the results to explain seasonal variation in trout density and to identify exploitation competition as the mechanism driving density-dependence in Appalachian brook trout populations. We did not use bioenergetics models because large datasets are needed to build and calibrate them (i.e., repeated measures of multiple age-cohorts; Ney 1993). Nevertheless, our fish density and abundance predictions should be tested via comparisons with bioenergetics models before they are implemented in a regional fisheries management plan.
Third, the average body mass (M) estimates for smallmouth bass and brook trout were small: 104.4 g for bass and 29.3 g for trout (Table 2). These empirical M estimates were representative of the most common sizes or body masses of individual sport fishes in Central Appalachian streams and were therefore appropriate for use in our self-thinning model (Eq. 1). Furthermore, the small M estimates are relevant from a management perspective because minimum-size limits are not enforced for smallmouth bass or brook trout in most WV streams and rivers (West Virginia Department of Natural Resources 2012). But readers should be aware that the predicted fish densities and abundances are specific to relatively small individuals, and that numbers of large sport fishes in CRB streams will be less than the values presented here. Assuming that the empirical size-frequency distributions used to estimate average M values accurately represent the numbers of fishes that are larger than and smaller than the median size, one can approximate the potential densities of comparatively large fish by redistributing the predicted densities across the original size-frequency distributions. For example, Austen and Orth (1988) found that 3 % of the adult smallmouth bass within the New River, WV were ≥305 mm total length (the minimum harvestable length in Virginia), which is equivalent to M = 373 g (when length is converted to M using a standard length-weight regression; see Table 2). When this figure is applied to the model-predicted median density of smallmouth bass, we estimate that CRB streams can potentially support 3 bass ha−1 of this size.
Finally, we need a more rigorous method to predict the occurrence of brook trout habitat in CRB streams. We assumed in Scenario 1 that brook trout can inhabit 1st–4th order streams above 500 m elevation, noting that summer maximum temperatures remain below the upper limit for brook trout (~19–20 °C; Raleigh 1982; Martin and Petty 2009) in some southern WV, headwater streams located at similar or lower elevations (e.g., Wiley et al. 2001). This was a critical observation because water temperature is a key determinant of brook trout habitat quality (eastern brook trout rarely inhabit streams where maximum summer temperatures exceed 19–20 °C; see Raleigh 1982; Martin and Petty 2009), and water temperature normally decreases with elevation. Initially, we used the maximum stream temperature model of Martin and Petty (2009), which was calibrated for high elevation streams (average elevation = 728 m) in the Cheat River Basin, northern WV, to predict trout habitat within the CRB. But the model predictions were unrealistically low (e.g., maximum summer temperatures <12 °C) for many CRB streams. Recalibrating the model of Martin and Petty (2009) for use in the CRB, or developing an alternative method identify potential brook trout habitat, must therefore be a future priority.
Outlook
This study was motivated by the assumption that recreational anglers will choose to fish in CRB streams if sport fish abundances and/or densities are sufficiently high and if proper access and management policies are in place (see Seneca and Davis 1976; Fisher et al. 1998; Ditton et al. 2002). Tools that can be used to link the model-predicted sport fish abundances with estimates of sport fishery activity and revenue in the CRB are now needed. Fortunately, some of the information needed to accomplish this may already be available. For instance, Seneca and Davis (1976) showed that localized demand (i.e., within counties) for sport fishing opportunities in WV tracks the availability of quality fishing habitats. Fisher et al. (1998) summarized data on numbers of anglers, numbers of days fished, and per-trip expenditures for WV streams (see also Southwick Associates 2007). Boyle et al. (1998) calculated marginal per-fish values for bass and trout in WV (2.96 USD fish−1; 1996 data). And Rosenberger et al. (2005) studied anglers’ willingness to pay for trout fishing opportunities, via private stocking programs, in WV (29 USD angler−1 year−1; 2002 data).
Small to mid-sized streams are particularly valuable to West Virginia’s sport fishing industry because WV has fewer lakes and reservoirs than other states (Fisher et al. 1998). And as we have demonstrated here, these streams can potentially support tens- or hundreds-of-thousands of sport fishes in the CRB (Table 3), thereby creating opportunities to access the substantial economic benefits that sport fisheries can provide (Southwick Associates 2007). Unfortunately, small to mid-sized streams throughout southern WV are rapidly being degraded or eliminated by MTR (Bernhardt and Palmer 2011; U.S. Environmental Protection Agency 2011). We therefore advocate for land-use planning that incorporates recreational fisheries, and we encourage regional planners, regulators, and policy makers to carefully consider the abundance of sport fishes that may exist in southern WV streams.
Electronic supplementary material
Acknowledgments
The authors thank Craig Barber, John Van Sickle, and three anonymous reviewers for critical feedback on the manuscript. The trout and bass icons in Fig. 3 were obtained through the Integration and Application Network at the University of Maryland Center for Environmental Science. Daniel McGarvey was supported in part by an appointment to the Research Participation Program for the United States Oak Ridge Institute for Science and Education through an interagency agreement between the U.S. Department of Energy and the U.S. Environmental Protection Agency. This is VCU Rice Center Research Contribution No. 27. This manuscript is also a contribution to the U.S. Environmental Protection Agency, Office of Research and Development’s Ecosystem Services Research Program. It has been reviewed in accordance with the Agency’s peer and administrative review policies and approved for publication. Mention of trade names or commercial products does not constitute endorsement or recommendation for use.
Biographies
Daniel J. McGarvey
is an assistant professor of Environmental Studies at Virginia Commonwealth University in Richmond, Virginia. He is an aquatic ecologist who uses macroecological tools and environmental models to inform decisions in natural resource management.
John M. Johnston
is a supervisory ecologist at the Ecosystems Research Division of the U.S. Environmental Protection Agency in Athens, Georgia. He is a systems-level, ecological modeler who studies the delivery and regulation of ecosystem services.
Contributor Information
Daniel J. McGarvey, Phone: 1+804-828-7278, FAX: 1+804-828-1622, Email: djmcgarvey@vcu.edu
John M. Johnston, Phone: 1+706-355-8300, Email: johnston.johnm@epa.gov
References
- Austen DJ, Orth DJ. Evaluation of a 305-mm minimum-length limit for smallmouth bass in the New River, Virginia and West Virginia. North American Journal of Fisheries Management. 1988;8:231–239. doi: 10.1577/1548-8675(1988)008<0231:EOAMML>2.3.CO;2. [DOI] [Google Scholar]
- Baller M, Pantilat LJ. Defenders of Appalachia: The campaign to eliminate mountaintop removal coal mining and the role of public justice. Environmental Law. 2007;37:629–666. [Google Scholar]
- Bernhardt ES, Palmer MA. The environmental costs of mountaintop mining valley fill operations for aquatic ecosystems of the Central Appalachians. Annals of the New York Academy of Sciences. 2011;1223:39–57. doi: 10.1111/j.1749-6632.2011.05986.x. [DOI] [PubMed] [Google Scholar]
- Boyle, K.J., B. Roach, and D.G. Waddington. 1998. 1996 net economic values for bass, trout, and walleye fishing, deer, elk and moose hunting, and wildlife watching: Addendum to the 1996 National Survey of Fishing, Hunting and Wildlife-Associated Recreation. United States Fish and Wildlife Service, Report 96-2, Washington, DC, 36 pp. Retrieved October 27, 2011, from http://wsfrprograms.fws.gov/Subpages/NationalSurvey/rpt_96-2.pdf.
- Bulger AJ, Cosby BJ, Webb JR. Current, reconstructed past, and projected future status of brook trout (Salvelinus fontinalis) streams in Virginia. Canadian Journal of Fisheries and Aquatic Sciences. 2000;57:1515–1523. doi: 10.1139/f00-086. [DOI] [Google Scholar]
- Carlander KD. Handbook of freshwater fishery biology. Ames: Iowa State University Press; 1969. [Google Scholar]
- Carlander KD. Handbook of freshwater fishery biology. Ames: Iowa State University Press; 1977. [Google Scholar]
- Carline RE, McCullough BJ. Effects of floods on brook trout populations in the Monongahela National Forest, West Virginia. Transactions of the American Fisheries Society. 2003;132:1014–1020. doi: 10.1577/T02-112. [DOI] [Google Scholar]
- Clingerman, J.W. 2008. Statewide analysis of brook trout (Salvelinus fontinalis) population status and reach-scale conservation priorities in West Virginia watersheds. MS Thesis. Morgantown, WV: West Virginia University. Retrieved October 27, 2011, from http://wvuscholar.wvu.edu:8881/R/85IGI5MMHBQ3S9UBPD21F837FN2IXFK2N87S5QN3CA78A5J7CJ-00094?func=results-jump-full&set_entry=000007&set_number=000036&base=GEN01-WVU01.
- Cloe WW, Garman GC. The energetic importance of terrestrial arthropod inputs to three warm-water streams. Freshwater Biology. 1996;36:105–114. [Google Scholar]
- Dauwalter DC, Splinter DK, Fisher WL, Marston RA. Geomorphology and stream habitat relationships with smallmouth bass (Micropterus dolomieu) abundance at multiple spatial scales in eastern Oklahoma. Canadian Journal of Fisheries and Aquatic Sciences. 2007;64:1116–1129. doi: 10.1139/f07-085. [DOI] [Google Scholar]
- Ditton RB, Holland SM, Anderson DK. Recreational fishing as tourism. Fisheries. 2002;27:17–24. doi: 10.1577/1548-8446(2002)027<0017:RFAT>2.0.CO;2. [DOI] [Google Scholar]
- Dunham JB, Vinyard GL. Relationships between body mass, population density, and the self-thinning rule in stream-living salmonids. Canadian Journal of Fisheries and Aquatic Sciences. 1997;54:1025–1030. doi: 10.1139/f97-012. [DOI] [Google Scholar]
- Energy Information Administration. 2010. Annual coal report 2008. United States Energy Information Administration, DOE/EIA-0584 (2008), Washington, DC, 77 pp. Retrieved October 27, 2011, from http://www.eia.doe.gov/cneaf/coal/page/acr/acr.pdf.
- Fisher WL, Surmont AF, Martin CD. Warmwater stream and river fisheries in the Southeastern United States: Are we managing them in proportion to their values? Fisheries. 1998;23:16–24. doi: 10.1577/1548-8446(1998)023<0016:WSARFI>2.0.CO;2. [DOI] [Google Scholar]
- Goldsborough, E.L., and H.W. Clark. 1908. Fishes of West Virginia. United States Bureau of Fisheries Bulletin 27: 29–39. Retrieved October 27, 2011, from http://fishbull.noaa.gov/27-1/goldsborough.pdf.
- Grant JWA. Self-thinning in stream-dwelling salmonids. Canadian Special Publication of Fisheries and Aquatic Sciences. 1993;118:99–102. [Google Scholar]
- Herlihy A, Kaufmann P, Mitch M, Brown D. Regional estimates of acid mine drainage impact on streams in the Mid-Atlantic and Southeastern United States. Water, Air, and Soil pollution. 1990;50:91–107. doi: 10.1007/BF00284786. [DOI] [Google Scholar]
- Hornick LE, Webster JR, Benfield EF. Periphyton production in an Appalachian mountain trout stream. American Midland Naturalist. 1981;106:22–36. doi: 10.2307/2425132. [DOI] [Google Scholar]
- Hudy M, Downey DM, Bowman DW. Successful restoration of an acidified native brook trout stream through mitigation with limestone sand. North American Journal of Fisheries Management. 2000;20:453–466. doi: 10.1577/1548-8675(2000)020<0453:SROAAN>2.3.CO;2. [DOI] [Google Scholar]
- Hudy M, Thieling TM, Gillespie N, Smith EP. Distribution, status, and land use characteristics of subwatersheds within the native range of brook trout in the eastern United States. North American Journal of Fisheries Management. 2008;28:1069–1085. doi: 10.1577/M07-017.1. [DOI] [Google Scholar]
- Hunter CJ. Better trout habitat: A guide to stream restoration and management. Washington, DC: Island Press; 1991. [Google Scholar]
- Lindberg TT, Bernhardt ES, Bier R, Helton AM, Merola RB, Vengosh A, Di Giulio RT. Cumulative impacts of mountaintop mining on an Appalachian watershed. Proceedings of the National Academy of the Sciences of United States of America. 2011;108:20929–20934. doi: 10.1073/pnas.1112381108. [DOI] [PMC free article] [PubMed] [Google Scholar]
- Marquet PA, Quinones RA, Abades S, Labra F, Tognelli M, Arim M, Rivadeneira M. Scaling and power-laws in ecological systems. Journal of Experimental Biology. 2005;208:1749–1769. doi: 10.1242/jeb.01588. [DOI] [PubMed] [Google Scholar]
- Martin RW, Petty JT. Local stream temperature and drainage network topology interact to influence the distribution of smallmouth bass and brook trout in a Central Appalachian watershed. Journal of Freshwater Ecology. 2009;24:497–508. doi: 10.1080/02705060.2009.9664323. [DOI] [Google Scholar]
- McGarvey DJ, Johnston JM. A simple method to predict regional fish abundance: An example in the McKenzie River Basin, Oregon. Fisheries. 2011;36:534–546. doi: 10.1080/03632415.2011.626659. [DOI] [Google Scholar]
- McGarvey DJ, Johnston JM, Barber MC. Predicting fish densities in lotic systems: A simple modeling approach. Journal of the North American Benthological Society. 2010;29:1212–1227. doi: 10.1899/09-094.1. [DOI] [Google Scholar]
- McIlmoil, R., and E. Hansen. 2009. The decline of central Appalachian coal and the need for economic diversification. Downstream Strategies, Morgantown, WV, 42 pp. Retrieved October 27, 2011, from http://static.cnhi.zope.net/flashpromo/dailyindependent/flashpromo/news_pdfs/DownstreamStrategies-DeclineOfCentralAppalachianCoal.pdf.
- McIntosh A. Mid-Atlantic budget angler: Fly-fishing for trout in Delaware, Maryland, New Jersey, Pennsylvania, Virginia, West Virginia. Mechanicsburg, PA: Stackpole Books; 1998. [Google Scholar]
- Neves RJ, Pardue GB. Abundance and production of fishes in a small Appalachian stream. Transactions of the American Fisheries Society. 1983;112:21–26. doi: 10.1577/1548-8659(1983)112<21:AAPOFI>2.0.CO;2. [DOI] [Google Scholar]
- Ney JJ. Bioenergetics modeling today—Growing pains on the cutting edge. Transactions of the American Fisheries Society. 1993;122:736–748. doi: 10.1577/1548-8659(1993)122<0736:BMTGPO>2.3.CO;2. [DOI] [Google Scholar]
- Odenkirk J, Smith S. Single-versus multiple-pass boat electrofishing for assessing smallmouth bass populations in Virginia rivers. North American Journal of Fisheries Management. 2005;25:717–724. doi: 10.1577/M04-067.1. [DOI] [Google Scholar]
- Phillips J. Impacts of surface mine valley fills on headwater floods in eastern Kentucky. Environmental Geology. 2004;45:367–380. doi: 10.1007/s00254-003-0883-1. [DOI] [Google Scholar]
- Raleigh, R.F. 1982. Habitat suitability index models: Brook trout. United States Department of Interior, Fish and Wildlife Service, FWS/OBS-82/10.24, Fort Collins, Colorado, 42 pp. Retrieved October 27, 2011, from http://el.erdc.usace.army.mil/emrrp/emris/EMRIS_PDF/BrookTrout.pdf.
- Randall RG, Kelso JRM, Minns CK. Fish production in freshwaters: Are rivers more productive than lakes? Canadian Journal of Fisheries and Aquatic Sciences. 1995;52:631–643. doi: 10.1139/f95-063. [DOI] [Google Scholar]
- Roell MJ, Orth DJ. Trophic basis of production of stream-dwelling smallmouth bass, rock bass, and flathead catfish in relation to invertebrate bait harvest. Transactions of the American Fisheries Society. 1993;122:46–62. doi: 10.1577/1548-8659(1993)122<0046:TBOPOS>2.3.CO;2. [DOI] [Google Scholar]
- Rosenberger RS, Collins AR, Svetlik JB. Private provision of a public good: Willingness to pay for privately stocked trout. Society and Natural Resources. 2005;18:75–87. [Google Scholar]
- Seneca JJ, Davis RK. A cross section analysis of state recreation activity. Journal of Leisure Research. 1976;8:88–97. [Google Scholar]
- Southwick Associates. 2007. Sportfishing in America: An economic engine and conservation powerhouse. American Sportfishing Association, Alexandria, Virginia, 12 pp. Retrieved October 27, 2011, from http://www.asafishing.org/images/statistics/resources/SIA_2008.pdf.
- Stauffer JR, Jr, Boltz JM, White LR. The fishes of West Virginia. The Proceedings of the Academy of Natural Sciences of Philadelphia. 1995;146:1–389. [Google Scholar]
- Stewart Burns, S.L. 2005. Bringing down the mountains: The impact of mountaintop removal surface coal mining on southern West Virginia communities, 1970–2004. PhD Thesis. Morgantown, WV: West Virginia University. Retrieved October 27, 2011, from https://eidr.wvu.edu/etd/documentdata.eTD?documentid=4047.
- Strahler AN. Quantitative analysis of watershed geomorphology. Transactions of the American Geophysical Union. 1957;38:913–920. doi: 10.1029/TR038i006p00913. [DOI] [Google Scholar]
- U.S. Environmental Protection Agency. 2011. The effects of mountaintop mines and valley fills on aquatic ecosystems of the Central Appalachian coalfields. Office of Research and Development, National Center for Environmental Analysis, EPA/600/R-09/138F, Washington, DC, 137 pp. Retrieved October 27, 2011, from http://cfpub.epa.gov/ncea/cfm/recordisplay.cfm?deid=225743.
- U.S. National Elevation Dataset. 2011. Retrieved February 19, 2011, from http://ned.usgs.gov/.
- U.S. National Hydrography Dataset. 2011. Retrieved February 11, 2011, from http://nhd.usgs.gov/.
- Utz RM, Hartman KJ. Density-dependent individual growth and size dynamics of central Appalachian brook trout (Salvelinus fontinalis) Canadian Journal of Fisheries and Aquatic Sciences. 2009;66:1072–1080. doi: 10.1139/F09-063. [DOI] [Google Scholar]
- West Virginia Department of Environmental Protection. 1997. An ecological assessment of the Coal River Watershed. West Virginia Department of Environmental Protection, Division of Water Resources, Report 05050009, Charleston, WV, 93 pp. Retrieved October 27, 2011, from http://www.dep.wv.gov/WWE/watershed/wqmonitoring/Pages/EcologicalAssessments.aspx.
- West Virginia Department of Environmental Protection. 2010. Selenium-induced developmental effects among fishes in select West Virginia waters. West Virginia Department of Environmental Protection, Charleston, WV, 55 pp. Retrieved June 15, 2012, from http://www.dep.wv.gov/WWE/watershed/wqmonitoring/Documents/Selenium/Se%20Larvae%202010%20final.pdf.
- West Virginia Department of Environmental Protection, Division of Mining and Reclamation. 2011. Retrieved September 27, 2011, from http://gis.dep.wv.gov/data/omr.html.
- West Virginia Department of Natural Resources. 2012. Fishing: 2012 regulations summary. West Virginia Department of Natural Resources, South Charleston, WV, 28 pp. Retrieved June 15, 2012, from www.wvdnr.gov/fishing/Fishing_regs.shtm.
- Wiley, J.B., R.D. Evaldi, J.H. Eychaner, and D.B. Chambers. 2001. Reconnaissance of stream geomorphology, low streamflow, and stream temperature in the mountaintop coal-mining region, southern West Virginia, 1999–2000. U.S. Geological Survey, Water-Resources Investigations Report 01-4092, Charleston, WV, 38 pp. Retrieved October 27, 2011, from http://pubs.usgs.gov/wri/wri014092/.
Associated Data
This section collects any data citations, data availability statements, or supplementary materials included in this article.