Abstract
Hyperglycemia-induced endothelial dysfunction is characterized by enhanced inflammatory cytokine and adhesion molecule expression, and endothelial-monocyte adhesion. The adapter molecule CIKS (connection to IKK and SAPK/JNK; also known as Act1 or TRAF3IP2) mediates NF-κB and AP-1 activation, and plays a role in inflammation and injury. Here we show that high glucose- (HG; 25 mM vs. 5 mM D-glucose)-induced endothelial-monocyte adhesion and inhibition of endothelial cell (EC) migration were both reversed by CIKS knockdown. In EC, HG induced CIKS mRNA and protein expression via DPI-inhibitable Nox4-dependent ROS generation. Further, HG induced CIKS transcription and enhanced CIKS promoter-dependent reporter gene activation via Nox4, ROS, AP-1 and C/EBP. Coimmunoprecipitation and immunoblotting revealed CIKS/IKKβ/JNK physical association under basal conditions that was enhanced by HG treatment. Importantly, CIKS knockdown inhibited HG-induced (i) IKKβ and JNK phosphorylation, (ii) p65 and c-Jun nuclear translocation, (iii) NF-κB- and AP-1-dependent proinflammatory cytokine, chemokine, and adhesion molecule expression. Similar to HG, the deleterious metabolic products of chronic hyperglycemia, AGE-HSA, AOPPs-HSA and oxLDL, also induced CIKS-dependent endothelial dysfunction. Notably, aortas from streptozotocin-induced and the autoimmune type 1 diabetic NOD and Akita mice showed enhanced DPI-inhibitable ROS generation and CIKS expression. Since CIKS mediates high glucose-induced NF-κB and AP-1-dependent inflammatory signaling and endothelial dysfunction, targeting CIKS may delay progression of vascular diseases during diabetes mellitus and atherosclerosis.
Keywords: hyperglycemia, oxidative stress, TRAF3IP2, Act1, endothelial dysfunction
INTRODUCTION
Diabetes mellitus (DM) is characterized by chronic hyperglycemia with impaired secretion of insulin, insulin action or a combination of both, and is often associated with the development of vascular failure [1]. Chronic hyperglycemia activates the polyol pathway, increases the formation of advanced glycation end products (AGEs), advanced oxidation protein products (AOPPs), and oxidatively-modified, LDL (oxLDL), and stimulates anti-oxLDL antibody generation [2-5]. High glucose (HG), AGEs and oxLDL all contribute to robust activation of oxidative stress, and increase the expression and secretion of various adhesion molecules including intercellular adhesion molecule (ICAM)-1 and vascular adhesion molecule (VCAM)-1. Both ICAM-1 and VCAM-1 serve as ligands for integrins on activated monocytes, promoting firm adhesion of monocytes to endothelial cells, monocyte rolling and migration into sub-endothelial matrix, and the development and progression of vascular diseases, including atherosclerosis [3, 6].
Both ICAM-1 and VCAM-1 are transcriptionally regulated by the ubiquitously expressed oxidative stress-responsive transcription factors nuclear factor (NF)-κB and activator protein (AP)-1 [7]. Addition of an SOD mimetic inhibited TNF-α-induced NF-κB and AP-1 activation, and ICAM-1 and VCAM-1 expression in human aortic endothelial cells[8]. Further, inhibition of NF-κB attenuated IL-18-induced ICAM-1 and VCAM-1 expression on human dermal microvascular endothelial cells [9]. Conversely, forced expression of constitutively active IKKβ in the absence of other proinflammatory stimuli has been shown to induce ICAM-1 and VCAM-1 expression in endothelial cells [10]. Similarly, AP-1 has been shown to play an equally critical role in adhesion molecules expression. For example, IL-1β has been shown to induce ICAM-1 and VCAM-1 in mouse Sertoli cells via c-Jun amino terminal kinase (JNK) activation [11]. Moreover, IL-1β induces ICAM-1 expression in 549 cells via JNK and NF-κB [12] and AP-1 in endothelial cells [13], emphasizing the critical roles of NF-κB and AP-1 in adhesion molecule expression.
In the resting cell, NF-κB is localized to the cytoplasm complexed with inhibitory κB (IκB) proteins, thus remaining inactive [14]. Activation of NF-κB requires phosphorylation of IκB on specific serine residues by the IκB kinase (IKK) complex and subsequent proteasome-dependent degradation. The multi-component IKK complex is comprised of two kinases IKKα and IKKβ, and a regulatory subunit IKKγ [14]. The transcriptional activity of AP-1 is regulated by JNK, a member of the mitogen activated protein kinase family. The AP-1 family comprises of Jun, Fos, and activating transcription factor (ATF) [15]. By homo or heterodimerizing with other members of their family, NF-κB and AP-1 induce ICAM-1 and VCAM-1 expression. Of note, a crosstalk between AP-1 and NF-κB subunits has been reported in ICAM1 transcription [16].
Recently, the novel adaptor protein CIKS (connection to IκB kinase and stress-activated protein kinase/c-Jun N-terminal kinase) was identified, and shown to play an important role in the activation of NF-κB and JNK signaling [17]. CIKS is also known as NF-κB activator 1 (Act1) and TRAF3-interacting protein 2 (TRAF3IP2) [18]. As its name implies, CIKS lies upstream of IKK and JNK, and activates IKK/NF-κB and JNK/AP-1-dependent signaling [17]. Its critical role in interleukin (IL)-17 mediated autoimmune and inflammatory signaling has been extensively described. In autoimmune encephalomyelitis, astrocyte specific deletion of CIKS inhibited proinflammatory cytokine and adhesion molecule expression, and attenuated disease progression [19]. CIKS deficient mice exhibited less severe allergic airway inflammation, pulmonary inflammation, and dextran sodium sulfate-induced colitis, suggesting a causal role for CIKS in autoimmune and inflammatory disorders [20-22]. Furthermore, the recent demonstration that human pancreatic islet cells express TRAF3IP2 (CIKS), and this expression is enhanced by inflammatory cytokines, raises the intriguing possibility that CIKS may be involved in the pathogenesis of type 1 diabetes [23]. However, the role of CIKS in endothelial dysfunction, a hallmark of DM and atherosclerosis, is not known.
In the current study, we investigated the effects of HG on CIKS expression and determined its role in NF-κB and AP-1 activation, ICAM-1 and VCAM-1 expression, and endothelial-monocyte adhesion and endothelial migration in vitro. Further, we also investigated the effects of AGE-HSA, oxLDL and AOPPs-HSA on CIKS expression in vitro. Finally, CIKS levels were analyzed in vivo in the aortas of three different type 1 diabetic animal models. Our results show for the first time that CIKS is a critical mediator of HG-induced endothelial dysfunction. HG-induced IKK and JNK phosphorylation, NF-κB and AP-1 activation, and cytokine and adhesion molecule expression were markedly attenuated by CIKS knockdown. Interestingly, HG also enhanced CIKS nuclear translocation. Further, CIKS knockdown inhibited HG-suppressed endothelial cell migration. Notably, CIKS expression was markedly increased in the aortas of NOD, Akita and streptozotocin-induced type 1 diabetic mice. Thus targeting CIKS may have a protective effect in the pathogenesis of vascular diseases by ameliorating the endothelial cell dysfunction resulting from diabetes mellitus and excessive oxidative stress.
Materials and methods
Materials
The materials used are detailed in the Supplementary methods section.
Animals
The investigations conform to the Guide for the Care and Use of Laboratory Animals, published by the National Institutes of Health, and all protocols were approved by the Institutional Animal Care and Use Committees at Tulane University in New Orleans, LA and the University of Texas Health Sciences Center in San Antonio, TX. All animals were housed in temperature (22°C) and light-controlled (12 h light and 12 h dark) atmosphere with ad libitum access to water and food. To induce type 1 diabetes, 10 week-old male C57Bl/6 mice (Charles River Laboratories International, Wilmington, MA; n=4/group) were administered once daily for 4 days with streptozotocin in sodium citrate buffer (pH 4.5; IP, 60 mg/kg bodyweight). The control group received sodium citrate buffer alone. Blood glucose levels were quantified at 3, 5, 10, and 17 days post-STZ and animals euthanized. Type 1 diabetes prone male Akita mice on C57Bl/6 background (Stock # 003548) and control C57Bl/6 mice (Stock #000664) were purchased from the Jackson Laboratories. Akita mice develop hyperglycemia as a consequence of a single base pair substitution in the Ins2 gene, resulting in improper folding of proinsulin, aggregation in endoplasmic reticulum (ER), ER stress, and loss of β-cells of islets of Langerhans. Akita mice develop severe hyperglycemia as early as 5–6 weeks of age. Akita mice were sacrificed at 10 weeks of age. Type 1 diabetes-prone female Non-Obese Diabetic (NOD) mice (NOD/ShiLtJ, Stock# 001976) and insulitis-resistant diabetes-free NOR/LtJ control mice (Stock# 002050) were purchased from the Jackson Laboratories (Bar Harbor, ME). At 18 weeks of age, animals were euthanized. Blood glucose levels were monitored using Contour glucometer (Bayer Healthcare, Misawaka, IN). Aortas were collected, snap frozen, and stored at -80°C for not more than 3 days prior to protein and mRNA extraction.
Cell Culture
Clonetics® human aortic endothelial cells (HAEC, #CC-2535; Lonza) were cultured at 37°C in endothelial basal medium-2 (EBM-2, #CC-3156) supplemented with EGM-2 SingleQuots (Lonza, #CC-4176). THP-1 cells (Human acute monocytic leukemia cell line) were purchased from American Type Culture Collection (ATCC, Manassas, VA) and maintained in RPMI 1640 medium containing 10% heat inactivated fetal bovine serum and 0.05 mM 2-mercaptoethanol. HAEC were used between passages 4 to 8. At 60%-70% confluency the medium was changed to EBM-2 (without supplements) containing 25 mM D-glucose for the indicated time periods. Cells incubated with 5 mM D-glucose + 20 mM D-mannitol or 25 mM L-glucose served as controls.
Preparation of AGE-HSA and AOPPs-HSA
AGE-HSA was prepared as previously described [24] by exposing fatty acid and globulin-free HSA to 1M D-glucose in 100 mM sodium phosphate buffer (pH 7.4) containing, 200 U/mL of penicillin, 200 μg/mL streptomycin, 80 μg/mL of gentamycin, and 1.5 mM of PMSF at 37°C in the dark for 60 days, and dialyzed for 16 h against PBS. As a control, HSA was subjected to the same procedure, but without exposure to D-glucose. Fluorescence was measured at excitation/emission wavelengths of 370/440 nm in a spectrofluorophotometer, and the concentrations of AGE-HSA and HSA were determined by the method of Bradford. AOPPs-HSA was prepared as previously described [25] by exposing fatty acid and globulin-free HSA to HOCl/PBS for 30 minutes at room temperature and dialyzed for 16 h against PBS. AOPPs concentration was measured spectrophotometrically. HSA, AGE-HSA, and AOPPs-HSA were each used at 100 μg/ml. The preparations contained less than 0.02 EU/mL of endotoxin as determined by the QCL-1000™Endpoint chromogenic Limulus amoebocyte lysate assay.
Adenoviral vectors and lentiviral shRNA particles
Recombinant, replication-deficient adenoviral vectors expressing Nox4 (Ad.siNox4) or eGFP (Ad.siGFP) siRNA were obtained from the University of Iowa Gene Vector Core (Iowa City, Iowa) after permission from Robin L. Davisson [26]. At 70-80% confluency, HAEC were infected at ambient temperature with adenoviruses in PBS at the indicated multiplicity of infection (MOI). After 1 h, the adenovirus was replaced with culture medium. Assays were carried out 24 h later. At 50% confluency, HAEC were infected with lentiviral particles in complete medium for 48 hrs. Lentiviral particles generally contain three to five expression constructs each encoding target-specific 19-25 nt (plus hairpin) shRNA designed to knockdown gene expression. The shRNA sequences are included in Supplementary Table 1. To increase infection efficiency, cells were co-treated with the cationic polymer Polybrene® (5 μg/ml in water; sc-134220). Neither shRNA nor Polybrene affected cell viability. The siRNA and shRNA had no off-target effects, and at the indicated MOI and duration, failed to modulate HAEC adherence, shape and viability (trypan blue-dye exclusion; data not shown).
Endothelial-monocyte adhesion assay
Endothelial-monocyte adhesion was analyzed by the Vybrant Cell Adhesion assay kit. In brief, HAEC were plated in a 24-well flat-bottomed plate. At 70 to 80% confluency the complete medium was replaced with EBM-2 containing 25 mM D-glucose for 12 hours. THP-1 cells were labeled with 5 μM Calcein AM in serum-free RPMI 1640 for 30 minutes at 37° C, washed twice with pre-warmed RPMI 1640, and resuspended in the same medium. The labeled cells (5 × 10⁴ cells) were then added to HAEC and incubated for 1 hr at 37° C. The non-adherent cells were removed carefully and the cell layer washed three times with ice-cold PBS. Finally 200 μl of PBS were added to each well. Endothelial-monocyte adhesion was quantitated by measuring fluorescence at excitation and emission wavelengths of 485 and 535 nm, respectively, using BioTek Fluorimeter. Wells containing HAEC without THP-1 cells served as blanks.
Wound-healing (migration) assay
HAEC were plated at 70,000 cells/well in a 12-well plate. At ~80% confluency, the cells were scratched once using a sterile 1 ml pipette tip, washed twice with complete medium to remove floating cells and cell components. High glucose (25 mM D-glucose) was then added in complete medium, and the incubation continued at 37°C. Photographs were taken at 0 and 24 hrs after the addition of 25 mM D-glucose. To demonstrate the role of CIKS in HG-delayed migration, we transduced HAEC with 0.5 MOI (multiplicity of infection) of CIKS-specific lentiviral shRNA particles. After 48 hours of infection, cells were scratched and incubated with HG as described above. Photographs were taken at 50X magnification using a Leica inverted phase contrast microscope (model # DM IRB). The width of the gap after 24 h was measured and subtracted from that at 0 h to quantify the distance the cells migrated. The experiments were repeated at least three times with similar results.
CIKS promoter-reporter vectors and site-directed mutagenesis
A 200-bp fragment of the 5′-flanking region of the human CIKS gene described previously [27] was amplified from human genomic DNA using the primers listed in supplementary Table 2. The sense primer contained an MluI restriction site (ACGCGT) at the 5′-end (lowercase). The antisense primer contained an XhoI restriction site (CTCGAG). The PCR product was cloned into pCR2.1-TOPO, subcloned into the pGL3-Basic reporter vector, and sequence confirmed. Mutations in the potential IRF-1, C/EBP, or AP-1 sites or all three were performed by site-directed mutagenesis. pGL3-Basic served as a vector control. HAEC were transfected with the indicated promoter reporter vector (3 μg) and 100 ng of the control Renilla luciferase vector pRL-TK using the Neon transfection system (MPK-5000, Invitrogen) with the following parameters: pulse voltage: 1400 volts, pulse width: 20 ms, pulse number: 2, and the tip type: 10 μl. Cell viability was 92%, and the transfection efficiency was 71%. Cells were harvested at the indicated time period for the dual luciferase reporter assay. Data were normalized by dividing firefly luciferase activity with that of the corresponding Renilla luciferase. All plasmid preparations were endotoxin-free.
RT-PCR and RT-qPCR
Total RNA was isolated using the TRIzol method. One microgram of RNA was used for the first strand cDNA synthesis using Quantitect cDNA synthesis kit. Nox1, Nox2 and Nox4 mRNA expression was analyzed by RT-PCR. The primers are detailed in Supplementary Table 3. CIKS, cytokine, chemokine and adhesion molecule expression was analyzed by RT-qPCR using TaqMan® probes and Eppendorf Realplex4 system. Data are shown as fold change (2-ΔΔCt).
Nuclear extraction
At 70-80 % confluency, HAEC were incubated with 25 mM D-glucose, and harvested using ice-cold phosphate buffered saline. The nuclear and cytoplasmic fractions were separated using the NE-PER nuclear extraction kit according to the manufacturer's instructions. Protein levels were quantified using the Bradford method. Purity of preparations was confirmed by immunoblotting for GAPDH (cytoplasmic) and Lamin B (nuclear).
Cell lysis, immunoprecipitation and immunoblotting
Extraction of protein homogenates, immunoprecipitation, and immunoblotting are all previously described [28, 29].
Detection of intracellular ROS
In whole cells
Intracellular ROS levels following HG treatment were determined as previously described using the cell-permeable, redox-sensitive fluorophore, 2′,7′-dichlorofluorescein diacetate (DCFH-DA) [28]. In addition, ROS generation was also quantified using the lucigenin-enhanced chemiluminescence assay as recently reported by us [29].
In aortic homogenates
ROS generation was measured by lucigenin-enhanced chemiluminescence using aortic homogenates (100 μg/sample) in a reaction mixture containing 100 μM NADPH [29]. Studies were also performed using 5-day post-STZ aortic homogenates treated with DPI.
Statistical analysis
GraphPad Prism 5 software was used for statistical analysis. The significance of the data was determined by ANOVA followed by Student-Newman-Keuls.
Results
CIKS knockdown significantly reduces high glucose-induced endothelial-monocyte adhesion and endothelial cell migration inhibition
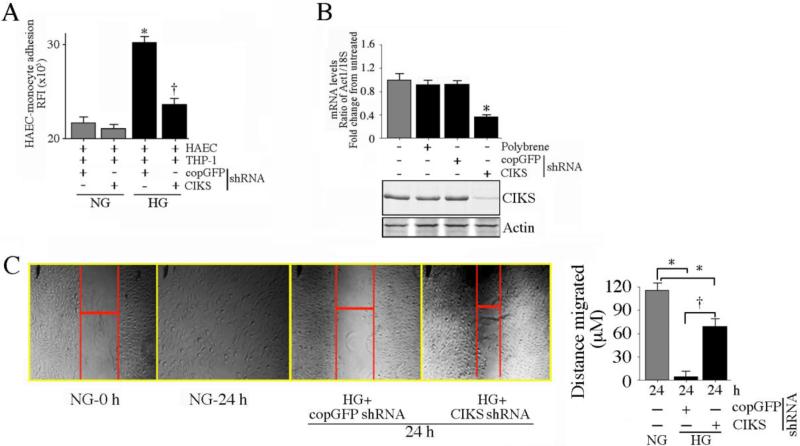
Diabetic patients show increased susceptibility to atherosclerosis and other chronic inflammatory disorders. The initial step in atherogenesis under hyperglycemic conditions is the enhanced expression of adhesion molecules ICAM-1 and VCAM-1 on endothelial cells, increased adhesion of monocytes to endothelial cells, and monocyte transmigration into the sub-endothelial space. Both ICAM-1 and VCAM-1 are NF-κB and AP-1 responsive genes. Since the adapter molecule CIKS is upstream of IKK and JNK [17, 18], we investigated whether CIKS plays a role in HG-enhanced endothelial-monocyte adhesion. Under basal conditions of 5 mM D-glucose + 20 mM mannitol (NG), THP-1 monocytic cells adhered to unstimulated HAEC. However, pre-treatment of the HAEC with HG (25 mM D-glucose) significantly increased THP-1 adhesion (Fig. 1A). Treatment with 25 mM L-glucose on the other hand had no effect (data not shown). Knockdown of CIKS in the endothelial cells using lentiviral shRNA markedly attenuated THP-1 adhesion under HG conditions, indicting a major role for CIKS in adhesion molecule expression. Knockdown of CIKS was confirmed by RT-qPCR and immunoblotting (Fig. 1B). Since chronic hyperglycemia delays angiogenesis and wound healing in vivo, we next investigated whether HG-suppressed endothelial cell migration is CIKS-dependent. In wound-healing assays in vitro, HG markedly attenuated HAEC migration, and this effect was significantly reduced by CIKS knockdown (Fig. 1C; results from three independent experiments are summarized on the right). Thus CIKS mediates HG-induced endothelial-monocyte adhesion and suppression of endothelial cell migration (Fig. 1).
Fig. 1. CIKS mediates high glucose-induced endothelial-monocyte adhesion and suppression of HAEC migration.
Primary human aortic endothelial cells (HAEC) at 50% confluency were infected with lentiviral particles expressing CIKS shRNA (MOI 0.5) for 48 hrs, treated with HG (25 mM) for 12 h, then incubated for 1 h with Calcein AM-loaded THP-1 cells. Endothelial-monocyte adhesion was quantified by measuring fluorescence at excitation and emission wavelengths of 485 and 535 nm. Wells containing HAEC without THP-1 cells served as blanks. *P < 0.001 vs. normal glucose (NG)-treated shRNA-infected cells (n=12), †P < 0.05 vs. HG + copGFP. B, CIKS knockdown in HAEC was confirmed by RT-qPCR (upper panel; n=6) and immunoblotting (lower panel; n=3). *P < 0.01 vs. copGFP. C, CIKS knockdown reverses HG-induced suppression of HAEC migration. HAEC were plated at 70,000 cells/well in a 12-well plate, infected with lentiviral CIKS shRNA (MOI 0.5 for 48 h), and scratched once with a sterile 1 ml pipette tip. The cells were then washed twice with complete media, incubated with HG for an additional 24 h, and photographed at 50X magnification. The width of the gap after 24 h was measured and subtracted from that at 0 h to quantify the distance the cells migrated (representative photomicrographs are shown). The experiments were repeated three times, and the results are summarized on the right. *P < at least 0.05 vs. NG, †P < 0.05 vs. HG + copGFP (n=3).
High glucose induces CIKS expression in HAEC
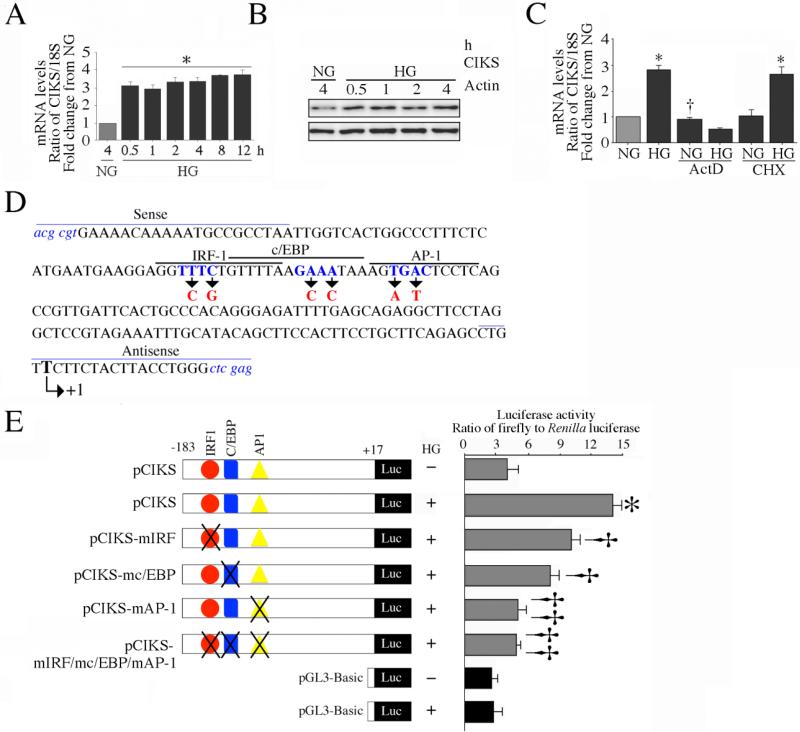
Since CIKS knockdown blunted enhanced monocyte-endothelial adhesion under HG conditions (Fig. 1), we next investigated whether HG regulates CIKS expression in HAEC. Incubation with HG markedly increased CIKS mRNA expression at 30 min, and the levels remained elevated even after 12 h (Fig. 2A). Similarly, HG increased CIKS protein expression in a time dependent manner (Fig. 2B). To investigate the mechanism of HG-induced CIKS mRNA expression, HAEC were treated with actinomycin D (ActD) or cycloheximide (CHX) before HG addition. Pretreatment with ActD completely abolished HG-induced CIKS mRNA expression, indicating that HG-induced CIKS is transcriptionally regulated (Fig. 2C). Further, CHX failed to inhibit HG-induced CIKS mRNA expression, indicating that new protein synthesis is not required for HG-induced CIKS transcription (Fig. 2C). Since HG up-regulated CIKS expression via enhanced transcription, we next determined whether HG induces CIKS promoter activity. HAEC were transiently transfected with CIKS proximal promoter-reporter construct (Fig. 2D). HG significantly increased CIKS promoter activity, an effect moderately attenuated by mutations in the potential IRF1 and C/EBP sites (Fig 2E). However, mutation of the AP-1 site alone reduced reporter activity to almost basal levels, as did mutation of all three elements (Fig. 2E). Together, these results indicate that HG induces CIKS expression via enhanced transcription that is dependent on AP-1 (Fig. 2).
Fig. 2. High glucose enhances CIKS expression via increased transcription.
A, HG induces CIKS mRNA expression. At 70% confluency, the complete medium was replaced with EBM-2 (without supplements) for 2h, and then incubated for the indicated time periods in the presence of 25 mM D-glucose. CIKS mRNA was analyzed by RT-qPCR, and 18S served as an invariant control. *P < at least 0.01 vs. NG (n=6). B, HG induces CIKS protein expression. HAEC treated as in A were analyzed for CIKS protein expression by immunoblotting. Actin served as a loading control (n=3). C, HG induces CIKS expression via increased transcription. HAEC were treated with HG with actinomycin D (ActD) or cycloheximide (CHX) for 30 min, and analyzed for CIKS mRNA expression by RT-qPCR. *P < at least 0.01, †P < 0.01 vs. NG (n=6). D, E, HG stimulates CIKS promoter-dependent reporter gene activation via IRF, c/EBP and AP-1. HAEC were transfected with a reporter vector containing a 200-bp fragment of the 5′-flanking region of the human CIKS gene (3 g for 24 h) with and without mutations (D). pGL3-Basic served as a vector control. Cells were co-transfected with the Renilla luciferase vector (100 ng). Following transfection, cells were treated with HG for 12 h and harvested for the dual-luciferase assay. Firefly luciferase data were normalized to that of corresponding Renilla luciferase activity. E, *P < at least 0.001 vs. NG, †P < at least 0.05 vs. HG, ††P < 0.001 vs. HG (n=12).
High glucose-induced CIKS expression is ROS-dependent
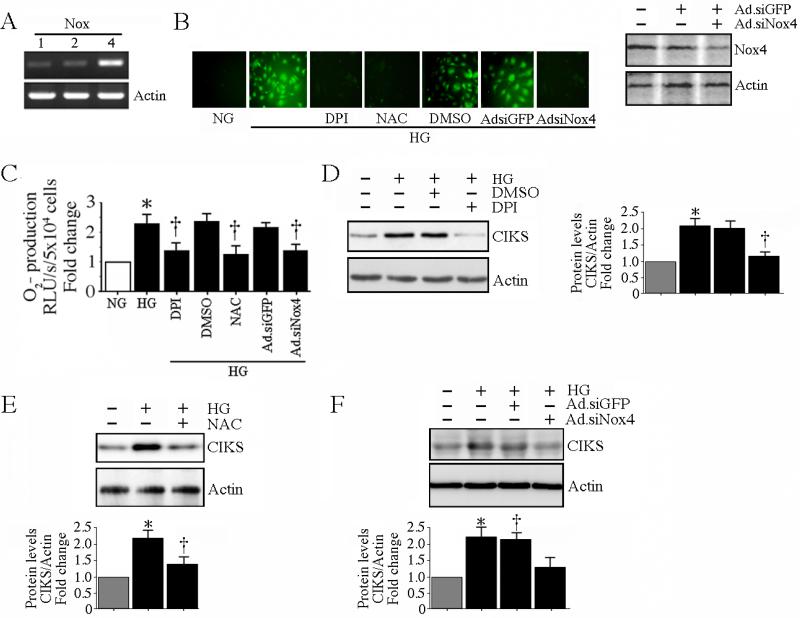
HG is a powerful inducer of oxidative stress, and increased oxidative stress contributes to endothelial dysfunction. NADPH oxidases play a critical role in ROS generation under diabetic conditions. Among the seven homologues of NADPH oxidases (Nox1-5, Duox1, and Duox2), endothelial cells express relatively high levels of Nox4, and low but detectable levels of Nox1 and Nox2 under basal conditions ([30] and Fig. 3A). Therefore, we next investigated whether HG-induced CIKS expression is Nox4/ROS dependent. The generation of ROS was analyzed by the conversion of DCFH-DA to highly fluorescent DCF. Addition of HG stimulated a robust increase in ROS generation that was markedly attenuated by pretreatment with the flavoprotein inhibitor DPI, the free radical scavenger NAC, or Nox4 knockdown (Fig. 3B; knockdown of Nox4 was analyzed by immunoblotting, and is shown on the right). These results were confirmed by the lucigenin-enhanced chemiluminescence assay (Fig. 3C). Furthermore, DPI (Fig. 3D; results from three independent experiments are summarized on the right), NAC (Fig. 3E; results from three independent experiments are summarized in the lower panel) or Ad.siNox4 (Fig. 3F; results from three independent experiments are summarized in the lower panel) markedly inhibited HG-induced CIKS expression. These results indicate that HG-induced CIKS expression is ROS and Nox4 dependent (Fig. 3).
Fig. 3. High glucose-induced CIKS expression is ROS dependent.
A, HAEC expresses relatively more Nox4 than Nox1 and Nox2 under basal conditions. DNA-free total RNA from HAEC was analyzed for Nox1, 2 and 4 by RT-PCR (n=3). B, C, HG induces ROS generation. Cells were treated with NAC (5 mM for 1 h), DPI (10 mM in DMSO for 1 h) or infected with Ad.siNox4 (MOI 100 for 24 h) prior to HG addition. Ad.siGFP served as a control. Intracellular ROS levels following HG treatment were determined by oxidation of the cell-permeable, redox-sensitive fluorophore DCFH-DA into fluorescent DCF (B; knockdown of Nox4 by immunoblotting is shown on the right) and by lucigenin-enhanced chemiluminescence (C). C, *P < at least 0.01 vs. NG, †P < 0.01 vs. HG (n=6). D, E, F, HG-induced CIKS expression is dependent on DPI-inhibitable Nox4-dependent ROS generation. HAEC treated with DPI (C), NAC (D), or infected with Ad.siNox4 (E) were treated with HG (25 mM for 2 h), and analyzed for CIKS expression by immunoblotting using whole cell lysates. Densitometric analysis of three independent experiments is summarized on the right (D) or in lower panels (E, F). D, E, F, *P < 0.01 vs. NG, †P < 0.05 vs. HG.
CIKS mediates high glucose-induced ICAM-1 and VCAM-1 expression through IKK/NF-κB and JNK/AP-1
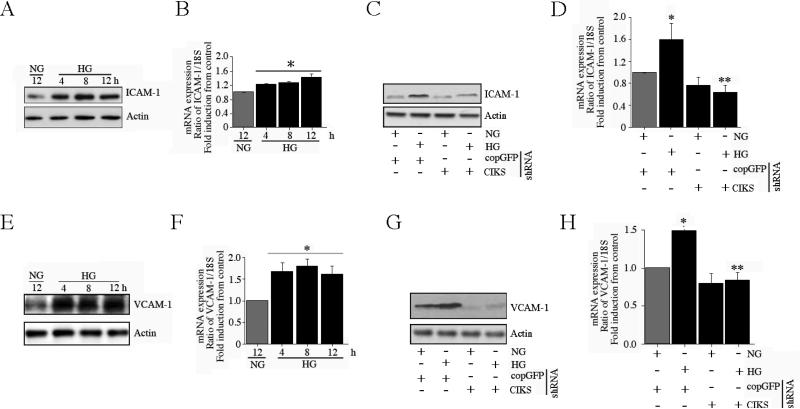
Enhanced expression of adhesion molecules such as ICAM-1 and VCAM-1 on endothelial cells, and endothelial-monocyte adhesion are hallmarks of endothelial dysfunction under diabetic conditions. Since we have demonstrated that HG-enhanced endothelial-monocyte adhesion is mediated by CIKS (Fig 1), we next examined whether CIKS mediates HG-induced ICAM-1 and VCAM-1 expression. Incubation of HAEC with HG significantly increased both ICAM-1 protein (Fig. 4A) and mRNA (Fig. 4B) expression in a time dependent fashion. Notably, CIKS knockdown blunted HG-induced ICAM-1 protein (Fig. 4C) and mRNA expression (Fig. 4D). Similar to ICAM-1 expression, HG increased time-dependent VCAM-1 protein (Fig. 4E) and mRNA expression (Fig 4F), and CIKS knockdown blunted HG-induced VCAM-1 protein (Fig. 4G) and mRNA (Fig. 4H), indicating that HG-induced adhesion molecule expression is CIKS-dependent.
Fig. 4. CIKS mediates high glucose-induced ICAM-1 and VCAM-1 expression.
. A, B, HG induces ICAM-1 expression. At 70% confluency, the complete medium on HAEC was replaced with EBM-2 (without supplements) for 2h, incubated with HG for the indicated time periods, and analyzed for ICAM-1 protein by immunoblotting (A; n=3) and mRNA expression by RT-qPCR (B). B, *P < at least 0.05 vs. NG. C, D, HG-induced ICAM-1 expression is CIKS dependent. HAEC infected with lentiviral particles expressing CIKS shRNA (MOI 0.5 for 48 h) were treated with HG and analyzed for ICAM-1 protein (C; n=3) and mRNA (12 h; D) expression as in A and B. D, *P < at least 0.01 vs. NG, P < 0.01 vs. HG + copGFP (n=6). E, F, HG induces VCAM-1 expression. HAEC incubated with HG as in A and B were analyzed for VCAM-1 protein (E; n=3) and mRNA expression (F). F, *P < at least 0.05 vs. NG (n=6). G, H, HG-induced VCAM-1 expression is CIKS dependent. HAEC treated as in C and D were analyzed for VCAM-1 protein (G; n=3) and mRNA (12 h; H) expression. H, *P < at least 0.01 vs. NG, P < 0.01 vs. HG + copGFP (n=6).
The oxidative stress-responsive transcription factors NF-κB and AP-1 have been shown to play critical roles in ICAM-1 and VCAM-1 expression and endothelial dysfunction. Since we and others have shown that CIKS can mediate signaling through both NF-κB and AP-1 pathways [17, 18, 28], we next investigated whether HG-induced ICAM-1 and VCAM-1 expression is dependent on CIKS-regulated NF-κB and AP-1 pathways. Lentiviral transduction of HAEC with shRNA for IKKβ, IKKγ, p65, JNK and c-Jun all inhibited ICAM-1 (Fig 5A) and VCAM-1 (Fig. 5B) mRNA expression in HAEC. Knockdown of respective proteins was confirmed by immunoblotting (Fig. 5C). These results confirmed previous studies that IKK/NF-κB and JNK/AP-1 pathways mediate high glucose-induced ICAM-1 and VCAM-1 expression in HAEC. We next determined the role of CIKS in HG-induced NF-κB and AP-1.
Fig. 5. High glucose induces ICAM-1 and VCAM-1 expressions via IKK, p65, JNK, and c-Jun.
A, HG induces ICAM-1 expression via IKK, p65, JNK, and c-Jun. HAEC infected with lentiviral particles expressing IKKβ, IKKγ, p65, JNK, or c-Jun shRNA (MOI 0.5 for 48 h) were treated with HG for 12 h and then analyzed for ICAM-1 (A) or VCAM-1 (B) mRNA (12 h) expression by RT-qPCR. Knockdown of respective proteins was confirmed by immunoblotting, and are shown in C. A, B, *P < at least 0.01 vs. NG, †P < at least 0.001 (n=12).
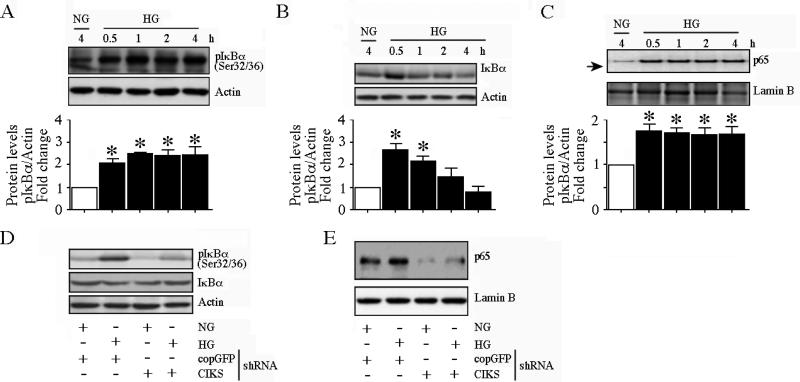
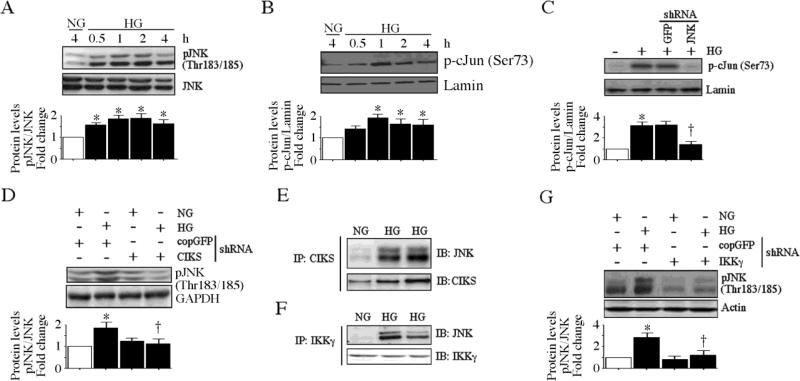
HG time-dependently increased phosphorylation of the inhibitory subunt IκB-α at both Ser32 and Ser36 (Fig. 6A; results from three independent experiments are summarized in the lower panel), leading to its degradation (Fig. 6B; results from three independent experiments are summarized in the lower panel) and induction of p65 nuclear translocation (Fig. 6C; results from three independent experiments are summarized in the lower panel). Importantly, CIKS knockdown inhibited HG-induced IκB-α degradation (Fig. 6D), and p65 nuclear translocation (Fig. 6E). Interestingly, HG treatment also induced increased CIKS association with IKKγ (data not shown) Thus HG-induced IκB-α degradation and NF-κB activation were CIKS dependent. Similarly, HG increased time-dependent JNK phosphorylation (Fig. 7A; results from three independent experiments are summarized in the lower panel) and c-Jun transactivation (Fig. 7B; results from three independent experiments are summarized in the lower panel) in a CIKS-dependent manner (Figs. 7C, 7D; results from three independent experiments are summarized in the lower panel). Coimmunoprecipitation and immunoblotting revealed that CIKS binds JNK under basal conditions, and HG enhanced their association (Fig. 7E), and that of JNK with IKKγ (Fig. 7F). Importantly, knockdown of IKKγ inhibits HG-induced JNK phosphorylation (Fig. 7G; results from three independent experiments are summarized in the lower panel), indicating that HG-induces AP-1 activation via CIKS/IKKγ/JNK association. Thus these data strongly suggest that CIKS-dependent NF-κB and AP-1 activation mediate HG-induced ICAM-1 and VCAM-1 expression in HAEC (Fig. 7).
Fig. 6. CIKS mediates high glucose-induced NF-κB activation.
A, HG induces time dependent IκBα phosphorylation. At 70% confluency, the complete medium on HAEC was replaced with EBM-2 (without supplements) for 2h, incubated with HG for the indicated time periods, and analyzed for phospho-IκBα (Ser32/36) protein levels by immunoblotting. Densitometric analysis from three independent experiments is summarized in the lower panel. *P < at least 0.05 vs. NG. B, HG induces IκBα degradation. HAEC treated as in A were analyzed for total IκBα levels by immunoblotting. Densitometric analysis from three independent experiments is summarized in the lower panel. *P < at least 0.05 vs. NG. C, HG promotes p65 nuclear translocation. HAEC treated as in A were analyzed for p65 levels in nuclear protein extracts. Lamin B served as a loading and purity control. Densitometric analysis from three independent experiments is summarized in the lower panel. *P < at least 0.05 vs. NG. D, CIKS knockdown blunts HG-induced IκBα phosphorylation and IκBα degradation. HAEC infected with lentiviral particles expressing CIKS shRNA (MOI 0.5 for 48 h) were treated with HG (1 h) and analyzed for phospho-IκBα (Ser32/36) and total IκBα levels by immunoblotting (n=3). E, CIKS knockdown blunts basal and HG-induced p65 nuclear translocation. HAEC treated with HG (1 h) as in D were analyzed for nuclear p65 levels by immunoblotting (n=3).
Fig. 7. CIKS mediates high glucose-induced AP-1 activation.
A, HG induces time dependent JNK activation. At 70% confluency, the complete medium on HAEC was replaced with EBM-2 (without supplements) for 2h, incubated with HG for the indicated time periods, and analyzed for phospho-JNK (Thr183/185) levels by immunoblotting (n=3). B, HG induces c-Jun phosphorylation. HAEC treated as in A were analyzed for nuclear phospho-c-Jun (Ser73) levels by immunoblotting (n=3). Lamin B served as a loading and purity control. C, JNK knockdown blunts HG-mediated c-Jun phosphorylation. HAEC infected with lentiviral particles expressing JNK shRNA (MOI 0.5 for 48 h) were treated with HG (1 h) and analyzed for nuclear phospho-c-Jun levels by immunoblotting (n=3). D, CIKS knockdown blunts HG-induced JNK activation. HAEC infected with lentiviral particles expressing CIKS shRNA (MOI 0.5 for 48 h) were treated with HG (1 h) and analyzed for phospho-JNK levels by immunoblotting (n=3). E, HG increases CIKS physical association with JNK. HAEC treated with HG for 15 min were analyzed for CIKS/JNK binding by immunoprecipitation/immunoblot (IP/IB) using whole cell lysates (n=3). F, HG increases JNK physical association with IKKγ. HAEC treated as in E were analyzed for JNK/IKKγ binding by IP/IB using whole cell lysates (n=3). G, IKKγ knockdown blunts HG-induced JNK activation. HAEC infected with lentiviral particles expressing IKKγ shRNA (MOI 0.5 for 48 h) were treated with HG (1 h) and analyzed for phospho-JNK levels by immunoblotting (n=3). A, B, C, D and G, densitometric analysis of three independent experiments is summarized in respective lower panels. *P < at least 0.01 vs. NG, †P < 0.05 vs. HG.
CIKS mediates high glucose-induced cytokine and chemokine expression
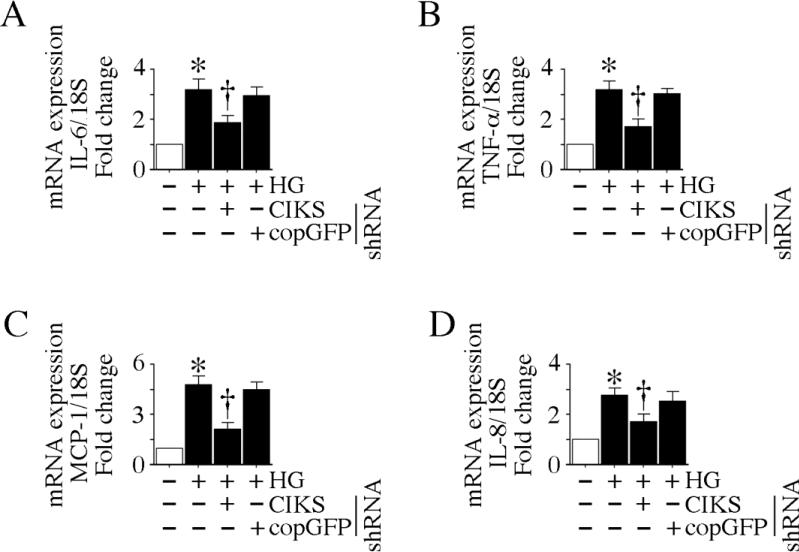
In diabetes mellitus, high glucose-induced inflammatory cytokines contribute to endothelial dysfunction by enhancing oxidative stress, promoting infiltration of activated inflammatory cells, and induction of adhesion molecule expression on both endothelial cells and monocytes. Since HG induced CIKS expression (Fig. 2) and CIKS-mediated NF-κB and AP-1 activation (Figs. 4-6), we next investigated whether HG induces other proinflammatory cytokine and chemokine expression via CIKS. Our results show that HG is a potent inducer of IL-6 and TNF-α expression in HAEC, and CIKS knockdown markedly attenuates their expression (Fig. 8A, 8B). Further, CIKS knockdown blunts HG-induced MCP-1 and IL-8 expression (Fig. 8C, 8D), indicating that CIKS mediates HG-induced cytokine and chemokine expression in HAEC (Fig. 8).
Fig. 8. CIKS mediates high glucose-induced cytokine and chemokine expression.
HAEC infected with lentiviral particles expressing CIKS shRNA (MOI 0.5 for 48 h) were treated with HG for 4 h, and analyzed for IL-6 (A), TNF-α (B), MCP-1 (C) and IL-8 (D) mRNA expression by RT-qPCR. *P < at least 0.01 vs. NG, †P < at least 0.05 vs. HG or HG + copGFP (n=6).
AGE-HSA, oxLDL and AOPPs-HSA induce CIKS expression
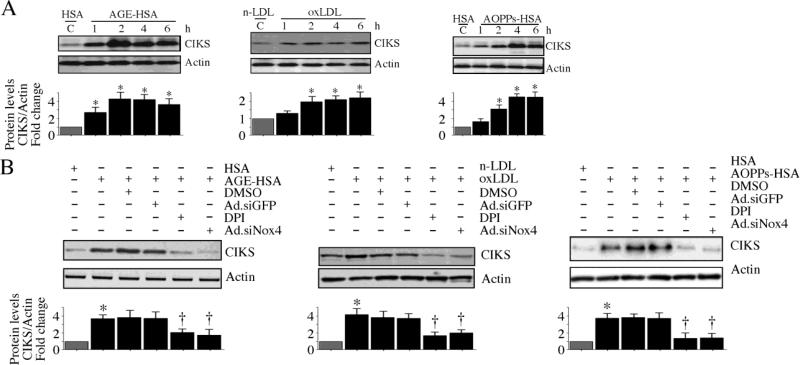
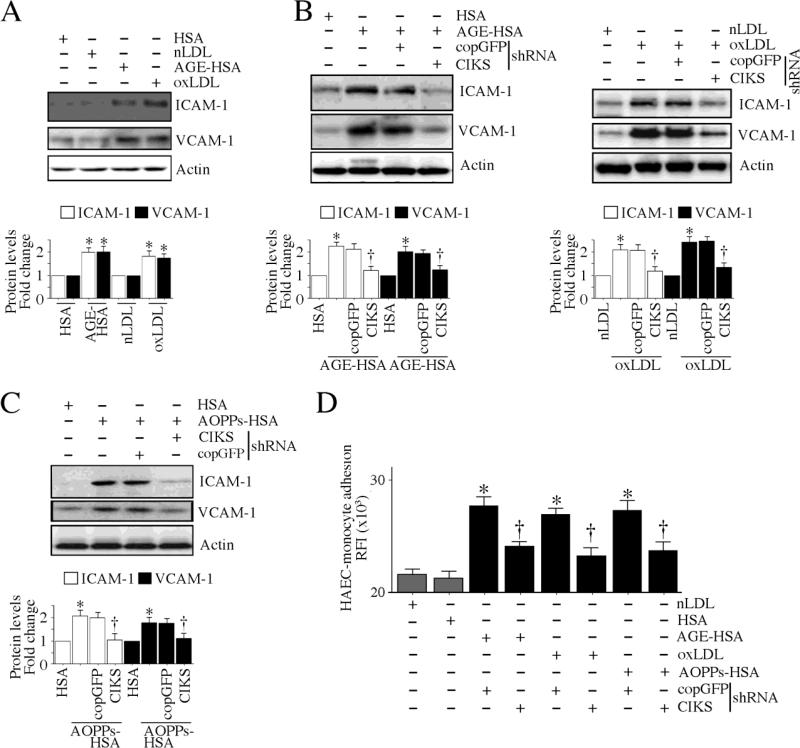
Diabetes mellitus is also characterized by the enhanced accumulation of nonenzymatically glycosylated proteins in the vasculature, increased systemic levels of oxLDL, generation of anti-oxLDL antibodies, and the formation and deposition of immune complexes resulting in vascular injury [3, 4]. Further, diabetes results in the accumulation of dityrosine-containing advanced oxidation protein products (AOPPs) formed as a result of reactions between proteins and hypochlorous acid (HOCl). AOPPs are mainly carried by albumin in the circulation. Like AGEs, AOPPs signal via the receptor for AGE (RAGE) in endothelial cells and induce ICAM-1 and VCAM-1 expression [31]. Since HG induced robust CIKS expression in HAEC (Fig. 2), we next investigated whether AGE-HSA, oxLDL and AOPPs-HSA also induce CIKS expression in these cells. Indeed, similar to HG, all three metabolic products induced time dependent CIKS protein expression in HAEC (Fig. 9A; results from three independent experiments are summarized in respective lower panels). These effects were not modulated by polymyxin B (10 μg/ml for 2h) pretreatment, indicating that AGE-HSA-, oxLDL- and AOPPs-HSA-induced CIKS expression is not mediated by the very low levels of endotoxin present in these preparations (data not shown). Furthermore, the induction of CIKS by each of these modified proteins was inhibited by pretreatment with DPI or Nox4 knockdown (Fig. 9B; results from three independent experiments are summarized in respective lower panels), indicating that CIKS induction is redox-dependent. Moreover, AGE-HSA and oxLDL upregulated ICAM-1 and VCAM-1 expression (Fig. 10A; results from three independent experiments are summarized in the lower panel) in a CIKS-dependent manner (Fig. 10B, left and right panels; results from three independent experiments are summarized in the lower panel). Likewise, AOPPs-HSA-induced adhesion molecule expression was also blunted following CIKS knockdown (Fig.10C; results from three independent experiments are summarized in the lower panel). Importantly, CIKS knockdown inhibited AGE-HSA, oxLDL and AOPPs-HSA induced HAEC-monocyte adhesion (Fig. 10D), indicating that, similar to HG, the deleterious metabolic products generated during hyperglycemic conditions also induce endothelial dysfunction in a CIKS-dependent manner (Figs. 9 and 10).
Fig. 9. AGE-HSA, oxLDL and AOPPs-HSA induce CIKS expression via Nox4 and ROS.
A, AGE-HSA (left), oxLDL (middle) and AOPPs-HSA (right) induce CIKS expression. At 70% confluency, the complete medium on HAEC was replaced with EBM-2 (without supplements) for 2h, incubated with 50 μg/ml AGE-HSA, oxLDL, or AOPPs-HSA, and then analyzed for CIKS protein expression by immunoblotting. Results from three independent experiments are summarized in respective lower panels. *P < 0.05 vs. respective unmodified proteins, †P<0.05 vs. respective modified proteins (n=3). B, AGE-HSA, oxLDL and AOPPs-HSA induce CIKS expression via Nox4. HAEC were treated with DPI (10 μM in DMSO for 30 min) or infected with Ad.siNox4 (MOI 100 for 24 h) prior to AGE-HSA ((left; 2 h), oxLDL (middle; 2 h) and AOPPs-HSA (right; 4 h) addition. CIKS expression was analyzed by immunoblotting as in A. Results from three independent experiments are summarized in respective lower panels. *P < 0.05 vs. respective unmodified proteins, †P<0.05 vs. respective modified proteins (n=3).
Fig. 10. CIKS mediates AGE-HSA, oxLDL and AOPPs-HSA induced endothelial-monocyte adhesion.
A, AGE-HSA and oxLDL induce adhesion molecule expression. HAEC were treated with AGE-HSA or oxLDL as in A, but for 4 h, were analyzed for ICAM-1 and VCAM-1 expression by immunoblotting. B, AGE-HSA and oxLDL induce adhesion molecule expression via CIKS. HAEC infected with lentiviral particles expressing CIKS shRNA (MOI 0.5 for 48 h) were treated with AGE-HSA (left) or oxLDL (right) for 4 h, and then analyzed for ICAM-1 and VCAM-1 expression by immunoblotting. C, AOPPs-HSA induces adhesion molecule expression via CIKS. HAEC infected with lentiviral particles expressing CIKS shRNA (MOI 0.5 for 48 h) were incubated with AOPPs-HSA for 4 h, and then analyzed for ICAM-1 and VCAM-1 expression by immunoblotting. A, B, C, Results from three independent experiments are summarized in respective lower panels. *P < 0.05 vs. respective unmodified proteins, †P < 0.05 vs. respective modified proteins (n=3). D, AGE-HSA, oxLDL and AOPPs-HSA induce endothelial-monocyte adhesion via CIKS. HAEC were infected with lentiviral particles expressing CIKS shRNA (MOI 0.5 for 48 h) were treated with AGE-HSA, oxLDL and AOPPs-HSA for 4 h. Labeled THP-1 cells were then added, incubated further at 37°C for 1 h, and analyzed for endothelial-monocyte adhesion as in Fig. 1A. *P < 0.001 vs. respective controls, †P < at least 0.01 vs. respective treated groups (n=12).
CIKS expression is enhanced in vivo in aortas from type 1 diabetic animals
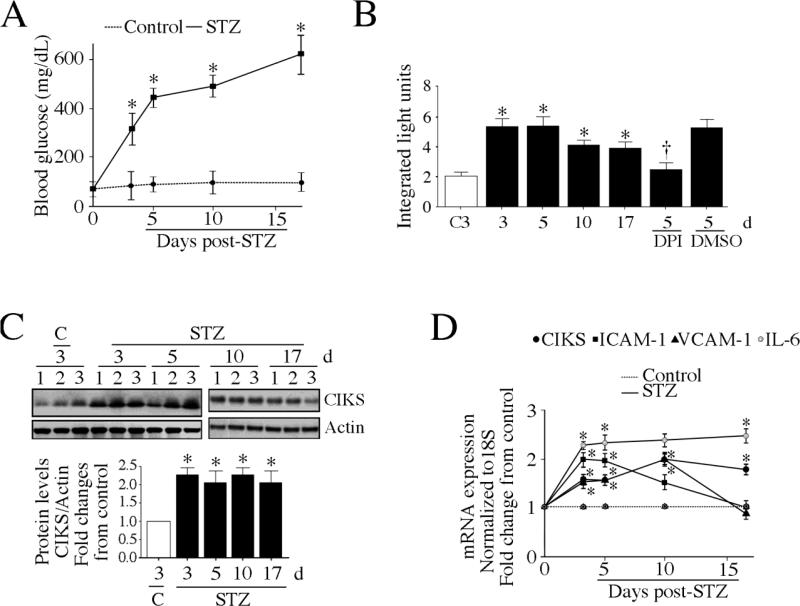
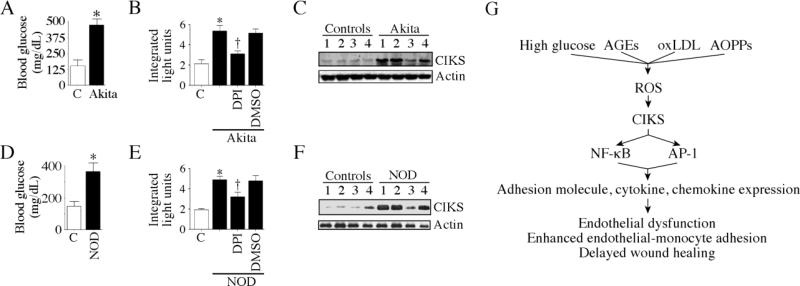
Having demonstrated that HG, AGE-HSA, oxLDL and AOPPs-HSA can each induce CIKS expression, and CIKS-dependent adhesion molecule expression and enhanced endothelial-monocyte adhesion (Figs. 9 and 10), we next investigated whether CIKS expression is upregulated in vivo in the aortas from various Type 1 diabetic mice. In addition to streptozotocin-induced type 1 diabetic mice, we also investigated CIKS expression in two genetic models of type 1 diabetes: Akita and NOD. Daily administration of streptozotocin for 4 days in normal C57BL/6 mice resulted in a significant increase in hyperglycemia (Fig. 11A). The blood sugar levels rose as early as 3 days after the last STZ injection, and remained high throughout the 17-day study period (Fig. 11A). The aortas from these animals showed increased levels of DPI-inhibitable superoxide generation (Fig. 11B). Notably, a robust induction of CIKS protein was detected in the aortas at 3 days, and this persisted throughout the 17-day study period (Fig. 11C; densitometric analysis is summarized in the lower panel). Similar to its protein expression, CIKS mRNA levels were also elevated in aortas, as were the levels of ICAM-1, VCAM-1 and IL-6 mRNA (Fig. 11D). Though IL-6 expression remained high until 17 days post-STZ, ICAM-1 and VCAM-1 levels fell below basal levels at day 17 (Fig. 11D). Similar to STZ-induced type 1 diabetes model, Akita mice that displayed significant hyperglycemia at 10 weeks of age (Fig. 12A), also showed increased DPI-inhibitable ROS generation (Fig. 12B) and CIKS protein expression (2.3-fold; Fig. 12C). Furthermore, the female NOD mice that exhibited significant hyperglycemia at 18 weeks (Fig. 12D) also showed elevated levels of ROS (Fig. 12E) and CIKS protein expression (Fig. 12F) in aortas. These results indicate that all three type 1 diabetic animal models with significant hyperglycemia expressed high levels of CIKS in vivo in aortas (Figs. 11, 12).
Fig. 11. CIKS expression is enhanced in aortas of streptozotocin (STZ)-induced type 1 diabetic mice.
A, Blood glucose levels are increased following STZ administration. Male C57Bl/6 mice were administered once daily for 4 days with STZ in sodium citrate buffer (60 mg/kg, IP). The control group received sodium citrate buffer alone. Blood glucose levels were quantified at 3, 5, 10, and 17 days post-STZ. *P < at least 0.05 vs. control (n=4/group). B, DPI-inhibitable ROS is increased in aortas of STZ-induced type 1 diabetic mice. ROS production was measured by the lucigenin-enhanced chemiluminescence assay using aortic homogenates from the indicated groups. The reaction mixture contained 100 μM NADPH. Experiments were also performed in the presence of DPI (10 μM in DMSO). *P < 0.05 vs. saline (n=4/group). C, CIKS protein expression is enhanced in aortas of STZ-treated mice. Aortas from mice described in A were analyzed for CIKS expression by immunoblotting. Densitometric analysis of the immuno-reactive bands is summarized in the lower panel. *P < 0.05 vs. control (n=3/group). D, CIKS, adhesion molecule and IL-6 mRNA expression are increased in aortas from STZ-treated mice. Aortas from mice described in A were analyzed for CIKS, ICAM-1, VCAM-1 and IL-6 mRNA by RT-qPCR. *P < at least 0.05 vs. control (n=4/group).
Fig. 12. CIKS expression is enhanced in aortas of autoimmune type 1 diabetes-prone Akita and NOD mice.
A, B, C, Blood glucose, DPI-inhibitable ROS generation and CIKS protein expression are increased in Akita mice. A, Blood glucose levels were analyzed at 10 weeks of age. *P < 0.01 vs. control (C; n=4/group). B, ROS generation was analyzed by the lucigenin-enhanced chemiluminescence assay using aortic homogenates from the indicated groups. The reaction mixture contained 100 μM NADPH. Experiments were also performed in the presence of DPI (10 μM in DMSO). *P < 0.05 vs. control (C), †P < 0.05 vs. DMSO (n=4/group). C, CIKS expression was analyzed in cleared aortic homogenates by immunoblotting. D, E, F, Blood glucose, DPI-inhibitable ROS generation and CIKS protein expression are increased in 18 week-old female NOD mice. Age-matched insulitis-resistant diabetes-free female NOR mice served as controls. Blood glucose levels (D), ROS generation (E), and CIKS protein expression (F) were analyzed as in A, B and C, respectively. D, *P < 0.05 vs. NOR control (n=4/group). E, *P < 0.05 vs. NOR, †P < 0.05 vs. DMSO (n=4/group). G, Schema showing that CIKS is a critical mediator of high glucose, AGEs, oxLDL and AOPPs induced NF-κB and AP-1 dependent cytokine, chemokine and adhesion molecule expression and endothelial dysfunction.
Discussion
Dysfunction of the vascular endothelium is a hallmark of diabetes mellitus. The generation of high levels of reactive oxygen species, activation of oxidative stress-responsive transcription factors, aberrant expression of proinflammatory cytokines, chemokines and adhesion molecules, and enhanced endothelial-monocyte adhesion all contribute to diabetic vasculopathy. Here we demonstrate for the first time that the adapter molecule CIKS mediates high glucose (HG)-induced endothelial dysfunction. Further, HG induced CIKS expression via Nox4-dependent ROS generation, and its transcription via IRF-1, C/EBP and AP-1. HG enhanced CIKS binding to IKKγ and JNK, promoted CIKS-dependent p65 and c-Jun nuclear translocation, and cytokine, chemokine, and adhesion molecule expression. Notably, CIKS knockdown reversed HG-induced endothelial-monocyte adhesion and suppression of HAEC migration. Similar to HG, the deleterious metabolic products of hyperglycemia AGE-HSA, oxLDL and AOPPs-HSA all induced CIKS expression, and CIKS-dependent endothelial dysfunction. Importantly, aortas from streptozotocin-induced and autoimmune-prone type 1 diabetic NOD and Akita mice expressed high levels of ROS and CIKS. These results demonstrate that CIKS expression and CIKS-dependent inflammatory signaling is enhanced under hyperglycemic conditions (Fig. 12G). Therefore, targeting CIKS might have broader protective effects in vascular diseases like diabetes and atherosclerosis.
Diabetes mellitus is characterized by chronic oxidative stress. Here we show that HG-induced CIKS expression is ROS dependent, as treatment with the free radical scavenger NAC, the flavoprotein inhibitor DPI, or forced expression of Nox4 siRNA each inhibited HG-induced CIKS expression. Though endothelial cells express Nox1, Nox2 and Nox4, the expression levels of Nox4 appear to predominate under basal conditions, suggesting that Nox4 is critical in endothelial ROS generation. In fact, Nox4 has been shown to be the predominant oxidase in endothelial cells [30], and HG, while upregulating Nox4 expression via NF-κB [32], failed to modulate Nox1 or Nox2 expression in HAEC [32]. Since hydrogen peroxide is usually the only detectable product of Nox4 activity [33], we tested whether hydrogen peroxide induces CIKS expression. Indeed, our results showed increased CIKS expression in HAEC treated with non-toxic doses of hydrogen peroxide, and this effect was blunted by the forced expression of CuZnSOD (data not shown). Together, these studies suggest that hyperglycemia perpetuates oxidative stress in endothelial cells via Nox4-dependent ROS generation, and that CIKS is an oxidative stress-responsive adapter molecule.
The CIKS proximal promoter region contains potential binding sites for three critical oxidative stress-responsive transcription factors, IRF-1, C/EBP and AP-1 [27]. HG positively regulates these three transcription factors [34-36]. Under basal conditions, CIKS is present in the cytoplasm bound to TRAF6, and upon stimulation with an agonist, CIKS functions as an E3 ubiquitin ligase and polyubiquitinates TRAF6 at Lys-63, leading to its dissociation and activation of downstream signaling [37]. CIKS physically associates with IKKs and activates NF-κB and AP-1 [17]. In fact, here we demonstrate that CIKS physically associates with IKKγ in HAEC, and HG enhances their binding. Further, HG promotes p65 nuclear translocation, and knockdown of CIKS or forced expression of mutant IKKγ each blunts this response. We previously reported similar observations in cardiomyocytes treated with angiotensin (Ang)-II [28]. In those studies, Ang-II induced CIKS induction and enhanced CIKS/IKKγ physical association. Interestingly, Ang-II-induced CIKS expression in cardiomyocytes was also dependent on NADPH oxidase-derived ROS generation [28], providing further evidence that CIKS is an oxidative stress-responsive adapter molecule.
In addition to NF-κB activation, CIKS also regulates AP-1 activation [17]. Here we demonstrated that CIKS physically associates with IKKγ, and IKKγ with JNK. Importantly, knockdown of CIKS, IKKγ, or JNK inhibits HG-induced c-Jun phosphorylation and nuclear translocation. It has been previously reported that the leucine-zipper domain 1 of IKKγ is responsible for AP-1 activation [38]. In that study, forced expression of wild type IKKγ dose-dependently activated c-Jun phosphorylation, and treatment with the JNK inhibitor blocked this response [38], indicating that IKKγ/JNK interaction leads to AP-1 activation. Previously we demonstrated that knockdown of CIKS blunts IKKγ and JNK interaction and c-Jun phosphorylation in cardiomyocytes [28], suggesting that CIKS may serve as a scaffolding protein.
We also demonstrated that HG enhances the expression levels of inflammatory cytokines, chemokines and adhesion molecules in endothelial cells that are known to contribute to endothelial dysfunction. Interestingly, these inflammatory molecules are responsive to NF-κB, AP-1 or both. Importantly, knockdown of CIKS markedly attenuated their expression. An interesting possibility is that upon induction by high glucose, some of the cytokines may also upregulate CIKS expression [27], and induce their own and other inflammatory cytokine and adhesion molecule expression in endothelial cells, thus perpetuating the inflammatory cascade via CIKS leading to endothelial dysfunction and vascular injury.
Chronic hyperglycemia results in the enhanced accumulation of deleterious nonenzymatically glycosylated proteins in the vasculature. Hyperglycemia also results in increased systemic levels of oxLDL, and both AGEs and oxLDL mediate vascular injury. Here we show that, similar to HG, both AGE-HSA and oxLDL induce robust expression of CIKS, and CIKS-dependent endothelial dysfunction. Though we did not investigate the molecular mechanisms involved in AGE-HSA-induced CIKS expression, it is possible that oxidative stress might mediate this response, as AGEs signal via RAGE, and NADPH oxidase-dependent ROS generation is a critical mediator of AGE/RAGE signaling [39]. In fact, here we showed that both DPI and Nox4 knockdown blunted AGE-HSA-induced CIKS expression. Similarly, oxLDL, which signals predominantly via LOX-1 in endothelial cells [40], stimulates DPI-inhibitable Nox4-dependent ROS generation, CIKS induction, and CIKS-dependent endothelial dynsfunction. Of note, high glucose-induced ROS generation has been shown to upregulate RAGE and LOX-1 expression [41, 42], suggesting a positive amplification in AGEs and oxLDL signaling, and possible contribution to sustained CIKS induction. These results suggest that high glucose and the deleterious metabolic products generated during hyperglycemic conditions in diabetes all induce ROS-dependent CIKS expression.
In addition to enhanced formation of AGEs and oxLDL, increased formation of AOPPs has also been reported in diabetes [3, 4]. AOPPs are formed when plasma proteins react with chlorinated oxidants during oxidative stress, and are carried usually by albumin in the plasma. AOPPs levels are found increased in coronary artery disease [43] and atherosclerosis [44], and in chronic renal failure [45], which accelerates atherosclerosis. Similar to AGEs, AOPPs have recently been shown to signal via RAGE, induce ROS generation via NADPH oxidases, and activate endothelial cells [31]. Here we demonstrate that AOPPs-HSA markedly increases CIKS expression, CIKS-dependent adhesion molecule expression, and endothelial-monocyte adhesion. HG, AGE-HSA, oxLDL and AOPPs-HSA induced CIKS expression suggests contribution of both receptor-dependent and independent oxidative stress-responsive mechanisms to CIKS induction during hyperglycemic conditions, resulting ultimately in endothelial dysfunction and vascular injury.
Most importantly, we also found that CIKS expression is enhanced in the aortas from three different mouse models of type 1 diabetes. Administration of the β-cell toxin streptozotocin persistently increased blood glucose levels, and induced DPI inhibitable ROS generation and CIKS protein expression in aortas. Of note, like oxidative stress, CIKS expression persisted at high levels throughout the 17-day study period. In addition, expression levels of ICAM-1, VCAM-1, and IL-6 mRNA were also increased. Similar to STZ-induced type 1 diabetes, both Akita and NOD mice that spontaneously develop type 1 diabetes, also showed increased ROS generation and CIKS expression in aortas. These results recapitulate our in vitro results and show that hyperglycemia is a potent inducer of oxidative stress and CIKS expression in vivo. In summary, our results demonstrate for the first time that hyperglycemia is a potent stimulus for CIKS expression, and oxidative stress plays a critical role in its induction. Since CIKS mediates NF-κB and AP-1-dependent inflammatory signaling and endothelial dysfunction, targeting CIKS might have broader protective effects in vascular diseases, including diabetes mellitus and atherosclerosis.
Supplementary Material
Highlights.
► High glucose induces endothelial dysfunction via Nox4/ROS/CIKS/NF-κB/AP-1.
► Targeting CIKS blunts HG induced adhesion molecule and cytokine expression
► AGEs, oxLDL and AOPPs induce CIKS-dependent endothelial dysfunction
► Type 1 diabetic animals express high levels of CIKS in the aorta in vivo.
► CIKS is a novel therapeutic target in diabetic vascular complications.
Acknowledgements
This work was supported by Veterans Affairs Office of Research and Development Biomedical Laboratory Research and Development Service Award 1IO1BX000246 and the NIH/NHLBI Grant HL-86787 (to BC). The contents of this report do not represent the views of the Department of Veterans Affairs or the United States Government.
Abbreviations used in this paper
- Act1
activator of NF-κB
- AOPPs
advanced oxidation protein products
- AGE
advanced glycation end product
- AP-1
activator protein-1
- C/EBP
CCAAT/enhancer-binding protein
- CIKS
Connection to IKK and SAPK/JNK
- DCFH-DA
2',7'-dichlorofluorescin-diacetate
- DCF
dichlorofluorescein
- dn
dominant negative
- DPI
diphenylene iodonium
- copGFP
copepod green fluorescent protein
- GST
glutathione-S-transferase
- HSA
human serum albumin
- IκB
inhibitory κB
- IKK
IκB kinase
- IL
interleukin
- IP/IB
co-immunoprecipitation/immunoblotting
- IRF
IFN regulatory factor
- JNK
c-Jun amino-terminal kinase
- kd
kinase deficient
- LOX-1
lectin-like oxidized low-density lipoprotein receptor-1
- MOI
multiplicity of infection
- MMP
matrix metalloproteinase
- NEMO
NF-κB essential modulator
- NF-κB
nuclear factor kappa B
- Nox
NADPH oxidase
- NADPH
nicotinamide adenine dinucleotide phosphate
- oxLDL
oxidized low density lipoprotein
- RAGE
receptor for AGE
- ROS
reactive oxygen species
- SAPK
stress-activated protein kinase
- siRNA
small interfering RNA
- shRNA
small hairpin RNA
- TRAF
TNF Receptor Associated Factor
- TRAF3IP2
TRAF3 interacting protein 2
- TNF
tumor necrosis factor
- UTR
untranslated region
- WT
wild-type
Footnotes
Publisher's Disclaimer: This is a PDF file of an unedited manuscript that has been accepted for publication. As a service to our customers we are providing this early version of the manuscript. The manuscript will undergo copyediting, typesetting, and review of the resulting proof before it is published in its final citable form. Please note that during the production process errors may be discovered which could affect the content, and all legal disclaimers that apply to the journal pertain.
References
- 1.Diabetes Care. 2008;31(Suppl 1):S55–60. doi: 10.2337/dc08-S055. [DOI] [PubMed] [Google Scholar]
- 2.Collier A, Small M. Br J Hosp Med. 1991;45(1):38–40. [PubMed] [Google Scholar]
- 3.Kalousova M, Skrha J, Zima T. Physiol Res. 2002;51(6):597–604. [PubMed] [Google Scholar]
- 4.Martin-Gallan P, Carrascosa A, Gussinye M, Dominguez C. Free Radic Biol Med. 2003;34(12):1563–1574. doi: 10.1016/s0891-5849(03)00185-0. [DOI] [PubMed] [Google Scholar]
- 5.Boullier A, Bird DA, Chang MK, Dennis EA, Friedman P, Gillotre-Taylor K, Horkko S, Palinski W, Quehenberger O, Shaw P, Steinberg D, Terpstra V, Witztum JL. Ann N Y Acad Sci. 2001;947:214–222. doi: 10.1111/j.1749-6632.2001.tb03943.x. discussion 222-213. [DOI] [PubMed] [Google Scholar]
- 6.Blankenberg S, Barbaux S, Tiret L. Atherosclerosis. 2003;170(2):191–203. doi: 10.1016/s0021-9150(03)00097-2. [DOI] [PubMed] [Google Scholar]
- 7.Voraberger G, Schafer R, Stratowa C. J Immunol. 1991;147(8):2777–2786. [PubMed] [Google Scholar]
- 8.Lin SJ, Shyue SK, Hung YY, Chen YH, Ku HH, Chen JW, Tam KB, Chen YL. Arterioscler Thromb Vasc Biol. 2005;25(2):334–340. doi: 10.1161/01.ATV.0000152114.00114.d8. [DOI] [PubMed] [Google Scholar]
- 9.Morel JC, Park CC, Woods JM, Koch AE. J Biol Chem. 2001;276(40):37069–37075. doi: 10.1074/jbc.M103574200. [DOI] [PubMed] [Google Scholar]
- 10.Denk A, Goebeler M, Schmid S, Berberich I, Ritz O, Lindemann D, Ludwig S, Wirth T. J Biol Chem. 2001;276(30):28451–28458. doi: 10.1074/jbc.M102698200. [DOI] [PubMed] [Google Scholar]
- 11.Szlosarek PW, Balkwill FR. Lancet Oncol. 2003;4(9):565–573. doi: 10.1016/s1470-2045(03)01196-3. [DOI] [PubMed] [Google Scholar]
- 12.Lin FS, Lin CC, Chien CS, Luo SF, Yang CM. J Cell Physiol. 2005;202(2):464–473. doi: 10.1002/jcp.20142. [DOI] [PubMed] [Google Scholar]
- 13.Berendji-Grun D, Kolb-Bachofen V, Kroncke KD. Mol Med. 2001;7(11):748–754. [PMC free article] [PubMed] [Google Scholar]
- 14.Karin M, Yamamoto Y, Wang QM. Nat Rev Drug Discov. 2004;3(1):17–26. doi: 10.1038/nrd1279. [DOI] [PubMed] [Google Scholar]
- 15.Derijard B, Hibi M, Wu IH, Barrett T, Su B, Deng T, Karin M, Davis RJ. Cell. 1994;76(6):1025–1037. doi: 10.1016/0092-8674(94)90380-8. [DOI] [PubMed] [Google Scholar]
- 16.Ahmed M, Kundu GC. Mol Cancer. 2010;9:101. doi: 10.1186/1476-4598-9-101. [DOI] [PMC free article] [PubMed] [Google Scholar]
- 17.Leonardi A, Chariot A, Claudio E, Cunningham K, Siebenlist U. Proc Natl Acad Sci U S A. 2000;97(19):10494–10499. doi: 10.1073/pnas.190245697. [DOI] [PMC free article] [PubMed] [Google Scholar]
- 18.Li X, Commane M, Nie H, Hua X, Chatterjee-Kishore M, Wald D, Haag M, Stark GR. Proc Natl Acad Sci U S A. 2000;97(19):10489–10493. doi: 10.1073/pnas.160265197. [DOI] [PMC free article] [PubMed] [Google Scholar]
- 19.Kang Z, Altuntas CZ, Gulen MF, Liu C, Giltiay N, Qin H, Liu L, Qian W, Ransohoff RM, Bergmann C, Stohlman S, Tuohy VK, Li X. Immunity. 2010;32(3):414–425. doi: 10.1016/j.immuni.2010.03.004. [DOI] [PMC free article] [PubMed] [Google Scholar]
- 20.Claudio E, Sonder SU, Saret S, Carvalho G, Ramalingam TR, Wynn TA, Chariot A, Garcia-Perganeda A, Leonardi A, Paun A, Chen A, Ren NY, Wang H, Siebenlist U. J Immunol. 2009;182(3):1617–1630. doi: 10.4049/jimmunol.182.3.1617. [DOI] [PMC free article] [PubMed] [Google Scholar]
- 21.Swaidani S, Bulek K, Kang Z, Liu C, Lu Y, Yin W, Aronica M, Li X. J Immunol. 2009;182(3):1631–1640. doi: 10.4049/jimmunol.182.3.1631. [DOI] [PMC free article] [PubMed] [Google Scholar]
- 22.Qian Y, Liu C, Hartupee J, Altuntas CZ, Gulen MF, Jane-Wit D, Xiao J, Lu Y, Giltiay N, Liu J, Kordula T, Zhang QW, Vallance B, Swaidani S, Aronica M, Tuohy VK, Hamilton T, Li X. Nat Immunol. 2007;8(3):247–256. doi: 10.1038/ni1439. [DOI] [PubMed] [Google Scholar]
- 23.Bergholdt R, Brorsson C, Palleja A, Berchtold LA, Floyel T, Bang-Berthelsen CH, Frederiksen KS, Jensen LJ, Storling J, Pociot F. Diabetes. 2012;61(4):954–962. doi: 10.2337/db11-1263. [DOI] [PMC free article] [PubMed] [Google Scholar]
- 24.Rashid G, Benchetrit S, Fishman D, Bernheim J. Kidney Int. 2004;66(3):1099–1106. doi: 10.1111/j.1523-1755.2004.00860.x. [DOI] [PubMed] [Google Scholar]
- 25.Witko-Sarsat V, Gausson V, Nguyen AT, Touam M, Drueke T, Santangelo F, Descamps-Latscha B. Kidney Int. 2003;64(1):82–91. doi: 10.1046/j.1523-1755.2003.00044.x. [DOI] [PubMed] [Google Scholar]
- 26.Peterson JR, Burmeister MA, Tian X, Zhou Y, Guruju MR, Stupinski JA, Sharma RV, Davisson RL. Hypertension. 2009;54(5):1106–1114. doi: 10.1161/HYPERTENSIONAHA.109.140087. [DOI] [PMC free article] [PubMed] [Google Scholar]
- 27.Zhao Z, Qian Y, Wald D, Xia YF, Geng JG, Li X. J Immunol. 2003;170(11):5674–5680. doi: 10.4049/jimmunol.170.11.5674. [DOI] [PubMed] [Google Scholar]
- 28.Valente AJ, Clark RA, Siddesha JM, Siebenlist U, Chandrasekar B. J Mol Cell Cardiol. 2012;53(1):113–124. doi: 10.1016/j.yjmcc.2012.04.009. [DOI] [PMC free article] [PubMed] [Google Scholar]
- 29.Valente AJ, Yoshida T, Murthy SN, Sakamuri SS, Katsuyama M, Clark RA, Delafontaine P, Chandrasekar B. Am J Physiol Heart Circ Physiol. 2012 doi: 10.1152/ajpheart.00231.2012. [DOI] [PMC free article] [PubMed] [Google Scholar]
- 30.Ago T, Kitazono T, Ooboshi H, Iyama T, Han YH, Takada J, Wakisaka M, Ibayashi S, Utsumi H, Iida M. Circulation. 2004;109(2):227–233. doi: 10.1161/01.CIR.0000105680.92873.70. [DOI] [PubMed] [Google Scholar]
- 31.Guo ZJ, Niu HX, Hou FF, Zhang L, Fu N, Nagai R, Lu X, Chen BH, Shan YX, Tian JW, Nagaraj RH, Xie D, Zhang X. Antioxid Redox Signal. 2008;10(10):1699–1712. doi: 10.1089/ars.2007.1999. [DOI] [PMC free article] [PubMed] [Google Scholar]
- 32.Williams CR, Lu X, Sutliff RL, Hart CM. Am J Physiol Cell Physiol. 2012;303(2):C213–223. doi: 10.1152/ajpcell.00227.2011. [DOI] [PMC free article] [PubMed] [Google Scholar]
- 33.Martyn KD, Frederick LM, von Loehneysen K, Dinauer MC, Knaus UG. Cell Signal. 2006;18(1):69–82. doi: 10.1016/j.cellsig.2005.03.023. [DOI] [PubMed] [Google Scholar]
- 34.Yu S, Xi Z, Hai-Yan C, Ya-Li C, Shao-Hu X, Chuan-Sen Z, Xiang-Qun Y, Jin-Ping G, Hai-Yan L, Lei D. J Cell Biochem. 2012;113(8):2671–2678. doi: 10.1002/jcb.24142. [DOI] [PubMed] [Google Scholar]
- 35.Omori K, Naruishi K, Nishimura F, Yamada-Naruishi H, Takashiba S. J Biol Chem. 2004;279(8):6643–6649. doi: 10.1074/jbc.M311688200. [DOI] [PubMed] [Google Scholar]
- 36.Srinivasan S, Yeh M, Danziger EC, Hatley ME, Riggan AE, Leitinger N, Berliner JA, Hedrick CC. Circ Res. 2003;92(4):371–377. doi: 10.1161/01.RES.0000061714.74668.5C. [DOI] [PubMed] [Google Scholar]
- 37.Liu C, Qian W, Qian Y, Giltiay NV, Lu Y, Swaidani S, Misra S, Deng L, Chen ZJ, Li X. Sci Signal. 2009;2(92):ra63. doi: 10.1126/scisignal.2000382. [DOI] [PMC free article] [PubMed] [Google Scholar]
- 38.Shifera AS, Friedman JM, Horwitz MS. Mol Cell Biochem. 2008;310(1-2):181–190. doi: 10.1007/s11010-007-9679-z. [DOI] [PubMed] [Google Scholar]
- 39.Wautier MP, Chappey O, Corda S, Stern DM, Schmidt AM, Wautier JL. Am J Physiol Endocrinol Metab. 2001;280(5):E685–694. doi: 10.1152/ajpendo.2001.280.5.E685. [DOI] [PubMed] [Google Scholar]
- 40.Sawamura T, Kume N, Aoyama T, Moriwaki H, Hoshikawa H, Aiba Y, Tanaka T, Miwa S, Katsura Y, Kita T, Masaki T. Nature. 1997;386(6620):73–77. doi: 10.1038/386073a0. [DOI] [PubMed] [Google Scholar]
- 41.Yao D, Brownlee M. Diabetes. 2010;59(1):249–255. doi: 10.2337/db09-0801. [DOI] [PMC free article] [PubMed] [Google Scholar]
- 42.Li L, Sawamura T, Renier G. Diabetes. 2003;52(7):1843–1850. doi: 10.2337/diabetes.52.7.1843. [DOI] [PubMed] [Google Scholar]
- 43.Kaneda H, Taguchi J, Ogasawara K, Aizawa T, Ohno M. Atherosclerosis. 2002;162(1):221–225. doi: 10.1016/s0021-9150(01)00706-7. [DOI] [PubMed] [Google Scholar]
- 44.Descamps-Latscha B, Witko-Sarsat V, Nguyen-Khoa T, Nguyen AT, Gausson V, Mothu N, London GM, Jungers P. Am J Kidney Dis. 2005;45(1):39–47. doi: 10.1053/j.ajkd.2004.09.011. [DOI] [PubMed] [Google Scholar]
- 45.Witko-Sarsat V, Friedlander M, Capeillere-Blandin C, Nguyen-Khoa T, Nguyen AT, Zingraff J, Jungers P, Descamps-Latscha B. Kidney Int. 1996;49(5):1304–1313. doi: 10.1038/ki.1996.186. [DOI] [PubMed] [Google Scholar]
Associated Data
This section collects any data citations, data availability statements, or supplementary materials included in this article.


