

Abstract
Endometriosis is a gynecological condition resulting from proliferation of endometrial-like tissue outside the endometrial cavity. Estrogen suppression therapies, mediated through gonadotropin-releasing hormone (GnRH) modulation, decrease endometriotic implants and diminish associated pain albeit at the expense of bone mineral density (BMD) loss. Our goal was to provide model-based guidance for GnRH-modulating clinical programs intended for endometriosis management. This included developing an estrogen suppression target expected to provide symptomatic relief with minimal BMD loss and to evaluate end points and study durations supportive of efficient development decisions. An existing multiscale model of calcium and bone was adapted to include systematic estrogen pharmacologic effects to describe estrogen concentration-related effects on BMD. A logistic regression fit to patient-level data from three clinical GnRH agonist (nafarelin) studies described the relationship of estrogen with endometrial-related pain. Targeting estradiol between 20 and 40 pg/ml was predicted to provide efficacious endometrial pain response while minimizing BMD effects.
Endometriosis is a gynecological condition that results from the presence and proliferation of endometrial-like tissue (stroma and gland) outside the endometrial (uterine) cavity. Clinical manifestations of the disorder are highly variable although pelvic dysmenorrhea is often the major presenting symptom. Other clinical manifestations of the disease include dyspareunia, pain with defecation, and infertility. Endometriosis most commonly occurs in women between the ages of 30 and 40. It is found incidentally at the time of surgery in about one-fifth of all women undergoing gynecological surgery. Symptomatic endometriosis affects up to 15% of all women of reproductive age and 25% of women who experience pelvic pain.1 It is rare after menopause. Indeed, the pain associated with endometriosis is often cyclical in nature and this probably reflects the response of the ectopic endometrial-like tissue to cycling reproductive hormones (particularly estrogen).
Estrogen suppression stops proliferation and induces degenerative changes in endometrial-like tissue that exists outside of the uterine cavity. Removal of these endometrial implants by surgery or reduction in size via estrogen suppression provides adequate pain relief to patients.2 The majority of medical treatments are therefore based on the direct or indirect suppression of female hormone levels. Synthesis and release of the primary ovarian hormones, estrogens, and progesterones are driven by two major anterior pituitary sex hormones, follicle-stimulating hormone and luteinizing hormone. Release of follicle-stimulating hormone and luteinizing hormone by the pituitary is regulated by the release of gonadotropin-releasing hormone (GnRH), the hypothalamic hormone. GnRH modulation, therefore, provides an indirect mechanism for affecting estrogen.
The hypoestrogenic state induced by GnRH-modulating treatments also leads to a variety of adverse effects that are similar to those experienced during menopause. These menopausal-like symptoms affect compliance and have limited the approved treatment durations of available therapeutic agents. One of the most clinically important hypoestrogenic-related side effects is the loss in bone mineral density (BMD) that occurs over the course of treatment, and in some patients BMD loss may not be reversible.3 Concurrent “add back” hormonal therapy (e.g., northindrone acetate at 5 mg daily) has been shown to be effective in reducing this associated loss of BMD.3,4,5,6 Therefore, it may be possible to achieve a balance of efficacious relief of endometrial-related symptomatic pain, e.g., as measured by endometriosis symptom severity score (ESSS),7 and minimally associated BMD loss, without “add back” therapy, if an optimal range for estrogen suppression can be identified and targeted.
A model-based approach of quantifying this estrogen target range is reported herein. An existing, published multiscale, systems pharmacology model8 of calcium homeostasis and bone remodeling9 served as the foundation for modeling the BMD response. Extension of this model began by adding menopause-related estrogen effects on bone physiology, through interaction with transforming growth factor-β (TGF-β) and osteoblast signaling,10,11,12,13,14 and on renal-calcium handling.15,16 Translation was then completed to describe estradiol-related bone remodeling changes affected through GnRH modulation. Results were interpreted alongside a logistic regression-based analysis to concurrently evaluate efficacy (pain reduction) projected across a range of serum estradiol (E2) concentrations (Figure 1).
Figure 1.

Schematic of model-based approach for establishing gonadotropin-releasing hormone modulation study design options and targets.
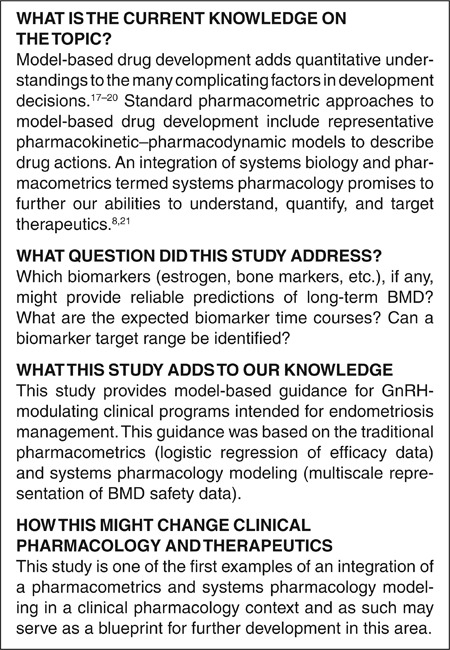
Three clinical development question-based goals leading into this analysis were (i) which biomarkers (estrogen, bone markers, etc.), if any, might provide reliable predictions of long-term BMD? (ii) what are the expected biomarker time courses? and (iii) can a biomarker target range be identified? The results indicated which system markers would sufficiently evaluate long-term BMD effects and the treatment duration required to initially estimate these expected changes. Ideally, this modeling provides a platform for future simulations, that could include compound-specific kinetic and dynamic considerations, to evaluate candidate drug and dosing selection scenarios. Overall, this integrated approach represents a synergy of multiscale systems pharmacology modeling and more traditional pharmacometrics analyses; this could serve as a case study for recent efforts to promote model-based drug development.8,17,18,19,20,21
Results
Data curation
Bone markers and BMD. Clinical data regarding menopause transition were available from a study relating the magnitude and time course of estrogen loss relative to the number of years around the final menstrual period.22 Two additional studies provided the magnitude and time course of estrogen effects on bone remodeling markers during the menopause transition23 and during postmenopausal estrogen replacement therapy (ERT).24 Urine cross-linked N-telopeptide of type I bone collagen (NTx) and bone-specific alkaline phosphatase (BSAP) were used as the markers of bone resorption (osteoclast function) and formation (osteoblast function), respectively. The bone marker data from the ERT study24 were rescaled such that their baseline was equal to the relative percentages after menopause from the first study;23 e.g., data on the expected increase in BSAP across menopause transition showed an increase from 8.7 to 13.2 ng/ml from peri to postmenopause,23 or an approximate increase to 151% of baseline. The ERT data, reported as mean percentage change from baseline,24 pertained to a postmenopausal population, and so it was assumed that these patients started at 151% of the model's baseline with rescaling of subsequent reported changes from this baseline. This created a contiguous data set for which the simultaneous effects of menopause transition and ERT could be estimated.
Fourteen14 double-blind studies met criteria of reporting serum estradiol (E2) and lumbar spine BMD results following GnRH agonist or antagonist treatment (≥6 months) from a literature-based database (publication years 1988–2012) of clinical endometriosis study results. Data from these studies were split into estimation and evaluation data sets. Studies (N = 5) selected for the estimation set were chosen to represent a range of E2 suppression and included relatively robust BMD collections. This data set included treatments with elagolix,25 leuprolide,4,6,26 and triptorelin27 and was used to estimate relative longitudinal effects of E2 suppression on lumbar spine BMD.
For summarization, treatment groups were assigned into three suppression categories assuming a typical baseline E2 of ~100 pg/ml, which was the approximate average screening value across studies.28,29,30 E2 was <15 pg/ml from each of the leuprolide and triptorelin treatment groups that did not include estradiol “add back.” These groups were assigned to the 90% suppression category. The elagolix 250 mg q.d. (E2 = 21 pg/ml)25 and the leuprolide + estradiol 2 mg/day + promegestone 0.5 mg (E2 = 27 pg/ml)6 treatment groups were assigned to the 80% suppression category; elagolix 150 mg q.d. (E2 = 41 pg/ml)25 was assigned to 60% suppression.
The nine remaining studies (evaluation set) met criteria of reporting E2 and 6-month BMD data; these also represented similar treatments as the estimation set including leuprolide,28,31 nafarelin,28,29,30 goserelin,5,32 and elagolix.33 These were used to evaluate lumbar spine BMD predictions at month 6.
ESSS. Total ESSS, the efficacy measure, was a summation of dysmenorrhea, dyspareunia, pelvic pain, pelvic tenderness, and induration scores (range: 0–12).7 Endometriosis patient-level ESSS and E2 measurements were available from nafarelin on-treatment regimens of three studies;30,34,35 each investigated nafarelin (200 mcg b.i.d.) administered for 3 or 6 months. On-treatment collections of E2 and ESSS (N = 1,354) were available from 499 patients. Median E2 and percentages of observations at each ESSS (0 through 12) were 0 (10.2 pg/ml, 27.3%), 1 (16.7 pg/ml, 21.9%), 2 (12.0 pg/ml, 17.6%), 3 (27.0 pg/ml, 11.4%), 4 (16.0 pg/ml, 8.3%), 5 (30.0 pg/ml, 5.4%), 6 (19.4 pg/ml, 3.5%), 7 (31.7 pg/ml, 2.2%), 8 (21.0 pg/ml, 1.4%), 9 (33.7 pg/ml, 0.6%), 10 (0.0 pg/ml, 0.1%), 11 (40.3 pg/ml, 0.2%), and 12 (36.9 pg/ml, 0.1%). ESSS total score was categorized with increasing pain as (0, 1, 2, 3, and≥4) (Supplementary Table S2 online).
Model development
Multiscale systems pharmacology model for bone markers and BMD. Longitudinal changes in endogenous estrogen (E), expressed as a relative fraction (E = 1 at baseline), were modeled using an ordinary differential equation (ODE) with first-order elimination (kout,E) and a zero-order endogenous production rate (kin,E) (Eq. 1); kout,E was assumed to have a 12-h half-life to provide a plausible representation of the elimination rate constants for various estrogen forms.
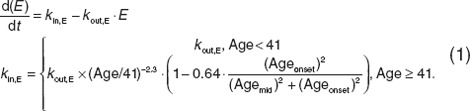 |
This mathematical description of estrogen loss due to senescence, with an added effect during menopause, was consistent with, but modified considerably from Burger et al.36 in its parameterization. For example, the Burger model was parameterized on a log-linear domain, whereas the model described herein described nonlinearity through proportional changes in the production rate constant (kin,E). The first term represented changes affected by general senescence using a simple power term ((Age/41)−2.3). The second effect, associated with a steeper decline during menopause transition, used a sigmoidal Emax relationship as a function of onset age. In this equation, age was contiguous patient age (years), Ageonset was time from start of menopause, and Agemid was the midpoint (0.83 years, total menopause duration = 1.66 years). The model, fit to clinical data,22 estimated an ~70% decline in natural estrogen 2 years after final menstrual period and thereafter with a more gradual decline (Figure 2a). Of note, Ageonset was set at a relatively early age as a centering reference value; actual onset age is more typically 51 years.22
Figure 2.
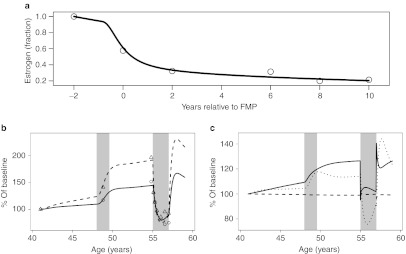
Estrogen-related effects from peri- through postmenopause. (a) Predicted fractional changes in estrogen during menopause transition (solid line). Time is relative to the final menstrual period. Observed data (circles) were taken from Sowers et al.22 (b) Predicted longitudinal changes in bone-specific alkaline phosphatase (BSAP) (solid line) and urine N-telopeptide of type I bone collagen (NTx) (dashed line), and (c) plasma calcium (dashed line), transforming growth factor-β≥(dotted line), and parathyroid hormone (solid line). Shaded area from age 48–49.6 years highlights the assumed duration of menopause. Shaded area from age 55–57 years represents the period of postmenopausal estrogen replacement therapy (ERT). Observed bone marker data (BSAP = circles, NTx = triangles) before ERT were taken from Garnero et al.,23 and data during estrogen replacement were taken from Bone et al.24 FMP, final menstrual period.
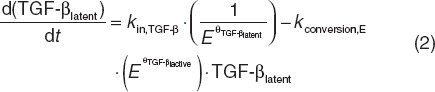
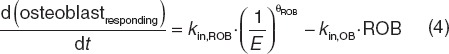
Within the construct of the previously reported multiscale systems pharmacology calcium-bone model,9 model components describing estrogen effects at several reported intercession points were investigated (Supplementary Data online). This included effects on latent and active TGF-β (Eqs. 2 and 3), responding osteoblasts (ROB, Eq. 4), active osteoblasts (Eq. 5), and the maximum decrease in the tubular reabsorption maximum for calcium renal excretion that were simultaneously fitted to the clinical data.23,24 These data included longitudinal bone marker measurements (NTx and BSAP). Aside from the parameter estimates reported below, all other model parameters were considered as system values and fixed at the previously reported values.9 This includes rate constants (simplified below) and initial conditions; for example, the rate constants (k) in Eqs. 2 and 3 are actually multivariate effects influenced by osteoblast and osteoclast function (Supplement Data online)9.
 |
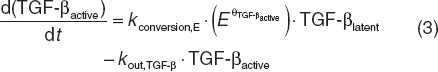 |
In Eqs. 2 and 3, the production rate constant (kin,TGF-β) for latent TGF-β was inversely related to E, and its rate constant for active TGF-β (kconversion,E) conversion was proportionally related with E, both through power functions. Estimates for TGF-β related power (unitless) parameters θTGF-β,latent and θTGF-β,active were 0.075 and 0.045, respectively.
 |
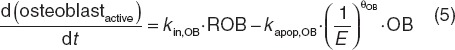 |
In Eqs. 4 and 5, the production rate constant (kin,ROB) for ROB was inversely related to E as was the rate constant for elimination of active osteoblasts (kapop,OB). Estimated osteoblast-related parameters θROB and θOB were 0.16 and 0.000012, respectively.
During postmenopausal ERT, the fraction of estrogen effect relative to premenopause estrogen was estimated. For example, an estimate of 0.5 would indicate that ERT represented a 50% return to premenopausal estrogen, whereas an estimate of 1.0 would indicate a complete return to premenopausal estrogen efficacy. This fraction was estimated to be 0.98. In addition, E was estimated to linearly decrease the urine calcium reabsorption maximum. The estimated slope equated to an ~8% decline in the tubular maximum with a 90% estrogen reduction.
These combined effects were predictive of observed changes in BSAP and NTx, both over the time course of menopause transition and during estrogen replacement in postmenopausal women (Figure 2b). In addition to the bone markers, the model predicted changes in extracellular calcium, parathyroid hormone, and urinary calcium excretion rate. Consistent with the physiologic requirements, predicted calcium concentrations remained within 2% of baseline values despite the marked shifts in exchange with bone calcium. This balance was maintained in part by the ~2.5-fold increase in calcium renal excretion rate from pre to postmenopause. The model also predicted a longitudinal parathyroid hormone increase, reflective of physiologic response to spare marked extracellular calcium fluctuations (Figure 2c).
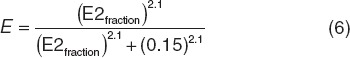
This extended multiscale model was then used to estimate GnRH-related changes in bone markers. To account for potential differences in estrogen moieties affected by GnRH modulation as compared with the just described menopausal-related affects, a scaling function relating E2 suppression fraction to E, as used in Eqs. 2–5, was included through a sigmoidal expression (Eq. 6). For example, E2 suppression levels of 90%, 80%, and 60% corresponded with E2fraction of 0.1, 0.2, and 0.4 and E values of 0.299, 0.647, and 0.887, respectively.
 |
In the multiscale model, the active osteoblast compartment described changes in BSAP, and an osteoclast compartment described changes in either NTx or serum c-telopeptide. E2 suppression effects on bone markers were used to estimate lumbar spine BMD changes (BMDspine) using an ODE (Eq. 7) with zero-order input (kin,BMD) and first-order elimination (kout,BMD). BMDspine production and elimination were affected by relative changes in osteoblast (BSAP) and osteoclast (serum c-telopeptide) function, respectively.
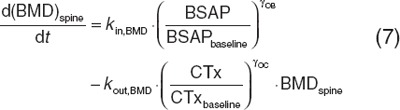 |
The parameters kout,BMD (0.140 (unitless)) and γOC (0.00953 d−1) were fit to the estimation data set; γOB was fixed at a previous estimate of 0.0739.37 Predictions were used to evaluate longitudinal changes in bone markers and BMD (Figure 3). In particular, the rate and magnitude of these changes determined if these markers would be useful early markers for short-term (1–3 month) clinical investigations (Figure 3, Supplementary Table S1 online). The model predictive check appeared to be in agreement with the evaluation data set observations (Figure 4).
Figure 3.
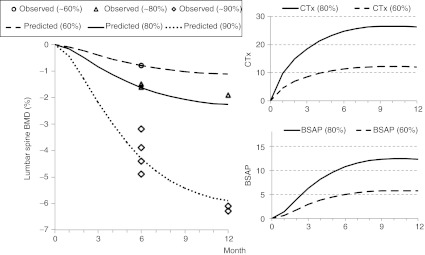
Estradiol suppression (%) effect on BMD and bone markers (serum c-telopeptide and bone-specific alkaline phosphatase). Predictions (lines) were from the multiscale model and observations (symbols) from the estimation data set. BMD, bone mineral density; BSAP, bone-specific alkaline phosphatase; CTx, serum c-telopeptide.
Figure 4.
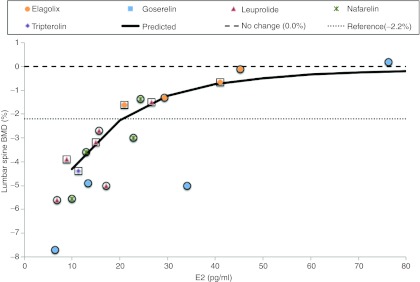
Relationship between estradiol and 6-month BMD changes from baseline. Prediction (line) is from the multiscale model and observations (symbols) from the combined estimation (squares) and evaluation (circles) data sets. BMD, bone mineral density; E2, estradiol.
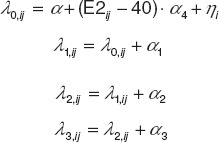
Logistic regression model for ESSS. Cumulative logit functions (λ0, λ1, λ2, and λ3; Eq. 1) included E2 measurements for each patient (i) and visit (j) and interindividual variance [ηi ~ normally independently distributed (0, σ2)]. Constants α0, α0 + α1, α0 + α1 + α2, and α0 + α1 + α2 + α3 determined baseline probabilities of ESSS = 0, ESSS ≤ 1, ESSS ≤ 2, and ESSS ≤ 3, respectively (Supplementary Data online).
 |
Probabilities of each ESSS categorical score were derived from cumulative probabilities with a sum of all probabilities equal to 1 (Eq. 2).
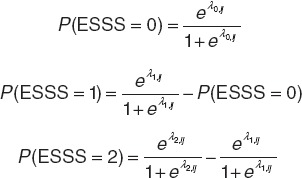 |
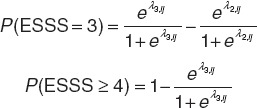 |
The logistic regression results (Table 1) provided a characterization of the E2–ESSS relationship. The probability of a patient experiencing a less severe score (e.g., ESSS = 0) was decreased with increased E2, and correspondingly the probability of greater severity (e.g., ESSS ≥ 4) was increased with increased E2 (Figure 5). From the model predictions, P(ESSS = 0) increased as E2 decreased from 80 pg/ml (23%) to 40 pg/ml (26%) to 20 pg/ml (29%) to 10 pg/ml (31%). Concurrently, the P(ESSS ≥ 4) decreased as E2 decreased from 80 pg/ml (27%) to 40 pg/ml (23%) to 20 pg/ml (19%) to 10 pg/ml (18%).
Table 1. Logistic regression estimates for estradiol-endometrial symptom severity score model.
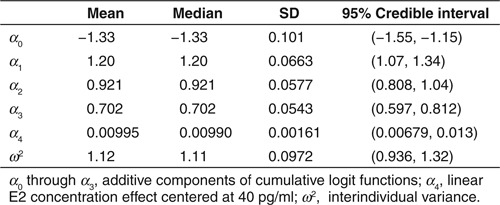
Figure 5.
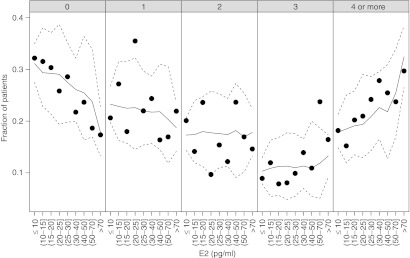
Observed (symbols) and predicted (median = solid line; 95% credible interval = dashed lines) probabilities of each endometrial symptom severity score category (per panel heading) relative to serum estradiol (E2). Predictions are from the logistic regression model.
An overlay of BMD and ESSS predictions relative to E2 provided for comparative responses at potential target E2 ranges has been shown in Figure 6. This comparison revealed the relative steepness in BMD loss as E2 concentrations approach and fall below 20 pg/ml compared with a relatively constant (linear) improvement in ESSS across the E2 range. E2 between 20 and 40 pg/ml was therefore considered a reasonable target to evaluate efficacious endometrial pain response while minimizing BMD effects.
Figure 6.

Comparison of predicted endometrial symptom severity score (ESSS) probabilities (highest and lowest categories) and lumbar spine bone mineral density (BMD) relative to serum estradiol (E2). ESSS model predictions represent the median probabilities from the ordered categorical logistic regression model; BMD predictions were taken from the deterministic multiscale systems pharmacology model.
Discussion
The combined approach of modeling both efficacy (ESSS) and safety (BMD) of GnRH modulation, as functions of E2, supported clinical trial designs with respect to treatment duration required to observe changes in various efficacy and bone-related biomarkers. These models helped to identify which, if any, of the bone biomarkers would offer an early, sensitive measure of long-term BMD outcomes and a target range for selected marker response. For example, estrogen suppression level of 80% was predicted to cause less than a 25% change in bone markers; neither substantive marker nor BMD changes were predicted before 3 months from the start of treatment (Supplementary Table S1 online, Figure 3). Continuous suppression of estrogen by 80% for 6 months was expected to cause a 2% BMD loss, nearly double the rate of loss during menopause.38 Expected BMD loss was perhaps more acceptable (~1%) from 60% suppression, but because of relatively minimal bone marker changes from this suppression level, it is unlikely that they would serve as useful biomarkers to differentiate efficacy and tolerability.
By contrast, E2 concentrations themselves appeared to be direct, sensitive markers of both responses. Maximal E2 suppression typically occurs within 1–2 months of treatment;28,39 E2 may serve as an early marker for safety and dose ranging studies of investigational GnRH-modulator therapies. An E2 suppression target >20 pg/ml with an upper range near 40 pg/ml was expected to provide an ESSS improvement whereas limiting untoward effects on 6-month BMD, on average, to <2% decline. This model-based approach provided a quantitative framework for research efforts focused on mechanisms that modulate E2 levels. Furthermore, based on the apparent reliability of E2 and lack of early sensitivity for the bone markers, model predictions supported decisions to limit investments in novel BMD biomarkers for this mechanism. Notably, bone marker changes are related to the affecting mechanism. Markers of osteoclast function, for example, undergo near maximal changes within the first month following denosumab administration.40 The usefulness of bone markers, therefore, is mechanism dependent.
Regarding the requirement of applying the multiscale, systems pharmacology model in this setting, it can be argued that a more empiric model could have been developed linking E2 concentrations with BMD changes from baseline. Such a model would have probably provided similar recommendations for target E2 range for minimizing BMD loss. That approach, however, would not have provided a simultaneous understanding and quantification of each of the many interrelated mechanisms, controls, and associated biomarkers involved in this regulation, nor would it have allowed for the longitudinal predictions that were used for the biomarker evaluations. The range of scales determined the choice of model used as the foundation for this analysis. For example, there are several published models of calcium homeostasis41 and bone remodeling,42,43,44 but estrogen affects both calcium balance and bone health. These affected sites were already included in the model that was extended in this analysis9 enabling efficient translation of the estrogen-related effects.
The model extension to include estrogen-related effects on bone dynamics provided predictions of clinical changes occurring during the transition through menopause, during postmenopausal ERT, and in this highlighted case, during therapeutic intervention for endometriosis treatment. Estrogen withdrawal, caused naturally during menopause, through discontinuation of postmenopausal estrogen replacement or as an intended pharmacologic effect of GnRH modulation, increases bone turnover and decreases BMD. Conversely, postmenopausal ERT decreases net bone resorption and increases BMD. Data pertaining to each situation were therefore used to characterize the proposed estrogen-related mechanisms that impact bone remodeling. Of note, the model extension describing estrogen-related effects in postmenopausal women was translatable to similar effects of estradiol reduction in a typically younger, premenopausal patient population with endometriosis. This indicates similarities in system parameters between these populations and any differences were possibly accounted for by scaling between E2 and E (Eq. 6).
Notably, the current assessment did not consider the likelihood (e.g., expected percentages) of diverse patient populations individually achieving this target. For such an exercise, pharmacokinetic and response (pharmacodynamic) variability could be included within Monte Carlo simulations to determine prediction intervals for E2 and BMD. A result of such a simulation could be the expected accuracy and precision of this mechanism (GnRH modulation) for achieving a target E2 range, i.e., to quantify the potential challenge of individually targeting E2 in a diverse patient population. In other words, the relative steepness of the BMD response through lower regions of E2 (Figure 6), in context with compound-specific pharmacokinetic and pharmacodynamic variability, may challenge the viability of this therapeutic target.
Regarding the multiscale model, a noted limitation is a lack of precision estimates for the model parameters, which are not reported by the software program (Berkeley Madonna, Berkeley, CA) used to fit the model parameters. Ongoing research includes porting the model to software that will provide estimates of parameter uncertainty as well as allow for nested variance structures. Still, in its current state, this model extension preserves the structure and parameter estimates from the previously reported model,9 thereby highlighting its extensibility whereas retaining its ability to describe the previously described therapeutic interventions and disease states.37 The logistic analysis was likewise useful in predicting that efficacious responses were possible with less than maximal suppression of E2. The integration of the models provided a target for future clinical investigation. During these studies, additional validated and exploratory endometriosis end points can be assessed; for example, daily collections including the initiative on methods, measurement, and pain assessment in clinical trials (IMMPACT II).45
In summary, E2, measured as early as 1–2 months after treatment initiation, was shown to be a reliable predictor of 6-month BMD change. On the contrary, bone marker changes affected through GnRH inhibition were projected to change too slowly to provide reliable dose differentiation; for example, these markers would likely require at least 3 months to show marked differences. Doses within a GnRH antagonist development program that target E2 in the range of >20–40 pg/ml were expected to provide an evaluable range for efficacious endometrial response while minimizing BMD effects. This model-based approach provided a quantitative framework for preclinical and clinical research efforts focused on mechanisms that modulate E2 levels. As far as the authors were aware at the time of this manuscript's preparation, this study is one of the first peer-reviewed, published examples of an integration of a pharmacometrics and systems pharmacology model in a clinical pharmacology context and as such may serve as a blueprint for further development in this area.
Methods
Data curation
Bone markers and BMD. Literature data were used for model development and estimation of estrogen-related effects on bone markers and BMD. Potential literature sources of data pertaining to menopause transition were identified in PubMed (http://www.ncbi.nlm.nih.gov/pubmed/) using combinations of search terms: “estrogen,” “menopause,” “osteoporosis,” “bone turnover,” “final menstrual period,” “alkaline phosphatase,” and “telopeptide.” Reports were reviewed under the requirement that associated longitudinal changes in estrogen and bone markers during the transition through menopause and/or during postmenopausal ERT were reported. Graphical data were digitized using Plot Digitizer 2.4.1 (http://plotdigitizer.sourceforge.net/).
An additional literature-based database was constructed previously (publication years 1988–2012) to include data pertaining to clinical endometriosis study results. Database studies were included in the current analysis if they reported serum estradiol (E2), lumbar spine BMD results, and included ≥6 months GnRH agonist or antagonist treatment.
ESSS. Individual, patient-level ESSS, and E2 measurements were used from the nafarelin on-treatment regimens of three studies.30,34,35 Each study investigated nafarelin (200 mcg b.i.d.) administered for 3 or 6 months to patients with endometriosis.
Model development
Multiscale systems pharmacology model for bone markers and BMD. The underlying multiscale model included 29 ODEs describing the kinetic interrelations and functions of calcium and phosphate (oral absorption, vasculature, bone, and renal excretion), calcitriol, parathyroid gland, parathyroid hormone, 1-α-hydroxylase, ROB, osteoblasts, osteoclast, latent and active TGF-β, RANK, RANKL, OPG, and intracellular signaling factors (runt-related transcription factor 2, cAMP response element binding, B-cell chronic lymphocytic leukemia/lymphoma 2).9
Direct effects of estrogen were considered on production rates of latent and active TGF-β, as well as effects on osteoblast differentiation from progenitor cells and osteoblast survival. Estrogen was modeled to affect the urine calcium reabsorption tubular maximum linearly. The slope relating this change with the relative fraction of estrogen was parameterized to provide the expected fractional decrease in the reabsorption tubular maximum that corresponded to a 90% decline in estrogen.
Parameters relating the magnitude and time course of estrogen loss relative to the number of years around the final menstrual period were estimated from clinical data.22 Using this natural loss function, parameters relating estrogen effects on calcium balance and bone remodeling were estimated using additional clinical (bone marker) data.23,24 The relative E2 suppression fraction was then introduced into this extended multiscale model to estimate bone marker changes and BMD. An ODE was included to describe lumbar spine BMD change over time as a function of bone marker changes, as used earlier,37 and parameters were fit to the endometriosis estimation data set. BMD predictions from this model fit were then compared with the external evaluation data set.
Model fitting and simulation was performed using Berkeley Madonna 8.0 (http://berkeleymadonna.com). ODEs were solved using the available fixed step size integration algorithm (Fourth-order Runge–Kutta algorithm).
Logistic regression model for ESSS. ESSS was viewed as a probabilistic, ordered categorical outcome and analyzed using a logistic regression model46 implemented in WinBUGS 1.4.47
The open source software package R version 2.12.2 (R Foundation for Statistical Computing, Vienna, Austria)48 was used for the graphics generation and data management.
Author Contributions
M.M.R., M.B., S.W.M., and P.H.V.D.G. designed the research. M.M.R., M.B., S.W.M., and P.H.V.D.G. wrote the manuscript. M.M.R. and M.B. analyzed the data. M.M.R. and M.B. contributed new analytical tools.
Conflict of Interest
The clinical patient-level study data reported in this article were obtained from studies owned by Pfizer. M.M.R. is an employee of Metrum Research Group LLC and served as a paid consultant to Pfizer. S.W.M., M.B., and P.H.V.D.G. are employees of Pfizer. CPT:PSP Editor-in-Chief P.H.V.D.G. was not involved in the review or decision process for this article.
Study Highlights
Acknowledgments
Pfizer and Metrum Research Group LLC provided financial support for the analyses reported in this article.
Supplementary Material
References
- Mahmood T.A., &, Templeton A. Prevalence and genesis of endometriosis. Hum. Reprod. 1991;6:544–549. doi: 10.1093/oxfordjournals.humrep.a137377. [DOI] [PubMed] [Google Scholar]
- Surrey E.S., &, Hornstein M.D. Prolonged GnRH agonist and add-back therapy for symptomatic endometriosis: long-term follow-up. Obstet. Gynecol. 2002;99:709–719. doi: 10.1016/s0029-7844(02)01945-2. [DOI] [PubMed] [Google Scholar]
- Pierce S.J., Gazvani M.R., &, Farquharson R.G. Long-term use of gonadotropin-releasing hormone analogs and hormone replacement therapy in the management of endometriosis: a randomized trial with a 6-year follow-up. Fertil. Steril. 2000;74:964–968. doi: 10.1016/s0015-0282(00)01537-5. [DOI] [PubMed] [Google Scholar]
- Hornstein M.D., Surrey E.S., Weisberg G.W., &, Casino L.A. Leuprolide acetate depot and hormonal add-back in endometriosis: a 12-month study. Lupron Add-Back Study Group. Obstet. Gynecol. 1998;91:16–24. doi: 10.1016/s0029-7844(97)00620-0. [DOI] [PubMed] [Google Scholar]
- Franke H.R., van de Weijer P.H., Pennings T.M., &, van der Mooren M.J. Gonadotropin-releasing hormone agonist plus “add-back” hormone replacement therapy for treatment of endometriosis: a prospective, randomized, placebo-controlled, double-blind trial. Fertil. Steril. 2000;74:534–539. doi: 10.1016/s0015-0282(00)00690-7. [DOI] [PubMed] [Google Scholar]
- Fernandez H., Lucas C., Hédon B., Meyer J.L., Mayenga J.M., &, Roux C. One year comparison between two add-back therapies in patients treated with a GnRH agonist for symptomatic endometriosis: a randomized double-blind trial. Hum. Reprod. 2004;19:1465–1471. doi: 10.1093/humrep/deh250. [DOI] [PubMed] [Google Scholar]
- Biberoglu K.O., &, Behrman S.J. Dosage aspects of danazol therapy in endometriosis: short-term and long-term effectiveness. Am. J. Obstet. Gynecol. 1981;139:645–654. doi: 10.1016/0002-9378(81)90478-6. [DOI] [PubMed] [Google Scholar]
- Riggs M.M. Multiscale systems models as a knowledge bridge between biology, physiology, and pharmacology. AAPS Newsmagazine. 2011. pp. 17–21.
- Peterson M.C., &, Riggs M.M. A physiologically based mathematical model of integrated calcium homeostasis and bone remodeling. Bone. 2010;46:49–63. doi: 10.1016/j.bone.2009.08.053. [DOI] [PubMed] [Google Scholar]
- Spelsberg T.C., Subramaniam M., Riggs B.L., &, Khosla S. The actions and interactions of sex steroids and growth factors/cytokines on the skeleton. Mol. Endocrinol. 1999;13:819–828. doi: 10.1210/mend.13.6.0299. [DOI] [PubMed] [Google Scholar]
- Yang N.N.et al. Estrogen and raloxifene stimulate transforming growth factor-β 3 gene expression in rat bone: a potential mechanism for estrogen- or raloxifene-mediated bone maintenance Endocrinology 1372075–2084.1996 [DOI] [PubMed] [Google Scholar]
- McCarthy T.L., Chang W.Z., Liu Y., &, Centrella M. Runx2 integrates estrogen activity in osteoblasts. J. Biol. Chem. 2003;278:43121–43129. doi: 10.1074/jbc.M306531200. [DOI] [PubMed] [Google Scholar]
- Khosla S. Estrogen and the death of osteoclasts: a fascinating story. BoneKey Osteovision. 2007;4:267–272. [Google Scholar]
- Hawse J.R., Subramaniam M., Ingle J.N., Oursler M.J., Rajamannan N.M., &, Spelsberg T.C. Estrogen-TGF-β cross-talk in bone and other cell types: role of TIEG, Runx2, and other transcription factors. J. Cell. Biochem. 2008;103:383–392. doi: 10.1002/jcb.21425. [DOI] [PMC free article] [PubMed] [Google Scholar]
- Nordin B.E.et al. A longitudinal study of bone-related biochemical changes at the menopause Clin. Endocrinol. (Oxf) 61123–130.2004 [DOI] [PubMed] [Google Scholar]
- Dick I.M., Devine A., Beilby J., &, Prince R.L. Effects of endogenous estrogen on renal calcium and phosphate handling in elderly women. Am. J. Physiol. Endocrinol. Metab. 2005;288:E430–E435. doi: 10.1152/ajpendo.00140.2004. [DOI] [PubMed] [Google Scholar]
- Lalonde R.L.et al. Model-based drug development Clin. Pharmacol. Ther 8221–32.2007 [DOI] [PubMed] [Google Scholar]
- Bies R.R., Gastonguay M.R., &, Schwartz S.L. Mathematics for understanding disease. Clin. Pharmacol. Ther. 2008;83:904–908. doi: 10.1038/clpt.2008.53. [DOI] [PubMed] [Google Scholar]
- Goldberger M.J.et al. ASCPT Task Force for advancing pharmacometrics and integration into drug development Clin. Pharmacol. Ther 88158–161.2010 [DOI] [PubMed] [Google Scholar]
- Sorger P.K.et al. Quantitative and systems pharmacology in the post-genomic era: new approaches to discovering drugs and understanding therapeutic mechanismsWhite paper, QSP Workshop Group, 2011
- Berg J.M., Rogers M.E., &, Lyster P.M. Systems biology and pharmacology. Clin. Pharmacol. Ther. 2010;88:17–19. doi: 10.1038/clpt.2010.69. [DOI] [PubMed] [Google Scholar]
- Sowers M.R., Zheng H., McConnell D., Nan B., Harlow S.D., &, Randolph J.F., Jr Estradiol rates of change in relation to the final menstrual period in a population-based cohort of women. J. Clin. Endocrinol. Metab. 2008;93:3847–3852. doi: 10.1210/jc.2008-1056. [DOI] [PMC free article] [PubMed] [Google Scholar]
- Garnero P., Sornay-Rendu E., Chapuy M.C., &, Delmas P.D. Increased bone turnover in late postmenopausal women is a major determinant of osteoporosis. J. Bone Miner. Res. 1996;11:337–349. doi: 10.1002/jbmr.5650110307. [DOI] [PubMed] [Google Scholar]
- Bone H.G.et al. Alendronate and estrogen effects in postmenopausal women with low bone mineral density. Alendronate/estrogen study group J. Clin. Endocrinol. Metab 85720–726.2000 [DOI] [PubMed] [Google Scholar]
- Abbott Efficacy and safety study of NBI-56418 sodium in subjects with endometriosis . < http://ClinicalTrials.gov > ( 2012
- Matsuo H. Prediction of the change in bone mineral density induced by gonadotropin-releasing hormone agonist treatment for endometriosis. Fertil. Steril. 2004;81:149–153. doi: 10.1016/j.fertnstert.2003.05.022. [DOI] [PubMed] [Google Scholar]
- Borderie D., Cherruau B., Dougados M., Ekindjian O.G., &, Roux C. Biochemical markers as predictors of bone mineral density changes after GnRH agonist treatment. Calcif. Tissue Int. 1998;62:21–25. doi: 10.1007/s002239900388. [DOI] [PubMed] [Google Scholar]
- Agarwal S.K., Hamrang C., Henzl M.R., &, Judd H.L. Nafarelin vs. leuprolide acetate depot for endometriosis. Changes in bone mineral density and vasomotor symptoms. Nafarelin Study Group. J. Reprod. Med. 1997;42:413–423. [PubMed] [Google Scholar]
- Tahara M., Matsuoka T., Yokoi T., Tasaka K., Kurachi H., &, Murata Y. Treatment of endometriosis with a decreasing dosage of a gonadotropin-releasing hormone agonist (nafarelin): a pilot study with low-dose agonist therapy (“draw-back” therapy) Fertil. Steril. 2000;73:799–804. doi: 10.1016/s0015-0282(99)00636-6. [DOI] [PubMed] [Google Scholar]
- Hornstein M.D., Yuzpe A.A., Burry K.A., Heinrichs L.R., Buttram V.L., Jr, Orwoll E.S. Prospective randomized double-blind trial of 3 versus 6 months of nafarelin therapy for endometriosis associated pelvic pain. Fertil. Steril. 1995;63:955–962. [PubMed] [Google Scholar]
- Surrey E.S., &, Judd H.L. Reduction of vasomotor symptoms and bone mineral density loss with combined norethindrone and long-acting gonadotropin-releasing hormone agonist therapy of symptomatic endometriosis: a prospective randomized trial. J. Clin. Endocrinol. Metab. 1992;75:558–563. doi: 10.1210/jcem.75.2.1386374. [DOI] [PubMed] [Google Scholar]
- Soysal S., Soysal M.E., Ozer S., Gul N., &, Gezgin T. The effects of post-surgical administration of goserelin plus anastrozole compared to goserelin alone in patients with severe endometriosis: a prospective randomized trial. Hum. Reprod. 2004;19:160–167. doi: 10.1093/humrep/deh035. [DOI] [PubMed] [Google Scholar]
- Neurocrine Biosciences Safety and efficacy study of NBI-56418 in endometriosis (PETAL) . < http://ClinicalTrials.gov > ( 2009
- The Nafarelin European Endometriosis Trial Group (NEET) Nafarelin for endometriosis: a large-scale, danazol-controlled trial of efficacy and safety, with 1-year follow-up. Fertil. Steril. 1992;57:514–522. [PubMed] [Google Scholar]
- Adamson G.D., Kwei L., &, Edgren R.A. Pain of endometriosis: effects of nafarelin and danazol therapy. Int. J. Fertil. Menopausal Stud. 1994;39:215–217. [PubMed] [Google Scholar]
- Burger H.G.et al. Prospectively measured levels of serum follicle-stimulating hormone, estradiol, and the dimeric inhibins during the menopausal transition in a population-based cohort of women J. Clin. Endocrinol. Metab 844025–4030.1999 [DOI] [PubMed] [Google Scholar]
- Riggs M.M., Peterson M.C., &, Gastonguay M.R. Multiscale physiology-based modeling of mineral bone disorder in patients with impaired kidney function. J. Clin. Pharmacol. 2012;52:45S–53S. doi: 10.1177/0091270011412967. [DOI] [PubMed] [Google Scholar]
- Pouilles J.M., Tremollieres F., &, Ribot C. The effects of menopause on longitudinal bone loss from the spine. Calcif. Tissue Int. 1993;52:340–343. doi: 10.1007/BF00310195. [DOI] [PubMed] [Google Scholar]
- Amama E.A., Taga M., &, Minaguchi H. The effect of gonadotropin-releasing hormone agonist on type I collagen C-telopeptide and N-telopeptide: the predictive value of biochemical markers of bone turnover. J. Clin. Endocrinol. Metab. 1998;83:333–338. doi: 10.1210/jcem.83.2.4565. [DOI] [PubMed] [Google Scholar]
- McClung M.R., AMG 162 Bone Loss Study Group et al. Denosumab in postmenopausal women with low bone mineral density. N. Engl. J. Med. 2006;354:821–831. doi: 10.1056/NEJMoa044459. [DOI] [PubMed] [Google Scholar]
- Raposo J.F., Sobrinho L.G., &, Ferreira H.G. A minimal mathematical model of calcium homeostasis. J. Clin. Endocrinol. Metab. 2002;87:4330–4340. doi: 10.1210/jc.2002-011870. [DOI] [PubMed] [Google Scholar]
- Lemaire V., Tobin F.L., Greller L.D., Cho C.R., &, Suva L.J. Modeling the interactions between osteoblast and osteoclast activities in bone remodeling. J. Theor. Biol. 2004;229:293–309. doi: 10.1016/j.jtbi.2004.03.023. [DOI] [PubMed] [Google Scholar]
- Post T.M., Cremers S.C., Kerbusch T., &, Danhof M. Bone physiology, disease and treatment: towards disease system analysis in osteoporosis. Clin. Pharmacokinet. 2010;49:89–118. doi: 10.2165/11318150-000000000-00000. [DOI] [PubMed] [Google Scholar]
- Schmidt S., Post T.M., Peletier L.A., Boroujerdi M.A., &, Danhof M. Coping with time scales in disease systems analysis: application to bone remodeling. J. Pharmacokinet. Pharmacodyn. 2011;38:873–900. doi: 10.1007/s10928-011-9224-2. [DOI] [PMC free article] [PubMed] [Google Scholar]
- Vincent K., Kennedy S., &, Stratton P. Pain scoring in endometriosis: entry criteria and outcome measures for clinical trials. Report from the Art and Science of Endometriosis meeting. Fertil. Steril. 2010;93:62–67. doi: 10.1016/j.fertnstert.2008.09.056. [DOI] [PMC free article] [PubMed] [Google Scholar]
- Agresti A. John Wiley & Sons: New York; 1990. Categorical Data Analysis. [Google Scholar]
- Lunn D.J., Thomas A.,, Best N., &, Spiegelhalter D. WinBUGS—a Bayesian modelling framework: concepts, structure, and extensibility. Stat. Comput. 2000;10:325–337. [Google Scholar]
- R Development Core Team . R Foundation for Statistical Computing, Vienna, Austria; 2008. R: a language and environment for statistical computing. [Google Scholar]
Associated Data
This section collects any data citations, data availability statements, or supplementary materials included in this article.