

Abstract
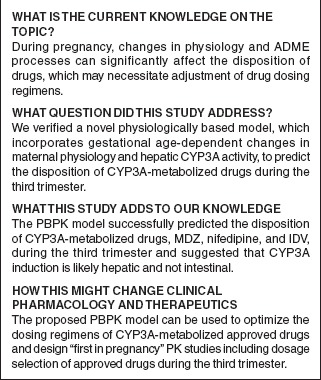
Besides logistical and ethical concerns, evaluation of safety and efficacy of medications in pregnant women is complicated by marked changes in pharmacokinetics (PK) of drugs. For example, CYP3A activity is induced during the third trimester (T3). We explored whether a previously published physiologically based pharmacokinetic (PBPK) model could quantitatively predict PK profiles of CYP3A-metabolized drugs during T3, and discern the site of CYP3A induction (i.e., liver, intestine, or both). The model accounted for gestational age-dependent changes in maternal physiological function and hepatic CYP3A activity. For model verification, mean plasma area under the curve (AUC), peak plasma concentration (Cmax), and trough plasma concentration (Cmin) of midazolam (MDZ), nifedipine (NIF), and indinavir (IDV) were predicted and compared with published studies. The PBPK model successfully predicted MDZ, NIF, and IDV disposition during T3. A sensitivity analysis suggested that CYP3A induction in T3 is most likely hepatic and not intestinal. Our PBPK model is a useful tool to evaluate different dosing regimens during T3 for drugs cleared primarily via CYP3A metabolism.
Pregnant women and their fetuses are orphan populations with respect to the safety and efficacy of drugs. Recent statistics indicate that 64% of pregnant women ingest at least one medication for the treatment of a variety of clinical conditions, including viral (e.g., HIV), fungal, or bacterial infections, smoking cessation, epilepsy, or pregnancy-induced conditions such as hypertension, depression, and diabetes.1,2 For the large majority of drugs used during pregnancy, there is limited or no information available regarding whether pregnant women have altered pharmacokinetics or dosage requirement.3 Therefore, prescription drugs are routinely used off-label during pregnancy, i.e., without the necessary clinical data about the dose, maternal–fetal pharmacokinetics (PK), or efficacy of the drug in pregnant women. Determining the magnitude of change in PK caused by pregnancy is important to design evidence-based dosing regimen of drugs for pregnant women.
To avoid surveying all the drugs consumed by pregnant women, one can study the magnitude of changes, induced by various stages of pregnancy, in the processes of drug absorption (e.g., gastric pH, transporters), distribution (e.g., plasma protein binding and transporters), metabolism (e.g., cytochrome P450 (CYP) metabolism), and excretion (e.g., renal secretion via transporters) (ADME) of drugs. Specifically, the rate of absorption of drugs does not appear to be altered to a significant extent in pregnant women, as suggested by similar antepartum vs. postpartum/nonpregnant Tmax values and none-to-modest changes in the half-lives of drugs.4,5,6 However, the extent of presystemic elimination might be greater or lower, depending on the contributing pathway of elimination (e.g., CYPs or transporters), which then results in a lower (more likely) or higher peak plasma concentration (Cmax) in this population. Increased plasma volume and decreased plasma protein binding can alter the apparent volume of distribution (Vd) of drugs. Through changes in Vd and clearance, pregnancy can cause increases or decreases in the terminal elimination half-life of drugs. The renal excretion of unchanged drugs is increased during pregnancy due to increased glomerular filtration rate and also possibly increased renal secretion via transporters.7 On the other hand, the change in maternal hepatic enzyme activity is CYP isoform specific. Several groups have used model (probe) drugs that report CYP enzyme activities to delineate the magnitude of change in activity of major CYP enzymes, mostly during the third trimester (e.g., caffeine for CYP1A2, midazolam (MDZ) for CYP3A, metoprolol for CYP2D6, and phenytoin for CYP2C9).7 However, this approach has limitations in that some probe drugs (e.g., MDZ) cannot be safely and logistically administered to pregnant women during early gestational age if they are not of therapeutic benefit to the woman.
In consideration of the ethical and logistical barrier to include pregnant women in clinical trials, physiologically based pharmacokinetic (PBPK) modeling and simulation based on mechanistic studies have begun to gain attention as a promising approach to predict drug disposition in this population.8,9 Under the overarching umbrella of “systems pharmacology,” PBPK modeling has the advantage of incorporating both physiological parameters that are important for ADME processes and drug-specific parameters (e.g., physico-chemical and drug disposition characteristics) into a quantitative predictive model8,10 and has been used in drug development and regulatory review.11 In comparison to a static approach, a dynamic approach, i.e., PBPK modeling has added benefits in that it can (i) handle drugs with nonlinear kinetics (e.g., indinavir, IDV), (ii) quantitatively predict Cmax and trough plasma concentration (Cmin), which are sometimes correlated with the pharmacodynamic effects (safey/efficacy) of drugs, (iii) make it possible to predict, in the future, time-dependent fetal drug exposure; and (iv) provide an integrative platform to evaluate drug dosing regimens for pregnant women as the only required input is drug-specific parameters.
Despite the advantages of PBPK models outlined above, until recently, no model existed that allowed prediction of maternal–fetal disposition of drugs that is drug- and gestational age-independent. Abduljalil et al. and Lu et al. recently proposed a maternal PBPK model, incorporating known physiological parameters and maternal hepatic CYP activity in each trimester.12,13,14 Changes in these CYP activities were described based on urinary metabolic ratio (UR) of dextromethorphan (DEX: CYP3A and 2D6) and salivary caffeine clearance (CYP1A2). Although DEX UR is an acceptable measure of CYP2D6/3A for the nonpregnant population, it is not an adequate measure of these activities in the presence of CYP induction such as during pregnancy.15 This is because metabolic ratios are known to be dependent on changes in the renal function,16 which is likely to be induced during pregnancy alongside any induction of CYP2D6 and 3A. Therefore, we replaced the third trimester (T3) DEX data with more reliable CYP3A activity data based on oral clearance of the validated probe drug, MDZ.4 However, the use of MDZ is also complicated by the fact that it reflects a combination of both hepatic and intestinal CYP3A activity. The site (hepatic, intestinal, or both) of CYP3A induction during pregnancy is expected to have differential impact on the bioavailability and disposition of various orally administered drugs which are metabolized by CYP3A. For example, if only intestinal CYP3A is induced during pregnancy, then only the disposition of those drugs significantly extracted by the intestine will be affected (i.e., low-intermediate intestinal bioavailability, Fg). By contrast, if hepatic CYP3A activity is induced, the disposition of all CYP3A drugs will be affected by pregnancy due to increased metabolic clearance and decreased hepatic bioavailability (Fh). However, the site of CYP3A induction cannot be inferred from in vivo studies in pregnant women due to the fact that almost all PK studies conducted in this population are conducted after oral dosing.
The aims of our study were twofold: first, to test whether the refined PBPK model populated with CYP3A activity change based on oral clearance of MDZ could accurately predict the T3 disposition of other CYP3A-metabolized drugs, namely nifedipine (NIF) and IDV. Second, to use PBPK modeling to discern the site of CYP3A induction in pregnancy. This was possible because the drugs included in the verification set, MDZ, NIF, and IDV are associated with different extent of CYP3A metabolism in the intestine and the liver.
Results
Midazolam
The disposition kinetics of MDZ following a single oral dose of 2 mg was evaluated in 13 women during T3 and postpartum.4 The initial model based on DEX data,12 predicted mean area under the curve (AUC) ratio (AUCR, PP:T3) of 1.6, mean Cmax ratio (PP:T3) of 1.8, and mean Cmin ratio (PP:T3) of 1.6, whereas the observed ratios were 1.9,1.5, and 2.7, respectively (Figure 1a).4 The initial model prediction of AUCR (PP:T3) and Cmax ratio (PP:T3), but not Cmin ratio (PP:T3), passed the predefined verification criterion (0.80≤pred./obs.≤1.25, described in Methods section) (Figure 2). On the basis of the reported change in 1′-hydroxymidazolam unbound formation clearance assessed during T3 and postpartum,4 the initial model was refined to account for 99% induction of hepatic 3A activity during T3. The refined model-predicted mean AUCR (PP:T3) of 2.3, mean Cmax ratio (PP:T3) of 2.3, and mean Cmin ratio (PP:T3) of 2.3 (Figure 1a). Prediction of AUCR (PP:T3) and Cmin ratio (PP:T3) passed the verification criterion (Figure 2). However, the refined model failed the verification criterion when predicting Cmax ratio (PP:T3) (Figure 2).
Figure 1.

Comparison of observed and predicted plasma concentration–time profiles of midazolam and nifedipine. (a) Simulated and observed plasma concentration-time profiles of midazolam (MDZ) after a single oral dose of 2 mg during third trimester (T3) and postpartum (PP). The solid black line represents predicted mean postpartum profile. The gray dashed line represents predicted mean T3 profile using initial model based on dextromethorphan urinary metabolic ratio data, and the black dashed line represents predicted mean T3 profile using the refined model based on MDZ oral clearance data. Mean observed data4 are overlaid (filled circles: postpartum profile; closed circles: T3 profile). Error bars represent SD. In the inset, predicted and observed pharmacokinetics (PK) profiles are plotted on a logarithmic scale. (b) Simulated and observed plasma concentration-time profiles of nifedipine at steady state (10 mg p.o. q.i.d.) during third trimester (T3) and postpartum (PP). The solid black line represents predicted mean postpartum profile. The gray dashed line represents predicted mean T3 profile using the initial model, and the black dashed line represents predicted mean T3 profile using the refined model. Mean observed data are overlaid (filled circles: historical control profile taken from refs. 18,32,33,34; closed circles: T3 profile taken from ref. 17. Error bars represent SD. In the inset, predicted and observed PK profiles are plotted on a logarithmic scale.
Figure 2.
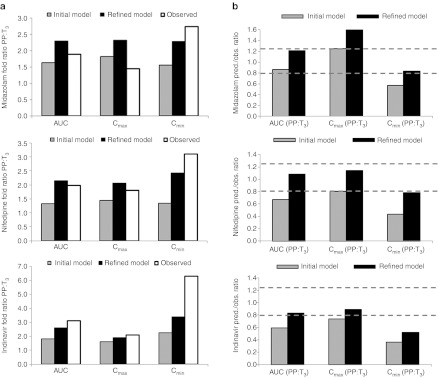
Comparison of initial (based on dextromethorphan data) vs. refined (based on MDZ data) model performance as gauged by predicted (pred.)/observed (obs.) ratio of mean area under the curve ratio (AUCR) (PP:T3), mean peak plasma concentration (Cmax) ratio (PP:T3), and mean trough plasma concentration (Cmin) ratio (PP:T3). (a) The gray bars represent predicted AUCR, Cmax ratio, and Cmin ratio using the initial model and the black bars represent predicted AUCR, Cmax ratio, and Cmin ratio using the refined model. The white bars represent observed AUCR, Cmax ratio, and Cmin ratio. (b) The gray bars represent pred./obs. ratio using the initial model and the black bars represent pred./obs. ratio using the refined model. The dashed gray lines bracket the range of values that fall within the verification criterion. Midazolam (MDZ): observed mean AUCR, Cmax ratio, and Cmin ratio (sample taken at last time-point) calculated from ref. 4. Nifedipine: observed mean AUCR, Cmax ratio, and Cmin ratio calculated from mean T3 AUC0-tau, Cmax, and Cmin from ref. 17, and weighted mean AUC0-tau, Cmax, and Cmin in nonpregnant historical controls from refs. 18,32,33,34. Indinavir: observed mean AUCR, Cmax ratio, and Cmin ratio extracted from ref. 5.
Nifedipine
Prevost et al. studied steady-state NIF disposition (10 mg p.o. q.i.d.) during T3 in 15 pregnant women with pregnancy-induced hypertension.17 PK assessment was not conducted in the same group of subjects during postpartum as NIF treatment was discontinued after delivery. When comparing to historical control data,18 mean oral clearance at steady state in pregnant women was almost doubled (145.7 l/h vs. 74.4 l/h). The initial model (based on DEX data)12,13 predicted mean steady-state AUCR (PP:T3) of 1.3, Cmax ratio (PP:T3) of 1.5, and Cmin ratio (PP:T3) of 1.3, whereas the observed ratios were 2.0, 1.8, and 3.1, respectively (Figure 1b). Moreover, the initial model failed the verification criterion for AUCR and Cmin ratio (Figure 2). The refined model (based on MDZ data) predicted mean steady-state AUCR of 2.1, Cmax ratio of 2.1, and Cmin ratio of 2.4. With the exception of Cmin ratio, the rest of the predictions passed the verification criterion (Figure 1b and 2).
Indinavir
We first constructed a “drug file” for IDV within Simcyp and populated the simulator with necessary drug-specific parameters for IDV (Table 1). Then, the constructed PBPK model was verified against the disposition kinetics following the administration of a tracer dose of 16 mg IDV via 30-min intravenous (i.v.) infusion to nonpregnant healthy volunteers.19 Predicted population mean AUC0–24 h, Cmax, and Cmin values reasonably matched observed mean values (Figure 3a). The IDV model, accounting for CYP3A saturation at both hepatic and intestinal levels (described in Methods section), predicted disproportional increase in AUC (3.0-fold predicted vs. 3.2-fold observed) following a single oral dose of 800 mg vs. 400 mg in nonpregnant healthy volunteers (Figure 3b). Taken together, with the exception of Cmax following 400 mg p.o. dose and Cmin following 800 mg p.o. dose, the model-predicted AUC, Cmax, and Cmin, following either i.v. dosing or p.o. dosing in nonpregnant healthy volunteers passed verification criterion.
Table 1. Summary of indinavir drug-dependent parameters.
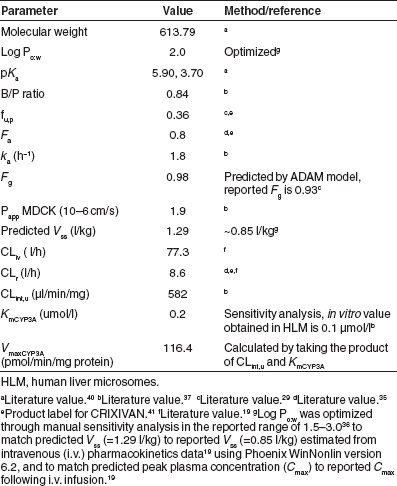
Figure 3.

Comparison of observed and predicted plasma concentration–time profiles of indinavir. (a) Simulated and observed plasma concentration–time profiles of indinavir (IDV) after an intravenous (i.v.) dose of 16 mg administered to nonpregnant healthy volunteers (M = 6, F = 6). The black solid line represents predicted mean profile following an i.v. dose of 16 mg. Mean observed data19 are overlaid. In the inset, predicted and observed PK profiles are plotted on a logarithmic scale. (b) Simulated and observed plasma concentration–time profiles of IDV after administration of a single oral dose of 400 mg or 800 mg to nonpregnant healthy volunteers (M = 6, F = 6). The black solid line represents predicted mean profile following 800 mg p.o. dose. The black dashed line represents predicted mean profile following 400 mg p.o. dose. Mean observed data19 are overlaid (filled circles: 800 mg p.o. dose profile; open circles: 400 mg p.o. dose profile). In the inset, predicted and observed PK profiles are plotted on a logarithmic scale. (c) Simulated and observed plasma concentration–time profiles of IDV following 800 mg q8h p.o. dose administered during third trimester (T3) and postpartum (PP). The black solid line represents predicted mean profile during postpartum. The gray dashed line represents predicted mean T3 profile using the initial model and the black dashed line represents predicted mean profile during T3 using the refined model. Mean observed data5 are overlaid (filled circles: postpartum profile; open circles: T3 profile). Considerable inter-individual variability in trough plasma concentration of IDV was observed across the 15 patients, and for clarification, the observed variability in the data is omitted. In the inset, predicted and observed PK profiles are plotted on a logarithmic scale.
These parameters were then used in conjunction with the pregnancy PBPK model to replicate the study reported by Unadkat et al.5 In this report, the disposition of IDV in 15 HIV-infected women receiving IDV (800 mg every 8 h) plus zidovudine plus lamivudine was assessed during T3 and postpartum. The initial PBPK model12,13,14 predicted mean AUCR (PP:T3) of 1.8, mean Cmax ratio (PP:T3) of 1.6, and mean Cmin ratio (PP:T3) of 2.3, as compared with the observed values of 3.1, 2.1, and 6.3, respectively5 (Figure 3c). The initial model (based on DEX data) did not pass the verification criterion for AUCR, Cmax, and Cmin ratio (Figure 2). However, the refined model (based on MDZ data) predicted mean AUCR (PP:T3) of 2.6, mean Cmax ratio (PP:T3) of 1.9, and mean Cmin ratio (PP:T3) of 3.4 (Figure 3c). With the exception of Cmin ratio, the model-predicted AUCR and Cmax ratio met verification criterion (Figure 2).
Sensitivity analysis
To gain additional insights into the site of CYP3A induction during pregnancy, we conducted a sensitivity analysis to assess the relative contribution of induction of hepatic and intestinal CYP3A activity towards changes in MDZ, NIF, or IDV AUC by varying CYP3A induction in the range of 0–200% in each organ (described in Methods section). As expected, 90–100% increase in hepatic CYP3A activity alone could universally explain the T3-induced AUCR (PP:T3) for all three CYP3A substrates (Figure 4). On the other hand, induction of intestinal CYP3A alone, by as much as 200%, could not explain the AUCR (PP:T3) for all three CYP3A substrates. Simultaneous induction of hepatic 3A (40–50%) and intestinal 3A (40–100%) could explain the AUCR (PP:T3) for MDZ and NIF, but underpredicted AUCR (PP:T3) of IDV (pred./obs. ratio < 0.80). One hundred percent induction of hepatic 3A and 50% induction of intestinal 3A could explain the AUCR (PP:T3) of IDV, but overpredicted the AUCR (PP:T3) of MDZ or NIF (pred./obs. ratio > 1.25).
Figure 4.

Changes in midazolam, nifedipine, and indinavir area under the curve ratio (AUCR) (AUCPP/AUCT3) as a function of hepatic and intestinal CYP3A activity induction during pregnancy. Observed mean AUCR is represented by horizontal plane in dark gray. Two horizontal planes in light gray show AUCR range between 80% and 120% of observed mean AUCR. Arrows indicate the intersections corresponding to 100% increase in hepatic CYP3A activity, 200% increase in intestinal CYP3A and simultaneous induction of hepatic 3A (50%) and intestinal 3A (50%). Figures were generated using SigmaPlot (Version 12.0, San Jose, CA).
Discussion
This study describes the use of a PBPK modeling approach for evaluating the effect of pregnancy on system-dependent parameters that are critical for ADME of CYP3A-eliminated compounds. Three clinically used model drugs, MDZ, NIF, and IDV, are either exclusively (fm, CYP3A = 92% for MDZ and 99% for NIF) or predominantly (85% for IDV) eliminated by CYP3A. The disposition kinetics are well characterized in the nonpregnant population, and well-designed clinical PK studies in pregnant women are readily available in the literature to allow comparison to model predictions. The main objective of PBPK simulations was to determine if the refined PBPK model, populated with CYP3A activity change based on probe drug study (MDZ), accurately predicts T3-induced change in the disposition of other CYP3A-metabolized drugs, NIF and IDV. To our knowledge, data on PK of other drugs studied during pregnancy are for those that are not predominately metabolized by CYP3A enzymes, or if they are, their PK is complicated by mechanism-based inactivation of CYP3A enzymes (e.g., ritonavir/lopinavir/atazanavir).
Verification of our refined PBPK model was based on AUC because achieving equivalent drug exposure in pregnant and nonpregnant women was our primary focus. In addition, prediction of Cmax and Cmin, were considered because achieving similar drug Cmax and Cmin may be important for some drugs in which these measures are related to drug efficacy and/or toxicity. In the absence of proper guidance, we arbitrarily chose criterion of PK bioequivalence to assess if the predicted exposure measures (PP:T3) fall between 80% and 125% of the observed value, i.e., 0.80≤pred/obs≤1.25.
The initial model was built on the Tracy et al. study that reported that relative to postpartum, maternal hepatic CYP3A4 activity increased by 35, 35, and 38% during first, second, and third trimesters, respectively.20 These changes in enzyme activity during pregnancy were based on urinary parent/metabolite ratios (UR) of DEX, an indirect marker of enzyme activity.16 Deconvolution of intrinsic hepatic clearance from UR is possible, however, this requires the assumption of the change in renal clearance of DEX during pregnancy.12 Indeed, as discussed earlier, further simulation results using MDZ as the model CYP3A drug confirmed the speculation that the magnitude of 3A induction during T3, from the report by Tracy et al., was significantly underestimated (Figure 2).
Before evaluating the performance of the refined PBPK model in the pregnant population, we ensured that the drug disposition of MDZ, NIF, and IDV was adequately described in the nonpregnant population. Simulations using MDZ and NIF drug file provided in Simcyp in nonpregnant healthy volunteers showed comparable PK profiles with the observed data as gauged by visual inspection, obtained in either nonpregnant healthy or postpartum subjects (Figure 1). For IDV, we established a drug file that captured the nonlinearity of its disposition as was observed in nonpregnant healthy subjects (see Discussion below). Overall, the initial model systematically underpredicted the AUCR for three drugs but the refined model did not. From a model validation perspective, MDZ might be best described as a model training compound. However, because the PBPK model accounted for altered maternal physiology (renal function, plasma protein binding, blood flow, etc), in addition to CYP activity changes, MDZ prediction could still be viewed as verifications of the above-mentioned, system-dependent variables. MDZ Cmax ratio (PP:T3) obtained using the refined model did not pass verification criterion (Figures 1a and 2). This could be due to the model assumption of no significant change in the rate of drug absorption or time lag. For the Cmin ratio (PP:T3), the refined model noticeably improved the model predictions for all three drugs, despite the fact that NIF and IDV Cmin ratio (PP:T3) predictions did not meet verification criterion. Because Cmax prediction for all three compounds met verification criterion (except for MDZ T3 Cmax), it is possible that inadequate prediction of tissue distribution (hence the t1/2 of drugs) resulted in inadequate prediction of Cmin. Overall, the refined model was found to be superior to the initial model in predicting pregnancy-induced systemic exposure changes of drugs primarily metabolized by CYP3A.
At first sight, the marked magnitude of effect of T3 on IDV AUC (~200% change or 3.1-fold PP:T3) is surprising since we observed only a ~100% increase in CYP3A activity as measured by oral MDZ clearance. However, on closer examination, this difference can be completely explained by the nonlinear PK of IDV caused by saturation of CYP3A metabolism. To test this hypothesis, we constructed and qualified a “drug file” for IDV within Simcyp. Then, this drug file was applied to the refined PBPK model, and the resulting predicted PK parameters, including AUC and Cmax, during T3 and postpartum met verification criterion. However, the predicted mean IDV Cmin ratio (PP:T3) was considerably lower than the observed ratio. We suspect that the large inter-individual variability in the observed Cmin (reported geometric mean (95% confidence interval) Cmin ratio of 3.80 (1.03, 13.99)) contributed to the discrepancy between predicted and observed values.5 The discrepancy between the predicted and observed mean postpartum profiles (Figure 3c) may also be due to the fact that the observed postpartum AUC0–8 h (23.8 ± 11.8 mg/l × h) is 27% higher than reported AUC0–8 h in nonpregnant HIV-positive female subjects (18.7 ± 9.0 mg/l × h).5 By contrast, the predicted postpartum AUC0–8 h (16.7 mg/l × h) is in good agreement with the reported AUC0–8 h in nonpregnant HIV-positive female subjects. This IDV case study illustrates two advantages of PBPK modeling. First, the capability of simultaneously considering the impact of concentration-dependent metabolism, changes in volume of distribution, and induction of CYP enzymes in prediction of disposition of drugs; and second, the separation of drug and system-dependent variables.10 In the absence of information on nonlinear PK of IDV (drug dependent), one would not be able to correctly predict the change in IDV exposure in pregnant women during T3 from MDZ and NIF T3 data (~100% increase in hepatic CYP3A activity, system dependent).
The placental–fetal component of this model is considered as a peripheral compartment and may affect the overall drug disposition in the pregnant woman. As expected, given the small size of the placental–fetal unit, the presence or absence of this unit did not alter maternal PK of the three model drugs (contributed to <2% change in AUC). A more mechanistic fetal model describing maternal–fetal transfer and fetal disposition requires extensive fetus physiology (system dependent) data, some of which are not available. Such a comprehensive fetal model could be incorporated into this PBPK model in the future to predict fetal exposure to drugs. However, as has been documented by us and others, unless there is extensive distribution or irreversible clearance of the drugs from the fetal compartment (unlikely because of the smaller size of the fetal organs and lower abundance of metabolizing enzymes), incorporation of a comprehensive fetal model is unlikely to significantly affect the PK of drugs in the maternal compartment.21,22
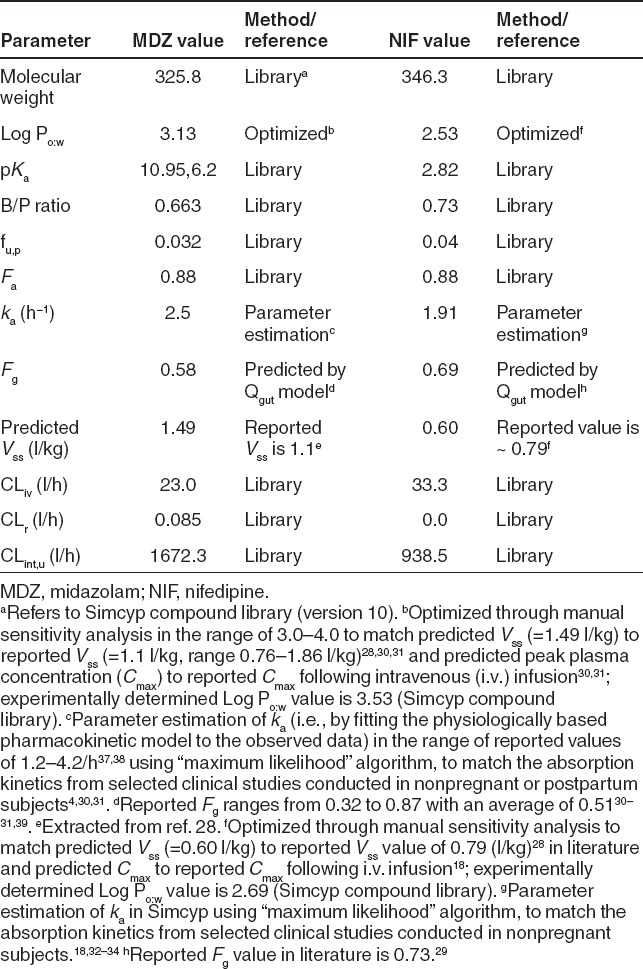
For drugs predominantly cleared by CYP3A, the site (hepatic, intestinal, or both) of CYP3A induction during pregnancy is expected to have differential impact on AUCR (PP:T3), as the latter is determined by CYP3A activity (i.e., CLint) change in each organ, fraction metabolized by CYP3A (fm, CYP3A), and basal intestinal extraction (1-Fg).23 The vastly different intestinal extraction of MDZ (Fg = 0.51), NIF (Fg = 0.73), and IDV (Fg = 0.93) (Tables 1 and 2) allowed us to assess, through a sensitivity analysis, the relative impact of hepatic vs. intestinal 3A induction on AUCR (PP:T3). Although, without experimental verification we cannot completely exclude the possibility that a certain combination of hepatic and intestinal activity induction can also explain the observed change in AUCR, our sensitivity analysis suggests that the observed change in systemic exposure was mostly driven by an induction of hepatic 3A activity, with modest to little contribution from intestinal 3A induction (Figure 4). On the basis of this finding, and our observation that hepatic, but not intestinal, luciferase activity is increased by pregnancy in the CYP3A4-promoter-luciferase transgenic mice,24 we propose that human pregnancy induces hepatic, and not intestinal, CYP3A activity. This conclusion needs to be supported by definitive studies such as i.v. and oral administration of MDZ during T3. The underlying mechanism for this hepatic CYP3A induction during pregnancy remains unknown. It is possibly due to rising concentrations of various hormones in maternal blood, including placental growth hormone, progesterone, corticosteroids, and estrogens.25
Table 2. Summary of MDZ and NIF drug-dependent parameters.
Ethical issues are important when conducting drug studies in pregnant women. Hence, in silico methods offer a great promise for leveraging existing knowledge to better plan and conduct studies in pregnant women. Per a US Food and Drug Administration guidance, “in single-dose trials, the same adult dose usually can be administered to all women in the trial” and “the dosage regimen can be adjusted based on the best available pretrial estimates of the pharmacokinetics of the drug and its active metabolites and what is known about drug elimination”26. To arrive at rational pretrial estimates, one can use the modeling and simulation approach to simulate systemic exposure of approved drugs in the three trimesters and postpartum, and based on this, one can optimize design of “first in pregnancy” PK study including prioritizing study period and dosage selection. As compared with conventional compartmental models, PBPK offers added advantages in trial simulation supporting “first in pregnancy” PK studies. The established PBPK model captures changes in system-dependent parameters and describes tissue distribution of drug molecule in much greater details. The latter may play a vital role in study design because one may be interested in tissue exposure or unbound plasma exposure of the approved drug in pregnant women. These exposure measures are more relevant to dosage adjustment (if any) than in the measurement of total plasma concentration of a drug.
Conclusion
With a thorough knowledge and understanding of drug-dependent parameters, combined with system parameters describing physiological and biological changes in the pregnant population, the proposed PBPK approach is capable of quantitatively predicting disposition of CYP3A substrate drugs during T3. At present, verification of the model for predicting drug PK during earlier trimesters is not possible due to the lack of reliable probe drug studies during these periods. However, CYP3A induction in human hepatocytes incubated with pregnancy-related hormones at their unbound plasma concentrations observed during T3 is virtually identical to that observed in vivo.27 Therefore, CYP3A induction in hepatocytes incubated with pregnancy-related hormones at unbound plasma concentrations observed during T1 and T2 may be able to fill this knowledge gap. Future expansion of the refined PBPK model could also include incorporating variability in the predicted drug exposure measures when necessary data on the variability (and covariance) in the system- and drug-dependent parameters are better defined. As described in this study for CYP3A substrate drugs, PBPK prediction of the disposition of drugs cleared by other major CYPs, including CYP1A2, CYP2D6, CYP2B6, and CYP2C9, based on probe drug studies, are currently in progress. Once completed, it should be possible to use the predictive model, prior to clinical investigations, to evaluate different dosing regimens in pregnant women for drugs cleared primarily via single or mixed CYP metabolism.
Methods
General pregnancy PBPK model structure and verification methodology. Known maternal physiological, anatomical, and biological differences between pregnant and nonpregnant populations, based on meta-analysis of literature data, were incorporated in the virtual population as reported.12 These included gestational weight gain, plasma protein and lipid concentration, individual organ/tissue volumes and blood flows, glomerular filtration rates, and hepatic enzyme activity changes (CYP1A2, 2D6, and 3A). A time-varying full-PBPK model constructed in Matlab v. 7.10 (Mathworks, Natick, MA) (2010) was used.14 Briefly, the PBPK model is an extension of the Simcyp 13-compartment full-PBPK model, by adding a lumped compartment to represent the placenta, fetal organs, and the amniotic fluid (Figure 5). Systemic clearance was considered to occur in the maternal liver and kidney and presystemic metabolism was considered to occur in both maternal small intestine and the liver. Key model assumptions and governing equations of the PBPK model are provided in Supplementary Materials and Methods online. The Matlab model is available for scientific research and can be obtained by contacting Dr Amin Rostami-Hodjegan (amin.rostami@manchester.ac.uk).
Figure 5.

A schematic representation of the pregnancy physiologically based pharmacokinetic model (PBPK) model. The PBPK model is an extension of the Simcyp 13-compartment full-PBPK model, and includes a lumped compartment to represent placental–fetal organs including the fetus, placenta, and the amniotic fluid. Reproduced from Lu et al. 2012.13
Mean plasma AUC, Cmax, and Cmin were predicted and compared with published studies in pregnant and nonpregnant women. MDZ and indinavir observed data were obtained directly from the authors. Nifedipine observed data was captured using “digitize,” a Matlab tool for digitizing images that is freely available on http://www.mathworks.com/matlabcentral/. An arbitrary criterion for successful verification of the model was prediction of pregnancy-induced fold-changes in mean population PK parameters of the drug (i.e., AUC ratio (PP:T3), Cmax ratio (PP:T3), and Cmin ratio (PP:T3)) between 80% and 125% of the observed value, i.e., 0.80≤pred/obs≤1.25.
MDZ PBPK model. Physiochemical and protein binding parameters (B/P ratio, fu,p), absorption (Fa, Fg), distribution (Kp, tissue-to-plasma partition coefficient), and elimination (CLint,h,u) were obtained from Simcyp Population-based Simulator (version 10) (Simcyp, Sheffield, UK) ka (=2.5/h) was estimated (Table 2) in the reported range of 2–4.2/h28,29 in Simcyp to match the absorption kinetics from selected clinical studies conducted in nonpregnant or postpartum subjects.4,30,31 Log Po:w (=3.1) was further optimized through manual sensitivity analysis in the range of 3.0–4.0 to match predicted Vss (=1.49 l/kg) to reported Vss (=1.1 l/kg)28 and to improve Cmax prediction. The drug-dependent parameters of MDZ are outlined in Table 2.
Nifedipine PBPK model. Physiochemical and protein binding parameters (B/P ratio, fu,p), absorption (Fa, Fg), distribution (Kp), and elimination (CLint,h,u) were obtained from Simcyp (Version 10). Log Po:w (=2.53) was optimized in the range of 2.0−3.0 to match predicted Vss (=0.60 l/kg) to reported Vss (=0.79 l/kg)28 and to improve Cmax prediction. ka (=1.91/h) was estimated (Table 2) in Simcyp to match the absorption kinetics from selected clinical studies conducted in nonpregnant subjects.18,32,33,34 The drug-dependent parameters of NIF are outlined in Table 2.
Indinavir PBPK model. Drug-specific parameters for IDV, including physiochemical and protein binding parameters (B/P ratio, fu,p), absorption (Fa, ka, Fg), were extracted from literature. Nonpregnant CLr of 8.6 l/h was the average literature value.19,35 Log Po:w was optimized in Simcyp through manual sensitivity analysis in the range of 1.5–3.036 to improve Vss and Cmax prediction (Table 1). To capture the more-than-proportional increase in AUC following a single p.o. dose in the dose range of 400 mg–800 mg in healthy volunteers, in vivo Km was estimated via sensitivity analysis in Simcyp with a starting value of 0.1 µmol/l obtained in human liver microsomes.37 During the optimization process, Vmax was adjusted accordingly so as to maintain a constant ratio of Vmax/Km to equal the maximum CLint,h,u determined in human liver microsomes.37 The drug-dependent parameters of IDV are outlined in Table 1.
Sensitivity analysis to discern site of CYP3A induction. First the change in intestinal bioavailability (Fg) of these drugs as a result of intestinal CYP3A induction in the range of 0–200% (20% increment per step) was predicted using either Qgut model or ADAM model (Supplementary Materials and Methods online). Then the newly obtained Fg value was incorporated into the pregnancy PBPK model. Subsequently, induction of hepatic CYP3A in the range of 0–200% (20% increment per step) and its impact on presystemic and systemic elimination of these drugs was considered in the pregnancy PBPK model.
Author contributions
A.B.K., S.C.N., P.Z., A. R-H., and J. D.U. designed the research. A.B.K. performed the research. A. R-H. contributed new reagents or analytical tools. A.B.K. analyzed the data. A.B.K., S.C.N., P.Z., A. R-H., and J. D.U. wrote the manuscript.
Conflict of interest
The authors declared no conflict of interest. CPT:PSP Associate Editor A.R-H. was not involved in the review or decision process for this article.
Study Highlights
Acknowledgments
The authors acknowledge funding from US Food and Drug Administration Office of Women's Health and visiting fellowship from SimCYP (A.B.K.). The authors would also like to thank Shiew Mei Huang (OCP, CDER, US Food and Drug Administration) for her critical review of the manuscript and Masoud Jamei and Gaohua Lu (SimCYP, UK) for their technical support on Matlab models.
Supplementary Material
References
- Glover D.D., Amonkar M., Rybeck B.F., &, Tracy T.S. Prescription, over-the-counter, and herbal medicine use in a rural, obstetric population. Am. J. Obstet. Gynecol. 2003;188:1039–1045. doi: 10.1067/mob.2003.223. [DOI] [PubMed] [Google Scholar]
- Andrade S.E.et al. Prescription drug use in pregnancy Am. J. Obstet. Gynecol 191398–407.2004 [DOI] [PubMed] [Google Scholar]
- Anderson G.D., &, Carr D.B. Effect of pregnancy on the pharmacokinetics of antihypertensive drugs. Clin. Pharmacokinet. 2009;48:159–168. doi: 10.2165/00003088-200948030-00002. [DOI] [PubMed] [Google Scholar]
- Hebert M.F.et al. Effects of pregnancy on CYP3A and P-glycoprotein activities as measured by disposition of midazolam and digoxin: a University of Washington specialized center of research study Clin. Pharmacol. Ther 84248–253.2008 [DOI] [PubMed] [Google Scholar]
- Unadkat J.D.et al. Pharmacokinetics and safety of indinavir in human immunodeficiency virus-infected pregnant women Antimicrob. Agents Chemother 51783–786.2007 [DOI] [PMC free article] [PubMed] [Google Scholar]
- Bryson Y.J., PACTG 353 Team et al. Pharmacokinetics and safety of nelfinavir when used in combination with zidovudine and lamivudine in HIV-infected pregnant women: Pediatric AIDS Clinical Trials Group (PACTG) Protocol 353. HIV Clin. Trials. 2008;9:115–125. doi: 10.1310/hct0902-115. [DOI] [PMC free article] [PubMed] [Google Scholar]
- Anderson G.D. Pregnancy-induced changes in pharmacokinetics: a mechanistic-based approach. Clin. Pharmacokinet. 2005;44:989–1008. doi: 10.2165/00003088-200544100-00001. [DOI] [PubMed] [Google Scholar]
- Rowland M., Peck C., &, Tucker G. Physiologically-based pharmacokinetics in drug development and regulatory science. Annu. Rev. Pharmacol. Toxicol. 2011;51:45–73. doi: 10.1146/annurev-pharmtox-010510-100540. [DOI] [PubMed] [Google Scholar]
- Andrew M.A., Hebert M.F., &, Vicini P. Physiologically based pharmacokinetic model of midazolam disposition during pregnancy. Conf. Proc. IEEE Eng. Med. Biol. Soc. 2008;2008:5454–5457. doi: 10.1109/IEMBS.2008.4650448. [DOI] [PubMed] [Google Scholar]
- Jamei M., Dickinson G.L., &, Rostami-Hodjegan A. A framework for assessing inter-individual variability in pharmacokinetics using virtual human populations and integrating general knowledge of physical chemistry, biology, anatomy, physiology and genetics: A tale of ‘bottom-up' vs ‘top-down' recognition of covariates. Drug Metab. Pharmacokinet. 2009;24:53–75. doi: 10.2133/dmpk.24.53. [DOI] [PubMed] [Google Scholar]
- Zhao P.et al. Applications of physiologically based pharmacokinetic (PBPK) modeling and simulation during regulatory review Clin. Pharmacol. Ther 89259–267.2011 [DOI] [PubMed] [Google Scholar]
- Abduljalil, K., Furness P., Johnson, T.N., Rostami-Hodjegan, A., Soltani, H. physiological, anatomical and metabolic changes with gestational age during normal pregnancy: a database for parameters required in physiologically based pharmacokinetic modelling. Clin. Pharmacokinet. 2012;51:365–396. doi: 10.2165/11597440-000000000-00000. [DOI] [PubMed] [Google Scholar]
- Lu G., Abduljalil K., Jamei M., Johnson T.N., Soltani H., &, Rostami-Hodjegan A. physiologically-based pharmacokinetic (PBPK) models for assessing the kinetics of xenobiotics during pregnancy: achievements and shortcomings. Curr. Drug Metab. 2012;13:695–720. doi: 10.2174/138920012800840374. [DOI] [PubMed] [Google Scholar]
- Gaohua L., Abduljalil K., Jamei M., Johnson T.N., &, Rostami-Hodjegan A.A Pregnancy Physiologically-Based Pharmacokinetic (p-PBPK) Model for Disposition of Drugs Metabolized by CYP1A2, CYP3A4 and CYP2D6 Br. J. Clin. Pharmacol 2012. e-pub ahead of print 22 June 2012. [DOI] [PMC free article] [PubMed]
- Kirby B.J.et al. Complex drug interactions of HIV protease inhibitors 2: in vivo induction and in vitro to in vivo correlation of induction of cytochrome P450 1A2, 2B6, and 2C9 by ritonavir or nelfinavir Drug Metab. Dispos 392329–2337.2011 [DOI] [PMC free article] [PubMed] [Google Scholar]
- Rostami-Hodjegan A., Kroemer H.K., &, Tucker G.T. In-vivo indices of enzyme activity: the effect of renal impairment on the assessment of CYP2D6 activity. Pharmacogenetics. 1999;9:277–286. doi: 10.1097/00008571-199906000-00002. [DOI] [PubMed] [Google Scholar]
- Prevost R.R., Akl S.A., Whybrew W.D., &, Sibai B.M. Oral nifedipine pharmacokinetics in pregnancy-induced hypertension. Pharmacotherapy. 1992;12:174–177. [PubMed] [Google Scholar]
- Foster T.S., Hamann S.R., Richards V.R., Bryant P.J., Graves D.A., &, McAllister R.G. Nifedipine kinetics and bioavailability after single intravenous and oral doses in normal subjects. J. Clin. Pharmacol. 1983;23:161–170. doi: 10.1002/j.1552-4604.1983.tb02720.x. [DOI] [PubMed] [Google Scholar]
- Yeh K.C., Stone J.A., Carides A.D., Rolan P., Woolf E., &, Ju W.D. Simultaneous investigation of indinavir nonlinear pharmacokinetics and bioavailability in healthy volunteers using stable isotope labeling technique: study design and model-independent data analysis. J. Pharm. Sci. 1999;88:568–573. doi: 10.1021/js9802392. [DOI] [PubMed] [Google Scholar]
- Tracy T.S., Venkataramanan R., Glover D.D., &, Caritis S.N. Temporal changes in drug metabolism (CYP1A2, CYP2D6 and CYP3A Activity) during pregnancy. Am. J. Obstet. Gynecol. 2005;192:633–639. doi: 10.1016/j.ajog.2004.08.030. [DOI] [PubMed] [Google Scholar]
- Tuntland T., Nosbisch C., &, Unadkat J.D. Effect of pregnancy, mode of administration and neonatal age on the pharmacokinetics of zalcitabine (2', 3'-dideoxycytidine) in the pigtailed macaque (Macaca nemestrina) J. Antimicrob. Chemother. 1997;40:687–693. doi: 10.1093/jac/40.5.687. [DOI] [PubMed] [Google Scholar]
- Tuntland T., Odinecs A., Nosbisch C., &, Unadkat J.D. In vivo maternal-fetal-amniotic fluid pharmacokinetics of zidovudine in the pigtailed macaque: comparison of steady-state and single-dose regimens. J. Pharmacol. Exp. Ther. 1998;285:54–62. [PubMed] [Google Scholar]
- Fahmi O.A.et al. Comparison of different algorithms for predicting clinical drug-drug interactions, based on the use of CYP3A4 in vitro data: predictions of compounds as precipitants of interaction Drug Metab. Dispos 371658–1666.2009 [DOI] [PubMed] [Google Scholar]
- Zhang H., Wu X., Wang H., Mikheev A.M., Mao Q., &, Unadkat J.D. Effect of pregnancy on cytochrome P450 3a and P-glycoprotein expression and activity in the mouse: mechanisms, tissue specificity, and time course. Mol. Pharmacol. 2008;74:714–723. doi: 10.1124/mol.107.043851. [DOI] [PMC free article] [PubMed] [Google Scholar]
- Jeong H. Altered drug metabolism during pregnancy: hormonal regulation of drug-metabolizing enzymes. Expert Opin. Drug Metab. Toxicol. 2010;6:689–699. doi: 10.1517/17425251003677755. [DOI] [PMC free article] [PubMed] [Google Scholar]
- US Department of Health and Human Services, Food and Drug Administration, Center for Drug Evaluation and Research (CDER) Guidance for Industry Pharmacokinetics in Pregnancy -Study Design, Data Analysis, and Impact on Dosing and Labeling. US FDA webiste [online] : < http://www.fda.gov/downloads/Drugs/GuidanceComplianceRegulatoryInformation /Guidances/ucm072133.pdf > ( 2004
- Papageorgiou I., &, Unadkat J.D.Mechanisms by which hepatic CYP3A enzymes are induced during pregnancyISSX, 17th North American Meeting Atlanta, Georgia (2011
- Obach R.S., Lombardo F., &, Waters N.J. Trend analysis of a database of intravenous pharmacokinetic parameters in humans for 670 drug compounds. Drug Metab. Dispos. 2008;36:1385–1405. doi: 10.1124/dmd.108.020479. [DOI] [PubMed] [Google Scholar]
- Gertz M., Harrison A., Houston J.B., &, Galetin A. Prediction of human intestinal first-pass metabolism of 25 CYP3A substrates from in vitro clearance and permeability data. Drug Metab. Dispos. 2010;38:1147–1158. doi: 10.1124/dmd.110.032649. [DOI] [PubMed] [Google Scholar]
- Thummel K.E.et al. Oral first-pass elimination of midazolam involves both gastrointestinal and hepatic CYP3A-mediated metabolism Clin. Pharmacol. Ther 59491–502.1996 [DOI] [PubMed] [Google Scholar]
- Gorski J.C., Jones D.R., Haehner-Daniels B.D., Hamman M.A., O'Mara E.M., Jr, Hall S.D. The contribution of intestinal and hepatic CYP3A to the interaction between midazolam and clarithromycin. Clin. Pharmacol. Ther. 1998;64:133–143. doi: 10.1016/S0009-9236(98)90146-1. [DOI] [PubMed] [Google Scholar]
- Reitberg D.P., Love S.J., Quercia G.T., &, Zinny M.A. Effect of food on nifedipine pharmacokinetics. Clin. Pharmacol. Ther. 1987;42:72–75. doi: 10.1038/clpt.1987.110. [DOI] [PubMed] [Google Scholar]
- Smith S.R., Kendall M.J., Lobo J., Beerahee A., Jack D.B., &, Wilkins M.R. Ranitidine and cimetidine; drug interactions with single dose and steady-state nifedipine administration. Br. J. Clin. Pharmacol. 1987;23:311–315. doi: 10.1111/j.1365-2125.1987.tb03050.x. [DOI] [PMC free article] [PubMed] [Google Scholar]
- Odou P.et al. Grapefruit juice-nifedipine interaction: possible involvement of several mechanisms J. Clin. Pharm. Ther 30153–158.2005 [DOI] [PubMed] [Google Scholar]
- Balani S.K.et al. Disposition of indinavir, a potent HIV-1 protease inhibitor, after an oral dose in humans Drug Metab. Dispos 241389–1394.1996 [PubMed] [Google Scholar]
- Lin J.H., Chen I.W., Vastag K.J., &, Ostovic D. pH-dependent oral absorption of L-735,524, a potent HIV protease inhibitor, in rats and dogs. Drug Metab. Dispos. 1995;23:730–735. [PubMed] [Google Scholar]
- Gertz M., Houston J.B., &, Galetin A. Physiologically-based pharmacokinetic modeling of intestinal first-pass metabolism of CYP3A substrates with high intestinal extraction. Drug Metab Dispos. 2011;39:1633–1642. doi: 10.1124/dmd.111.039248. [DOI] [PubMed] [Google Scholar]
- Ito K., Ogihara K., Kanamitsu S., &, Itoh T. Prediction of the in vivo interaction between midazolam and macrolides based on in vitro studies using human liver microsomes. Drug Metab. Dispos. 2003;31:945–954. doi: 10.1124/dmd.31.7.945. [DOI] [PubMed] [Google Scholar]
- Kirby B.J., Collier A.C., Kharasch E.D., Whittington D., Thummel K.E., &, Unadkat J.D. Complex drug interactions of HIV protease inhibitors 1: inactivation, induction, and inhibition of cytochrome P450 3A by ritonavir or nelfinavir. Drug Metab. Dispos. 2011;39:1070–1078. doi: 10.1124/dmd.110.037523. [DOI] [PMC free article] [PubMed] [Google Scholar]
- Lin J.H.et al. Species differences in the pharmacokinetics and metabolism of indinavir, a potent human immunodeficiency virus protease inhibitor Drug Metab. Dispos 241111–1120.1996 [PubMed] [Google Scholar]
- Product label for CRIXIVAN (indinavir sulfate) oral capsule . < http://www.accessdata.fda.gov/drugsatfda_docs/label/2010/ 020685s073lbl.pdf >.
- Yang J., Jamei M., Yeo K.R., Tucker G.T., &, Rostami-Hodjegan A. Prediction of intestinal first-pass drug metabolism. Curr. Drug Metab. 2007;8:676–684. doi: 10.2174/138920007782109733. [DOI] [PubMed] [Google Scholar]
- Darwich A.S., Neuhoff S., Jamei M., &, Rostami-Hodjegan A. Interplay of metabolism and transport in determining oral drug absorption and gut wall metabolism: a simulation assessment using the “Advanced Dissolution, Absorption, Metabolism (ADAM)” model. Curr. Drug Metab. 2010;11:716–729. doi: 10.2174/138920010794328913. [DOI] [PubMed] [Google Scholar]
Associated Data
This section collects any data citations, data availability statements, or supplementary materials included in this article.