

Abstract
Cellular communities in living tissues act in concert to establish intricate microenvironments, with complexity difficult to recapitulate in vitro. We report a method for docking numerous cellularized hydrogel shapes (100–1,000 µm in size) into hydrogel templates to construct 3D cellular microenvironments. Each shape can be uniquely designed to contain customizable concentrations of cells and molecular species, and can be placed into any spatial configuration, providing extensive compositional and geometric tunability of shape-coded patterns using a highly biocompatible hydrogel material. Using precisely arranged hydrogel shapes, we investigated migratory patterns of human mesenchymal stem cells and endothelial cells. We then developed a finite element gradient model predicting chemotactic directions of cell migration in micropatterned cocultures that were validated by tracking ∼2,500 individual cell trajectories. This simple yet robust hydrogel platform provides a comprehensive approach to the assembly of 3D cell environments.
Keywords: microtechnologies, tissue assembly, angiogenesis, modeling, diffusion
Biological tissues are composed of cellular “building blocks” that cooperate to provide tissue-specific functions (1–6). Specific cells, molecules, and their geometric assembly establish a biological system, whether it is a vascular network surrounded by parenchymal cells (7), a developing tissue (8–11), or a metastatic tumor (12–16). In vitro culture systems designed to control the 3D presentation of multiple cells and molecular species in a biologically relevant matrix are needed to faithfully recapitulate intricate biological niches (17–23). Previous attempts to assemble complex tissue structures in vitro lacked the specificity and yield to control large numbers of cells and soluble factors (22–24), had limited resolution at the microscale (25, 26), and used matrices without adequate biological function (27–32). Therefore, spatial microenvironmental control of biological systems has been difficult to achieve. Such control is important in many processes, including the migratory formation of vasculature, where gradient patterns dictate growth of vascular sprouts. For example, endothelial cell (EC) stabilization via mesenchymal stem cell (MSC) interactions is known to facilitate the maturation of blood vessels impacting many physiologic systems, from tumors to engineered tissues (33–35). Recent studies clearly showed the importance of microscale gradients for vasculogenesis (36–38).
We report a method by which microsized 3D hydrogels are shape-coded for their biological and physical properties and docked by iterative sedimentation into shape-matching hydrogel templates. Microenvironmental niches were fabricated using gelatin methacrylate (GelMA), a modified native protein with excellent biocompatibility, tunable mechanical properties, and micrometer-scale patterning resolution (39, 40). GelMA was molded into diverse geometric shapes with dimensions of 100–1,000 µm, after encapsulating cells or labeled molecular species of a desired type and concentration. This way, biological niches were shape-coded, and various shapes could be assembled into collective structures with emergent properties.
Shape-coded cell niches were docked into hydrogel templates containing congruent wells of different geometries using gravity-based sedimentation. Over multiple sedimentation events, docked shapes were shear protected and remained in their wells, whereas mismatched shapes were resuspended to settle again. The geometric uniqueness of each shape enabled exclusivity and specificity of docking into congruent wells, allowing simple yet precise fabrication of geometric patterns mimicking native cell microenvironments. These techniques were used to form radially organized 3D patterns to study sprouting and the homing of MSCs to ECs, by using the diffusive signaling patterns to dictate spatial orientation of cell migration. A finite element gradient model was built by accounting for the repelling and attracting forces originating from the docked hydrogels. Large numbers of single cells were tracked using advanced image processing algorithms to validate the dependence of cell migration on the spatial gradient.
Results
Fabrication of Hydrogel Shapes and Templates.
Cells and labeled molecular species were encapsulated in GelMA, a naturally occurring peptide-based hydrogel, which was fabricated using elastomeric poly(dimethylsiloxane) (PDMS) molds into a range of nonsuperimposable geometric shapes (Fig. 1 A–C and Fig. S1). Each hydrogel shape was coded for the specific types and concentrations of encapsulated cells and cytokine surrogates, and was able to preserve cell viability and biological function over weeks of in vitro culture. Templates containing combinations of negative reliefs of shape geometries were designed to mimic different potential microenvironments (Fig. 1 D and E) and fabricated using methacrylated glass, which covalently cross-linked with the GelMA to form a substrate-attached hydrogel template (Fig. 1 D and E).
Fig. 1.
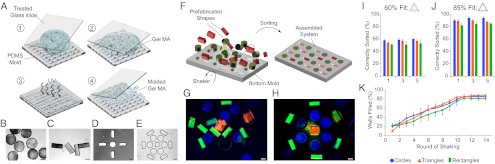
Engineering of geometrically defined cellular microenvironments by docking shape-coded hydrogels into hydrogel templates. (A) Schematic of micromolding approach to fabrication of gelatin methacrylate (GelMA) hydrogel. (B–E) Bright-field microscopy images of (B and C) GelMA shapes and (D and E) GelMA templates. (F) Hydrogel shape docking into congruent template wells. (G and H) Merged fluorescent images of (G) free-floating hydrogel shapes before sorting, and (H) shapes within congruent wells after sorting. (I and J) Specificity of shape sorting as a function of shape geometry, the number of sorting cycles (1–10), and the ratio of the surface areas of the hydrogel and congruent well: (I) 60% and (J) 85%. (K) Yield of sorting (the percentage of wells correctly filled), as a function of rounds of shaking for three shape geometries. (Scale bars: 300 µm.) Data are shown as average ± SD (n = 20).
Assembly of Hydrogel Shapes.
To assemble microenvironments, shapes in suspension were pipetted onto a hydrogel template and docked into their respective wells by sequential sedimentation–resuspension on an orbital shaker. Shapes, used in excess of their corresponding wells, were first agitated for 1 min and then allowed to sediment for another minute. At the end of each cycle, a fraction of shapes docked into their congruent wells. The undocked shapes, which settled outside of wells, being geometrically excluded or incorrectly oriented, were resuspended and allowed to sediment again, whereas the correctly docked shapes stayed locked in their wells due to shear protection (Fig. 1F). This process allowed for shapes to be sorted into their congruent wells with high fidelity (Fig. 1 G and H).
Specificity and Yield of Docking.
To maximize specificity of docking, different sets of canonical shapes were designed. Shapes sized at 60% of the surface area of their congruent well sorted with poor specificity, such that only 55% docked into their correct wells (Fig. 1I). When the shapes were sized to 85% of the surface area of their congruent wells, the specificity increased to 90% (Fig. 1J). The specificity remained unchanged over sequential rounds of shaking, confirming geometric exclusion as the primary determinant of specificity. Shapes correctly sorted with a yield of ∼20% in the first cycle, and an additional 10% in each subsequent cycle, to a maximum yield of 85%, a limit imposed by the maximum specificity. The yields and specificities of iterative sedimentation surpass those achieved with any previous technique. The change in hydrogel composition (percentage GelMA) had significant effect on mechanical properties of the hydrogel without affecting the sorting specificity or yield (Fig. S2). After sorting, another layer of GelMA was applied to permanently lock the sorted shapes into a cell microenvironment composed of a homogenous biocompatible hydrogel matrix.
Molecular Diffusion from Hydrogel Shapes.
The ability to encapsulate molecular species within GelMA, along with the precision of the sorting technique, provided a method to generate unique spatial gradients. Fluorescently tagged dextran or BSA, serving as surrogates for cytokines of large molecular size, were encapsulated into circular and rectangular shapes, docked to form specific patterns, and were allowed to outwardly diffuse. Over the course of 100 min, red fluorescent dextran emanated from the circle and green fluorescent dextran emanated from the rectangle, providing a spatial gradient field over the millimeter-size scale (Fig. 2 A–D and Movies S1 and S2). The evolution of concentration gradients demonstrated that the concentrations of molecular species changed with time in a predictable manner (Fig. 2E). Hydrogel composition modulated the diffusivity, with faster transport rates of encapsulated BSA measured for hydrogels made with a lower percentage of GelMA (Fig. S3).
Fig. 2.
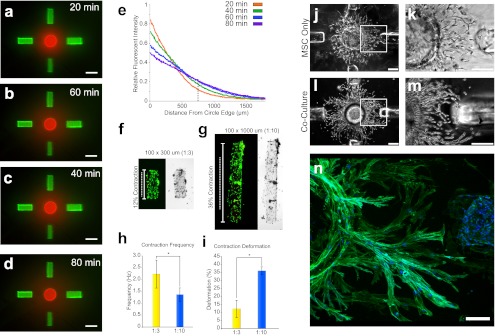
Regulation of cellular function by the geometry and organization of hydrogel shapes. (A–D) Time lapse images of sorted circles and rectangles dosed with 100 µg/mL Texas Red-tagged 10-kDa dextran and 100 µg/mL Alexa 488-tagged 10-kDa dextran, respectively. (Scale bars: 600 µm.) (E) Fluorescent intensities were obtained starting from the circle edge and to a distance of 2 mm from the circle edge for five different time points. Intensities were normalized to the maximum intensity across all time points. Relative fluorescent intensity of Texas Red-tagged 10-kDa dextran was plotted as a function of distance from the circle at the five different time points. (F and G) Neonatal cardiomyocytes encapsulated within GelMA rectangles after 4 d of cultivation. Fluorescent live/dead staining (Left) is shown along with the associated bright-field images (Right), for the shape geometries with (F) 1:3 aspect ratio (100 × 300 µm) and (G) 1:10 aspect ratio (100 × 1,000 µm); the length of dotted line to solid line shows average deformation of rectangles (n = 15). (H) Contraction frequency (in hertz) for 1:3 and 1:10 aspect ratio rectangles, shown as average ± SD (n = 27, α = 0.05, *P < 0.01). (I) Contraction deformation (percentage of the total length) for hydrogel rectangles with a 1:3 and 1:10 aspect ratio, shown as average ± SD (n = 50, α = 0.05, P < 0.01). (J and L) Human mesenchymal stem cells (MSC) within GelMA hydrogel after 14 d of cultivation, cultured alone (J) or in coculture with endothelial cells (EC) (L). (K and M) Magnification of regions outlined by the white rectangles in J and L. (Scale bars: 300 µm.) (N) Confocal microscopy of actin (green) and DAPI (blue) staining of MSC growth toward EC after 7 d of coculture.
Engineering Cell Behavior Using Hydrogel Shapes.
We demonstrated that hydrogel shapes can be used to form biomimetic cell environments to modulate the function of encapsulated cells. As an example, neonatal rat cardiomyocytes were encapsulated within rectangular hydrogels of two width/length aspect ratios: 1:3 and 1:10. After 7 d of culture, all shapes exhibited spontaneous macroscopic beating, with high fractions of viable cells (>98%; Fig. 2 F and G) and remarkable differences in contractile cell function. The 1:3 rectangles contracted at a significantly higher frequency and to only ∼12% of their length, whereas the 1:10 rectangles contracted more slowly and to ∼36% of their total length. These data suggest differential phenotypic maturation of cardiac subunits by simple changes in hydrogel geometry (Fig. 2 H and I) and capability to mature the cellular subunits before assembly into docked patterns.
Patterning MSC Migration.
The hydrogel sorting platform was then used to control the coculture of human MSCs and human ECs. MSCs were encapsulated in circular hydrogels, sorted into centrally positioned circular wells, and allowed to migrate out of the hydrogel toward the surrounding rectangles containing either acellular or EC-laden hydrogels (Fig. 2 J–M and Fig. S4). Images in both groups were taken at the same time points, with the only variable being the presence of ECs. MSCs by themselves migrated out in a constant symmetric, radial fashion; however, MSCs cultured with EC-containing hydrogels initially migrated radially, curved their trajectories over time, creating long, arcing sprouts homing toward ECs. Confocal microscopy of actin (Fig. 2N) provided a closer view of the cytoskeletal architecture of the migratory MSC sprouts. This visually striking, spatially dependent influence on MSC growth suggested a gradient-based communication between the two cell types.
Finite Element Model of Cell Migration.
To explore gradient effects between the ECs and MSCs, a 3D finite-element model was built using the two hydrogel shape types as gradient sources (Fig. 3A). The model accounted for two driving forces: (i) repulsive homotypic interaction between MSCs dictating cell migration from a region of high to low cell density (MSC–MSC repulsion), and (ii) the chemotactic gradient of EC-secreted factors dictating MSC migration from a region of low to a region of high concentration (MSC–EC attraction). The MSC-only system was driven solely by the repulsive cell gradient, whereas the coculture system combined the two driving forces to form a gradient field akin to a dipole electric field. The gradient field model was used to check the relative independence of specific shape geometry on the subsequent formation of the gradient field. Different shapes—rectangles, circles and squares—all formed similar gradient fields when positioned equally, validating that the mutual exclusivity of shape geometry did not necessitate variable gradient formation (Fig. S5 A–C). Changing individual shape geometry had only a small effect compared with changing spatial position of wells in the hydrogel template, which caused grossly different gradient patterns (Fig. S5 D–F). When biologically assessed, cell migration in linear configurations matched the model of Fig. S5E accordingly (Fig. S6).
Fig. 3.

Modeling of cell migration. (A) Schematic diagram of MSC migration in response to concentration gradients generated by ECs. (B and C) Cell vectors were generated from day 14 phase contrast cell images using image-processing techniques. Average migration rates were measured using the vectors generated for each group. (D and E) Representative examples of overlays of processed cell vectors and COMSOL modeled vector fields for the two culture conditions: (D) MSC-only and (E) MSC–EC coculture. (Insets) Magnifications of the outlined regions to illustrate correlation between the two vector fields. The average angle difference between the measured cell vector and model prediction was calculated for the matched and unmatched models. (F and G) Radial distribution of the angles of cell trajectories, with the bin set to 10°. (H) Heat map of angle magnitudes between standard radial coordinates and cell data. (I) Heat map of angle differences between cocultured cells and the corresponding matched or mismatched model. The color-coded bar shows the angle correlation for the heat map.
Cell Migration Vectors.
To validate the accuracy of the gradient model of cell migration behavior, cell trajectories were quantified in the time-lapse images by generating cell-associated vectors using a MATLAB-based image segmentation algorithm. Contrast thresholding, image smoothing, Sobel edge detection function, and a watershed transformation were implemented to create segmented image areas for each cell (Fig. S7). Ellipses were inscribed within segmented areas, and the resultant long axis vector was used to represent the cell (Fig. 3 B and C). The vectors formed a comprehensive dataset (corresponding to ∼2,500 cells), to allow quantitative comparisons to be made for cell migratory speed, angular distribution, and correlation of cell migration to the developed gradient model. Using the vector dataset, an average rate of MSC migration was calculated in the presence or absence of ECs. The MSCs alone migrated with an average speed of 25.9 µm/d, but when in the presence of ECs, they migrated 36.1 µm/d (a 40% increase; P = 4.2 × 10⁻⁵). The angular distributions of cells were examined using histograms of the cell angles relative to the right horizontal axis (Fig. 3 F and G). MSCs cultured alone exhibited uniform distributions, whereas MSCs cocultured with ECs clustered at angles correlating to the locations of ECs.
Correlation of Cell Migration to Finite Element Model.
The measured directions of cell migration were compared with model predictions by superimposing cell vector data onto the model vector fields. Overall, the migrating cells followed the gradient field lines (Fig. 3 D and E). Along radial diagonal lines between rectangles in the coculture model, the migratory deviations reflected ambiguous cell responses to competing gradients (equal attraction to both rectangles) (Fig. 3 D and E).
For quantitative comparison, the angles between cell data vectors and model vectors were measured. The angle between the cell data vector and the finite-element model vector ranged from 0° to 90°, 0 corresponding to perfect agreement between the data and the model (Fig. 3 D and E, Insets). Comparison of the MSC-only data with the single-gradient model resulted in an average angle deviation of 21.1°, substantiating that ∼20° deviation is intrinsic to MSC migration. Interestingly, the average angle was 22° and 29° when comparing the coculture cell data to the coculture model and radial model, respectively. A statistically significant decrease (by ∼7°, P = 2.23 × 10⁻⁷) of the average angle validates that two simple driving forces can establish a gradient model accounting for the interactions between MSCs and ECs.
To spatially resolve where the MSCs deviated from the radial model and migrated toward the ECs, heat maps of cell direction identified the locations where the cells followed the coculture model over the radial model (Fig. 3I). The red areas of the heat map indicate the specific regions where the MSCs responded to the paracrine signaling effects of ECs by changing course from a radial migratory pattern, which occurred close to the EC-containing rectangles. By comparison, the heat map of the angle magnitudes (Fig. 3H) for the MSC-only data compared with the single-gradient model showed no spatial localization.
Discussion
This simple assembly technique solves some of the problems of fidelity and stepwise construction of cellular microenvironments, by virtue of precision, versatility, and scalability. Precision was achieved using mutual geometric exclusion, where shape-coded hydrogels could be uniquely tuned to ensure high specificity of spatial docking within the hydrogel template (Fig. 1). Versatility was achieved using combinatorial patterning of multiple shape geometries with customizable amounts of encapsulated cells and fluorescently labeled surrogates of cytokines. Additionally, the hydrogel material, GelMA, is highly biocompatible, supports physiologic cell functions, and has tunable stiffness and diffusivity. Efficiency and scalability were achieved through the use of an iterative docking–resuspension protocol (Fig. 1). Shear protection allowed for rapid conjugate-well filling due to accumulation of successfully docked shapes in the final assembly. Because each docking event was independent, organization occurred in parallel, solving scalability problems, as the building blocks were placed not sequentially, but simultaneously. Thus, both microsized cell niches and large tissue constructs can now be assembled over short time periods.
Cell migration was particularly apt to study diffusive cell–cell communication during vasculogenic network formation, due to the visible spatial organization of vascular cells along the concentration gradient fields (Figs. 2 and 3). Despite potentially complicated signaling networks between MSCs and ECs, the pattern formation was predictable using only two driving forces—MSC–MSC repulsion and MSC–EC attraction. The mechanism of outward cell migration is not fully understood (41, 42) and has been described as a general diffusive process (43, 44). Using the microscale hydrogel system and an image-processing algorithm, we generated a large and reproducible cell vector dataset, to quantitate the rates of migration that increased by ∼40% due to the chemotactic effects of ECs that attracted MSCs. As literature suggests that the PDGF-BB secreted by ECs is a key recruitment signal for MSCs (33, 45–49), our future experiments will investigate the role of PDGF-BB in EC–MSC interactions, among multiple factors that may be at play in microscale hydrogel environments we describe here.
We present a universal fabrication platform for precisely generating complex 3D cell microenvironments over multiple size scales, by patterning any number of encapsulated cells and molecular species, in any configuration, simultaneously. The characterization of paracrine cell–cell interactions was done using advanced image processing, finite element modeling, and complex 3D cell patterning. Two model growth patterns for MSC migration provided the basis for mathematical models defining spatial maps of diffusive cell communication. Due to the pervasive effect of the cell microenvironment on cell function, we envision that this method of subunit-based microenvironmental assembly will be used to explore numerous processes, such as tumor metastasis, stem cell differentiation, and scaling for large, spatially designed tissue engineered constructs.
Materials and Methods
Cell Culture.
Human MSCs were isolated from fresh bone marrow aspirates obtained from Cambrex Life Sciences as previously described (38, 50), grown in high-glucose DMEM with 10% (vol/vol) FBS and 1% penicillin/streptomycin (all from Invitrogen) with 0.1 ng/mL basic FGF (Invitrogen), and expanded to passage 8 or lower. Human umbilical vein endothelial cells were isolated from postnatal discarded umbilical veins and fully de-identified following the protocol IRB-AAAC4839 approved by the Columbia University Institutional Review Board, and grown using EGM-2 Media (Lonza) to passage 8 or lower. Rat neonatal cardiomyocytes were harvested from day 1–2 neonatal rats as in our previous studies (51) under protocol AC-AAAB2757 approved by the Columbia University Institutional Animal Care and Use Committee.
Micromolding of Hydrogel Shapes and Templates.
GelMA was synthesized according to a previously published method (39, 40). PDMS (Fisher) molds for generating the hydrogel shapes and wells were prepared using standard soft lithography. The masks used in SU-8 (Microchem) photolithography to fabricate master molds were generated by (Cad/Art Services). Specifically, molds for circle shapes were 600 µm in diameter × 500 µm deep, rectangles were 300 µm wide × 750 µm long × 300 µm deep, and triangles were equilateral with each side being 600 µm × 300 µm deep. Shapes used in the cardiomyocyte study were 100 µm wide × 300 µm or 1,000 µm long × 100 µm deep. Each shape was generated in ∼400 repeating copies per batch, using a 4 cm × 2.5 cm mold. Molds for the well templates were fabricated using the same soft lithography technique. PDMS molds were created from the master patterns, washed, dried, and plasma cleaned for 60 s.
Hydrogel shapes were fabricated using a 10% (wt/vol) prepolymer solution of GelMA, 1% (wt/vol) 2-hydroxy-1-[4-(2-hydroxyethoxy)phenyl]-2-methyl-1-propanone (Irgacure-2959; BASF), and 1% (vol/vol) 1-vinyl-2-pyrrolidone (Sigma) in PBS (Invitrogen). For each geometric shape, a defined concentration of cells or fluorescently labeled molecules was added to each prepolymerization GelMA solution. The GelMA solution containing a desired concentration of specific cells or molecular species was pipetted onto the PDMS mold, placed on a glass slide excluding excess GelMA, and exposed to UV light for 30 s (Omnicure 100; Lumen Dynamics). Following polymerization, the shapes were harvested from the wells by resuspension and pipetting. To generate conjugate well templates, masks with a specific configuration of multiple geometric shapes were used to generate the PDMS molds. The 10% (wt/vol) prepolymer GelMA solution was placed between the PDMS mold and a glass slide treated with 3-(trimethoxysilyl)propyl methacrylate (Sigma) to permit a covalent linkage of the well hydrogel to the glass substrate upon polymerization. For additional specifications, please see Fig. 1 and Fig. S1.
Sorting and Docking.
After fabrication, a mixture of geometric shapes needed for a specific experiment was suspended in DMEM at a concentration of ∼100 shapes per mL. A suspension of the three canonical shapes—circle, triangle and rectangle—was pipetted on the hydrogel template containing a specific configuration of geometrically different wells, and allowed to settle for 1 min. The hydrogel template was then exposed to agitation using an orbital shaker (Innova 4000; New Brunswick Scientific) set to 90 rpm, which allowed sufficient agitation to resuspend incorrectly sorted shapes, but was gentle enough to maintain shear protection for the correctly sorted shapes. After 1 min of agitation, the shapes were allowed to settle again for 1 min. This process was repeated for up to 10 cycles, by which time the well templates were occupied by properly docked shapes. Following sorting, excess shapes were washed away from the wells, and an additional layer of un–cross-linked GelMA was UV polymerized for 30 s to permanently lock the sorted shapes.
Shape Sorting Analysis.
A suspension containing excess amount of hydrogel shapes of any specific type was pipetted onto a template in form of a Cartesian grid of circles, triangles, and rectangles at a density of 92 wells per cm2. For each shape and gel concentration, the docking specificity was calculated as a ratio of correctly sorted shapes and the total number of docked shapes. The docking yield was calculated as a ratio of the number of the docked shapes of a particular type and the number of congruent wells.
Diffusion Studies.
Circular shapes were suspended in a 100 µg/mL Texas Red-tagged 10-kDa dextran or Texas Red-tagged BSA. Rectangular shapes were suspended in a 100 µg/mL Alexa 488-tagged 10-kDa dextran or Alexa 488-tagged BSA for 8 h to allow the fluorescently tagged molecules to fully diffuse into the gel (all reagents, Invitrogen). Shapes were sorted and assembled into the template wells, and fluorescence images of the patterns were taken every 10 min over 100 min at the same image settings. Using MATLAB, areas with the shapes were masked out, and fluorescence intensity of the remaining images was normalized to the maximum intensity of all images in the experiment. As an additional metric comparing 10% and 20% GelMA, the distance at which fluorescence intensity dropped below 50% was measured for each time point.
Cell Migration.
MSCs were encapsulated into circular shapes; ECs were encapsulated into rectangular shapes at a concentration of 106 cells/mL. For the migration experiments, the hydrogel template contained patterns with a central circle (600 µm diameter × 750 µm deep) surrounded by four rectangles (300 µm wide × 750 µm long × 750 µm deep) that were spaced 750 µm from the center of the circle. Cells were cultured in EGM-2, and phase contrast images were taken at regular intervals for up to 14 d.
Numerical Simulation of Diffusion Gradients.
The multiphysics software COMSOL (COMSOL AB) was used to solve the partial differential equation (PDE) for diffusion of bioactive molecular species (encapsulated in hydrogel or released by the cells) over the entire domain [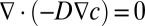 , where D is the diffusion coefficient, and c is the concentration of molecular species]. We chose the whole template to serve as a simulation domain, because we were interested in cellular migratory behavior in the template and not within the shapes themselves. We assume that the molecular diffusion within the shapes did not affect the gradient within the template. The circumferential boundary conditions of different shapes—positive flux for the growth factor secreting cells (ECs as a sink) and negative flux for the growth factor-consuming cells (MSCs as a source)—were defined using the following equation:
 , where
  is the normal vector and
  is the constant inward flux at the boundary. We further set the initial growth factor concentration at zero throughout the entire domain (
 ), defined the domain boundaries with convective flux (which denotes that the growth factor can freely diffuse in and out of the domain), and held the diffusion coefficient constant over the domain (
 ). To achieve short simulation times with high accuracy, we chose a mesh size of 2 µm in the vicinity of the boundaries and 10 µm in the bulk. We used “Direct (UMFPACK)” solver to solve the PDE with the above boundary conditions and exported the concentration gradient vector map to compare with the experimental data.
Image Analysis of Cell Migration.
Cell migration images were processed by MATLAB to inscribe vectors quantifying their orientation. Images were masked to remove the area containing shapes, because the shapes gave obvious noncell vectors due to edge effects. The subsequent image was smoothed using a reconstruction algorithm, with a close-open filtering sequence. A serial opening by reconstruction using disk-shaped structuring elements of 2–7 pixels in diameter allowed for discolorations within the cell to be removed without affecting the cell boundaries, effectively smoothing the cell image while preserving clear edges of the cell boundaries. A Gaussian filter further reduced noise in the images by using a rotationally symmetric Gaussian blur for each pixel. Next, the images were thresholded using a high-pass filter to remove low-intensity pixels from the background. A Sobel operator was used to accentuate cell edges, with the gradient of pixel intensity used to highlight the regions with large differences in pixel intensity, corresponding to a cell edge. A watershed transformation allowed the segmentation of each cell into an enclosed shape for further analysis (Fig. S7). Using built-in ImageJ functions, an ellipse was fit to each segmented cell, where the centroid of the ellipse demarcated the location of the cell and the long axis was used as the cell vector.
Determination of Migration Rate.
Images were quantified for overall migration rates using vectors generated from day 14 images. The total distance from the circle edge to the leading migration edge was measured using ImageJ by connecting vectors head to tail, resulting in a total distance traveled. This analysis was performed for all points around the circle and averaged over time, resulting in an average migration rate for the MSC alone and MSC–EC coculture groups.
Cell Vector Analysis.
To compare the measured angles of cell vectors with the model predictions, each cell location was correlated to the model by aligning the hydrogel rectangles on bright-field images to the rectangles in the model, and scaling the distances so all of the cell images would be spatially compatible. Each cell vector was compared with the associated model vector and the dot product was used to determine the angle between the two vectors, to be used to generate heat maps and histograms.
Heat Maps.
Heat maps were generated using a MATLAB script with the grid-fit function to derive the plots from the cell vector angle data. For monoculture heat maps (Fig. 3G), the angle between each cell vector and its associated radial vector was determined from the dot vector product, and plotted as a heat map (with red corresponding to 90°, and blue corresponding to 0°). For coculture heat maps (Fig. 3I), the angle between the measured and modeled coculture cell vectors and the coculture model was compared with the radial diffusion model. The heat maps highlight in red the regions where the coculture cell vectors showed agreement with the coculture diffusion model, but not the radial model.
Statistics.
To compare the effect of shape geometry or hydrogel composition on the yield of shape sorting, two-way ANOVA was performed (n = 3, P < 0.05). Furthermore, to compare efficiency, two-way ANOVA was performed at each round of shaking (n = 3, P < 0.05). To establish differences between the experimental groups for cardiac contraction studies, the nonparametric, Wilcoxon rank sum test (also known as Mann–Whitney U test) was used (n = 27–50, α = 0.05, P < 0.01). Statistical differences between migration rates for MSC-alone and MSC–EC groups were determined using a two-sample t test (n > 26, P < 0.05). A circular statistics toolbox designed for MATLAB was used to compare the average angle differences between the cell data and models (n = 2,500) (52). The Watson–Williams two-sample test (circular analog to the Student t test) was used to compare the groups, with the angle binning of <10°. This test assumes an appropriate von Mises distribution or circular analog of the normal distribution (52). With α = 0.05, a final P value was <0.01. Normality testing using the Kuiper test (circular invariant analog to Kolmogorov–Smirnov test) demonstrated normal distributions of compared with the von Mises distribution.
For additional details on GelMA synthesis, mechanical testing, and cardiac contraction analysis, please see SI Materials and Methods.
Supplementary Material
Acknowledgments
This work has been supported by National Institutes of Health Grants HL076485 and EB002520 (to G.V.-N.) and HL112505 (to G.E.).
Footnotes
The authors declare no conflict of interest.
This article is a PNAS Direct Submission.
This article contains supporting information online at www.pnas.org/lookup/suppl/doi:10.1073/pnas.1300569110/-/DCSupplemental.
References
- 1.Turing AM. The chemical basis of morphogenesis. Phil Trans R Soc Lond B. 1952;237:37–72. [Google Scholar]
- 2.Kondo S, Miura T. Reaction-diffusion model as a framework for understanding biological pattern formation. Science. 2010;329(5999):1616–1620. doi: 10.1126/science.1179047. [DOI] [PubMed] [Google Scholar]
- 3.Zhang S. Fabrication of novel biomaterials through molecular self-assembly. Nat Biotechnol. 2003;21(10):1171–1178. doi: 10.1038/nbt874. [DOI] [PubMed] [Google Scholar]
- 4.Tambe DT, et al. Collective cell guidance by cooperative intercellular forces. Nat Mater. 2011;10(6):469–475. doi: 10.1038/nmat3025. [DOI] [PMC free article] [PubMed] [Google Scholar]
- 5.Nelson CM, et al. Emergent patterns of growth controlled by multicellular form and mechanics. Proc Natl Acad Sci USA. 2005;102(33):11594–11599. doi: 10.1073/pnas.0502575102. [DOI] [PMC free article] [PubMed] [Google Scholar]
- 6.Fukuda J, et al. Micromolding of photocrosslinkable chitosan hydrogel for spheroid microarray and co-cultures. Biomaterials. 2006;27(30):5259–5267. doi: 10.1016/j.biomaterials.2006.05.044. [DOI] [PubMed] [Google Scholar]
- 7.Madden LR, et al. Proangiogenic scaffolds as functional templates for cardiac tissue engineering. Proc Natl Acad Sci USA. 2010;107(34):15211–15216. doi: 10.1073/pnas.1006442107. [DOI] [PMC free article] [PubMed] [Google Scholar]
- 8.Marolt D, et al. Engineering bone tissue from human embryonic stem cells. Proc Natl Acad Sci USA. 2012;109(22):8705–8709. doi: 10.1073/pnas.1201830109. [DOI] [PMC free article] [PubMed] [Google Scholar]
- 9.Grayson WL, et al. Engineering anatomically shaped human bone grafts. Proc Natl Acad Sci USA. 2010;107(8):3299–3304. doi: 10.1073/pnas.0905439106. [DOI] [PMC free article] [PubMed] [Google Scholar]
- 10.Radisic M, et al. Functional assembly of engineered myocardium by electrical stimulation of cardiac myocytes cultured on scaffolds. Proc Natl Acad Sci USA. 2004;101(52):18129–18134. doi: 10.1073/pnas.0407817101. [DOI] [PMC free article] [PubMed] [Google Scholar]
- 11.Naito H, et al. Optimizing engineered heart tissue for therapeutic applications as surrogate heart muscle. Circulation. 2006;114(1, Suppl):I72–I78. doi: 10.1161/CIRCULATIONAHA.105.001560. [DOI] [PubMed] [Google Scholar]
- 12.Scadden DT. The stem-cell niche as an entity of action. Nature. 2006;441(7097):1075–1079. doi: 10.1038/nature04957. [DOI] [PubMed] [Google Scholar]
- 13.Gupta GP, Massagué J. Cancer metastasis: Building a framework. Cell. 2006;127(4):679–695. doi: 10.1016/j.cell.2006.11.001. [DOI] [PubMed] [Google Scholar]
- 14.Griffith LG, Swartz MA. Capturing complex 3D tissue physiology in vitro. Nat Rev Mol Cell Biol. 2006;7(3):211–224. doi: 10.1038/nrm1858. [DOI] [PubMed] [Google Scholar]
- 15.Chen CS, Mrksich M, Huang S, Whitesides GM, Ingber DE. Geometric control of cell life and death. Science. 1997;276(5317):1425–1428. doi: 10.1126/science.276.5317.1425. [DOI] [PubMed] [Google Scholar]
- 16.Joyce JA, Pollard JW. Microenvironmental regulation of metastasis. Nat Rev Cancer. 2009;9(4):239–252. doi: 10.1038/nrc2618. [DOI] [PMC free article] [PubMed] [Google Scholar]
- 17.Lutolf MP, Hubbell JA. Synthetic biomaterials as instructive extracellular microenvironments for morphogenesis in tissue engineering. Nat Biotechnol. 2005;23(1):47–55. doi: 10.1038/nbt1055. [DOI] [PubMed] [Google Scholar]
- 18.Khademhosseini A, Langer R, Borenstein J, Vacanti JP. Microscale technologies for tissue engineering and biology. Proc Natl Acad Sci USA. 2006;103(8):2480–2487. doi: 10.1073/pnas.0507681102. [DOI] [PMC free article] [PubMed] [Google Scholar]
- 19.Hutmacher DW. Biomaterials offer cancer research the third dimension. Nat Mater. 2010;9(2):90–93. doi: 10.1038/nmat2619. [DOI] [PubMed] [Google Scholar]
- 20.Derda R, et al. Paper-supported 3D cell culture for tissue-based bioassays. Proc Natl Acad Sci USA. 2009;106(44):18457–18462. doi: 10.1073/pnas.0910666106. [DOI] [PMC free article] [PubMed] [Google Scholar]
- 21.Alsberg E, Anderson KW, Albeiruti A, Rowley JA, Mooney DJ. Engineering growing tissues. Proc Natl Acad Sci USA. 2002;99(19):12025–12030. doi: 10.1073/pnas.192291499. [DOI] [PMC free article] [PubMed] [Google Scholar]
- 22.Liu VA, Bhatia SN. Three-dimensional photopatterning of hydrogels containing living cells. Biomed Microdevices. 2002;4(4):257–266. [Google Scholar]
- 23.Luo Y, Shoichet MS. A photolabile hydrogel for guided three-dimensional cell growth and migration. Nat Mater. 2004;3(4):249–253. doi: 10.1038/nmat1092. [DOI] [PubMed] [Google Scholar]
- 24.Du Y, Lo E, Ali S, Khademhosseini A. Directed assembly of cell-laden microgels for fabrication of 3D tissue constructs. Proc Natl Acad Sci USA. 2008;105(28):9522–9527. doi: 10.1073/pnas.0801866105. [DOI] [PMC free article] [PubMed] [Google Scholar]
- 25.Jakab K, et al. Tissue engineering by self-assembly and bio-printing of living cells. Biofabrication. 2010;2(2):022001. doi: 10.1088/1758-5082/2/2/022001. [DOI] [PMC free article] [PubMed] [Google Scholar]
- 26.Jakab K, Neagu A, Mironov V, Markwald RR, Forgacs G. Engineering biological structures of prescribed shape using self-assembling multicellular systems. Proc Natl Acad Sci USA. 2004;101(9):2864–2869. doi: 10.1073/pnas.0400164101. [DOI] [PMC free article] [PubMed] [Google Scholar]
- 27.DeForest CA, Polizzotti BD, Anseth KS. Sequential click reactions for synthesizing and patterning three-dimensional cell microenvironments. Nat Mater. 2009;8(8):659–664. doi: 10.1038/nmat2473. [DOI] [PMC free article] [PubMed] [Google Scholar]
- 28.Wylie RG, et al. Spatially controlled simultaneous patterning of multiple growth factors in three-dimensional hydrogels. Nat Mater. 2011;10(10):799–806. doi: 10.1038/nmat3101. [DOI] [PubMed] [Google Scholar]
- 29.Albrecht DR, Underhill GH, Wassermann TB, Sah RL, Bhatia SN. Probing the role of multicellular organization in 3D microenvironments. Nat Methods. 2006;3(5):369–375. doi: 10.1038/nmeth873. [DOI] [PubMed] [Google Scholar]
- 30.Koh WG, Itle LJ, Pishko MV. Molding of hydrogel microstructures to create multiphenotype cell microarrays. Anal Chem. 2003;75(21):5783–5789. doi: 10.1021/ac034773s. [DOI] [PubMed] [Google Scholar]
- 31.Revzin A, et al. Fabrication of poly(ethylene glycol) hydrogel microstructures using photolithography. Langmuir. 2001;17(18):5440–5447. doi: 10.1021/la010075w. [DOI] [PubMed] [Google Scholar]
- 32.Kim D-H, et al. Nanoscale cues regulate the structure and function of macroscopic cardiac tissue constructs. Proc Natl Acad Sci USA. 2010;107(2):565–570. doi: 10.1073/pnas.0906504107. [DOI] [PMC free article] [PubMed] [Google Scholar]
- 33.Folkman J, D’Amore PA. Blood vessel formation: What is its molecular basis? Cell. 1996;87(7):1153–1155. doi: 10.1016/s0092-8674(00)81810-3. [DOI] [PubMed] [Google Scholar]
- 34.Armulik A, Abramsson A, Betsholtz C. Endothelial/pericyte interactions. Circ Res. 2005;97(6):512–523. doi: 10.1161/01.RES.0000182903.16652.d7. [DOI] [PubMed] [Google Scholar]
- 35.Koike N, et al. Tissue engineering: Creation of long-lasting blood vessels. Nature. 2004;428(6979):138–139. doi: 10.1038/428138a. [DOI] [PubMed] [Google Scholar]
- 36.Trkov S, Eng G, Di Liddo R, Parnigotto PP, Vunjak-Novakovic G. Micropatterned three-dimensional hydrogel system to study human endothelial-mesenchymal stem cell interactions. J Tissue Eng Regen Med. 2010;4(3):205–215. doi: 10.1002/term.231. [DOI] [PMC free article] [PubMed] [Google Scholar]
- 37.Zervantonakis IK, et al. Three-dimensional microfluidic model for tumor cell intravasation and endothelial barrier function. Proc Natl Acad Sci USA. 2012;109(34):13515–13520. doi: 10.1073/pnas.1210182109. [DOI] [PMC free article] [PubMed] [Google Scholar]
- 38.Jeong GS, et al. Sprouting angiogenesis under a chemical gradient regulated by interactions with an endothelial monolayer in a microfluidic platform. Anal Chem. 2011;83(22):8454–8459. doi: 10.1021/ac202170e. [DOI] [PubMed] [Google Scholar]
- 39.Van Den Bulcke AI, et al. Structural and rheological properties of methacrylamide modified gelatin hydrogels. Biomacromolecules. 2000;1(1):31–38. doi: 10.1021/bm990017d. [DOI] [PubMed] [Google Scholar]
- 40.Nichol JW, et al. Cell-laden microengineered gelatin methacrylate hydrogels. Biomaterials. 2010;31(21):5536–5544. doi: 10.1016/j.biomaterials.2010.03.064. [DOI] [PMC free article] [PubMed] [Google Scholar]
- 41.Lauffenburger DA, Horwitz AF. Cell migration: A physically integrated molecular process. Cell. 1996;84(3):359–369. doi: 10.1016/s0092-8674(00)81280-5. [DOI] [PubMed] [Google Scholar]
- 42.Ridley AJ, et al. Cell migration: Integrating signals from front to back. Science. 2003;302(5651):1704–1709. doi: 10.1126/science.1092053. [DOI] [PubMed] [Google Scholar]
- 43.Kobayashi K, et al. Novel method for the quantitative assessment of cell migration: A study on the motility of rabbit anterior cruciate (ACL) and medial collateral ligament (MCL) cells. Tissue Eng. 2000;6(1):29–38. doi: 10.1089/107632700320865. [DOI] [PubMed] [Google Scholar]
- 44.Campos D, Méndez V, Llopis I. Persistent random motion: Uncovering cell migration dynamics. J Theor Biol. 2010;267(4):526–534. doi: 10.1016/j.jtbi.2010.09.022. [DOI] [PubMed] [Google Scholar]
- 45.Hirschi KK, Rohovsky SA, Beck LH, Smith SR, D’Amore PA. Endothelial cells modulate the proliferation of mural cell precursors via platelet-derived growth factor-BB and heterotypic cell contact. Circ Res. 1999;84(3):298–305. doi: 10.1161/01.res.84.3.298. [DOI] [PubMed] [Google Scholar]
- 46.Hellström M, Kalén M, Lindahl P, Abramsson A, Betsholtz C. Role of PDGF-B and PDGFR-beta in recruitment of vascular smooth muscle cells and pericytes during embryonic blood vessel formation in the mouse. Development. 1999;126(14):3047–3055. doi: 10.1242/dev.126.14.3047. [DOI] [PubMed] [Google Scholar]
- 47.Ponte AL, et al. The in vitro migration capacity of human bone marrow mesenchymal stem cells: Comparison of chemokine and growth factor chemotactic activities. Stem Cells. 2007;25(7):1737–1745. doi: 10.1634/stemcells.2007-0054. [DOI] [PubMed] [Google Scholar]
- 48.Cool J, DeFalco TJ, Capel B. Vascular-mesenchymal cross-talk through Vegf and Pdgf drives organ patterning. Proc Natl Acad Sci USA. 2011;108(1):167–172. doi: 10.1073/pnas.1010299108. [DOI] [PMC free article] [PubMed] [Google Scholar]
- 49.Ozaki Y, et al. Comprehensive analysis of chemotactic factors for bone marrow mesenchymal stem cells. Stem Cells Dev. 2007;16(1):119–129. doi: 10.1089/scd.2006.0032. [DOI] [PubMed] [Google Scholar]
- 50.Bhumiratana S, et al. Nucleation and growth of mineralized bone matrix on silk-hydroxyapatite composite scaffolds. Biomaterials. 2011;32(11):2812–2820. doi: 10.1016/j.biomaterials.2010.12.058. [DOI] [PMC free article] [PubMed] [Google Scholar]
- 51.Radisic M, Marsano A, Maidhof R, Wang Y, Vunjak-Novakovic G. Cardiac tissue engineering using perfusion bioreactor systems. Nat Protoc. 2008;3(4):719–738. doi: 10.1038/nprot.2008.40. [DOI] [PMC free article] [PubMed] [Google Scholar]
- 52.Berens P. CircStat: A MATLAB toolbox for circular statistics. J Stat Softw. 2009;31(10):1–21. [Google Scholar]
Associated Data
This section collects any data citations, data availability statements, or supplementary materials included in this article.