Abstract
This study shows that antifungal curcumin (CUR), significantly depletes ergosterol levels in Candida albicans. CUR while displaying synergy with fluconazole (FLC) lowers ergosterol. However, CUR alone at its synergistic concentration (lower than MIC50), could not affect ergosterol contents. For deeper insight of CUR effects on lipids, we performed high throughput mass spectroscopy (MS) based lipid profiling of C. albicans cells. The lipidome analysis revealed that there were no major changes in PGLs composition following CUR treatment of Candida, however, significant differences in molecular species of PGLs were detected. Among major SPLs, CUR treatment resulted in the reduction of ceramide and accumulation of IPCs levels. The lipidome of CUR treated cells confirmed a dramatic drop in the ergosterol levels with a simultaneous accumulation of its biosynthetic precursors. This was further supported by the fact that the mutants defective in ergosterol biosynthesis (ERG2 and ERG11) and those lacking the transcription factor regulating ergosterol biosynthesis, UPC2, were highly susceptible to CUR. Our study first time shows that CUR, for its antifungal activity, targets and down regulates Δ5, 6 desaturase (ERG3) resulting in depletion of ergosterol. This results in parallel accumulation of ergosterol biosynthetic precursors, generation of ROS and cell death.
Keywords: Candida albicans; Curcumin; Ergosterol; Δ5,6; desaturase Lipid homeostasis
2. INTRODUCTION
Infections caused by pathogenic Candida albicans are commonly treated either by azoles or non-azole antifungal agents (1, 2). Azole drugs are most widely deployed in clinics which inhibit the biosynthesis of fungal specific sterol, ergosterol. The primary molecular target of azole drug is Erg11p which catalyzes 14α-demethylation of lanosterol in the ergosterol biosynthesis pathway (3). Ergosterol modulates various cellular functions since it constitutes an important component of membrane lipids of plasma membrane (PM) and membranes of other intracellular organelles. (4–6). The presence of discrete membrane microdomains in PM, predominantly composed of sphingolipids (SLs) and sterols, play an important role in membrane organization and function (7–9). Ergosterol has been an effective and attractive target in antifungal chemotherapy because of its absence in mammals. The search for novel and new antifungal drug targets continues since we still have a limited repertoire of effective antifungal drugs. Nonetheless, the identification of novel antifungal targets unique to fungi has been a challenge, given the remarkable similarity between fungal and mammalian metabolic and signal transduction pathways.
Many herbal products such as allicin (from Allium sativum), berberine (from Berberis heterophylla), jatorrhizine (from Enantia chlorantha), xanthorrhizol (from Curcuma xanthorrhiza), retigeric acid (from the lichen, Lobaria kurokawae), grapefruit seed extract, tea tree oil are known to have antifungal properties either alone or in combination with known antifungals (10–12). However, very little is known about the targets of these natural products.
Curcumin (CUR), a phenolic compound extracted from the rhizomes of Curcuma longa is known to have therapeutic potential due to its anti-inflammatory, anti-carcinogenic, and anti-infectious properties (13,14). CUR exerts its pleiotropic effect through targeting multiple cellular signaling pathways (15, 16). We have recently reported that CUR also has antifungal properties against various species of Candida. We also showed that antifungal CUR generates oxidative stress, inhibits hyphae development and when given in combination, is synergistic to azoles and polyenes (17, 18).
In the present study, we show that CUR at its MIC50 concentration depletes ergosterol levels in Candida cells. Interestingly, CUR alone at its synergistic concentration do not affect ergosterol levels, however, it does so only when given in combination with FLC. To evaluate the global effects of CUR treatment particularly on lipid metabolism, we carried out a detailed lipidomic analysis of Candida cells. Through high throughput mass spectroscopy (MS) based lipid profiling; we show that CUR treatment not only depletes ergosterol levels but also accumulates its biosynthetic intermediates such as farnesol, squalene and lanosterol. As demonstrated by RT-PCR, CUR targets ERG3 causing decrease in its expression levels which leads to ergosterol depletion and in the accumulation of other biosynthetic intermediates.
3. MATERIALS AND METHODS
3.1 Materials
Commercial grade mixture of curcuminoids, commonly known as CUR, and other molecular grade chemicals were obtained from Sigma Chemicals Co. (St. Louis, Mo). Synthetic lipids with fatty acid (FA) compositions that are not found or are of very low abundance in Candida were used as internal standards. Lipid standards were obtained from Avanti Polar Lipids (Alabaster, AL).
3.2 Strains, Media and Culture conditions
SC5314, the wild type strain of C. albicans is used in this study. The cells were cultured in Yeast Extract Peptone Dextrose (YEPD) broth (BIO101, Vista, Calif.). For agar plates, 2.5% (w/v) bacto agar (Difco, BD Biosciences, NJ) was added to the medium. All strains were stored as frozen stocks with 15% glycerol at −80°C. Before each experiment, cells were freshly revived on YEPD plates from the stock. The cells were diluted into 50 ml fresh medium at 0.1 OD at A600 (~106 cells/ml) and grown for 14 hrs until the cells reached exponential growth (~2 X 10⁸ cells/ml). For CUR treatment 0.1 OD cells were allowed to reach 0.4 OD and then 92.5 μg/ml of CUR (MIC50) was added. The treated and untreated cells were harvested and used for RNA isolation and lipid extraction.
3.3 RNA Isolation
RNA isolation was done essentially by following Trizol (Sigma) method as per manufacturer’s specifications, except that 300 μl acid washed 0.4–0.6 mm glass beads (Sigma, St. Louis, MO) were used during cell lysis. RNA was precipitated using absolute ethanol and washed twice with 80% ethanol, dried and resuspended in 50 μl diethylpyrocarbonate (DEPC) treated water at 58o C. RNA obtained was quantitated spectrophometrically and it was also electrophoresed in denaturing formaldehyde gel (19).
3.4 RT-PCR
RT-PCR was done essentially as mentioned in the RevertAid™ H Minus kit (MBI, Fermentas). Briefly, RNA isolated by above described process was treated with DNase at 37°C for 30 mins. This reaction was terminated by addition of 1 μl of 25mM EDTA and incubated at 65°C for 10 mins. 1μg isolated RNA was primed with oligo (dT)18 for first strand cDNA syntheis at 42°C for 60 min. Reverse transcription reaction was terminated by heating at 70°C for 5 min. The synthesized cDNA product (normally 2μl) was used in PCR (50 μl) primed with specific forward and reverse primers. ACT1 was used as endogenous control. The amplified products were gel electrophoresed and quantitated.
3.5 Lipid Extraction
Lipids were extracted from Candida cells using a slight modification of the method of Bligh and Dyer (20). Briefly, the Candida cells were harvested at exponential phase and were suspended in 10 ml methanol. 4 g glass beads (Glaperlon 0.40–0.60 mm) were added and the suspension was shaken in a cell disintegrator (B. Braun, Melsungen, Germany) four times for 30 sec. with a gap of 30 sec. between shakings. Approximately 20 ml chloroform was added to the suspension to give a ratio of 2:1 of chloroform:methanol (v/v). The suspension was stirred on a flat-bed stirrer at room temperature for 2 hrs. The suspension was filtered through Whatman No. 1 filter paper, and the extract was transferred to a separatory funnel and washed with 0.2 volumes of 0.9% NaCl to remove the non-lipid contaminants. The aqueous layer was aspirated and the solvent of the lipid-containing, lower organic layer was evaporated under N2; the lipids were stored at −80°C until analysis.
3.6 Electron spray ionization tandem mass spectrometry (ESI-MS/MS) based lipid profiling
3.6.1 Phosphoglyceride Quantification
An automated ESI-MS/MS approach was used. Data acquisition and analysis was carried out as described previously by Singh et al. (21, 22) with minor modifications. The extracted dry lipid samples were dissolved in 1 ml chloroform (21, 22). An aliquot of 2 to 8 μl of extract in chloroform was analyzed, with the exact amount depending upon the dry lipid weight of each sample. Precise amounts of internal standards, obtained and quantified as previously described by Welti et al. (23), were added in the following quantities (with some small variation in amounts in different batches of internal standards): 0.6 nmol di12:0-PC (phosphatidyl choline), 0.6 nmol di24:1-PC, 0.6 nmol 13:0-LysoPC (lysophosphatidyl choline), 0.6 nmol 19:0-LysoPC, 0.3 nmol di12:0-PE (phosphatidyl ethanolamine), 0.3 nmol di23:0-PE, 0.3 nmol 14:0-LysoPE (lysophosphatidyl choline), 0.3 nmol 18:0-LysoPE, 0.3 nmol di14:0-PG (phosphatidyl glycerol), 0.3 nmol di20:0 (phytanoyl)-PG, 0.3 nmol 14:0-LysoPG (lysophosphatidyl glycerol), 0.3 nmol 18:0-LysoPG, 0.3 nmol di14:0-PA (phosphatidic acid), 0.3 nmol di20:0 (phytanoyl)-PA, 0.2 nmol di14:0-PS (phosphatidyl serine), 0.2 nmol di20:0 (phytanoyl)-PS, 0.23 nmol 16:0–18:0-PI (phosphatidyl inositol), 0.16 nmol di18:0-PI. The sample and internal standard mixture was combined with solvents, such that the ratio of chloroform/methanol/300 mM ammonium acetate in water was 300/665/35 (v/v/v) in a final volume of 1.4 ml. Each phosphoglyceride (PGL) class was quantified in comparison to the two internal standards of that class. Unfractionated lipid extracts were directly introduced by continuous infusion into the ESI source on a triple quadrupole MS (API 4000, Applied Biosystems, Foster City, CA). Samples were introduced using an autosampler (LC Mini PAL, CTC Analytics AG, Zwingen, Switzerland) fitted with the required injection loop for the acquisition time and passed to the ESI needle at 30 μl/min.
Sequential precursor (Pre) and neutral loss (NL) scans of the extracts produce a series of spectra revealing a set of lipid species containing a common head group fragment. Lipid species were detected with the following scans: PC and LysoPC, [M + H]+ ions in positive ion mode with Pre 184.1; PE and LysoPE, [M + H]+ ions in positive ion mode with NL 141.0; PA, [M + NH4]+ in positive ion mode with NL 115.0; PG, [M + NH4]+ in positive ion mode with NL 189.0 for PG; PI, [M + NH4]+ in positive ion mode with NL 277.0; PS, [M + H]+ in positive ion mode with NL 185.0;LysoPG, [M-H]− in negative mode with Pre 152.9. The collision gas pressure was set at 2 [arbitrary units (au)]. The collision energies, with nitrogen in the collision cell, were +40 V for PC, +28 V for PE, +25 V for PA, +22 V for PG, PI and PS, and −57 V for LysoPG. Declustering potentials were +100 V for PC, PE, PA, PG, PI, and PS, and −100 V for LysoPG. Entrance potentials were +14 V for PC, PA, PG, PI, and PS, +15 V for PE, and −10 V for LysoPG. Exit potentials were +14 V for PC, PA, PG, PI, and PS, +11 V for PE, and −14 V for LysoPG. The mass analyzers were adjusted to a resolution of 0.7 u full width at half height. For each spectrum, 9 to 150 continuum scans were averaged in multiple channel analyzers (MCA) mode. The source temperature (heated nebulizer) was 100°C, the interface heater was “on”, and +5.5 kV or −4.5 kV were applied to the electrospray capillary. The curtain gas was set at 20 au, and the two ion source gases were set at 45 au.
Processing of the data, including isotope deconvolution, was similar to that described earlier (21–23). The analyzed data (in nmol) was normalized to the sample’s “dry lipid weight” to produce data in the units nmol/mg dry lipid weight. Finally, the data were expressed as mole percent of total lipid analyzed.
3.6.2 Sphingolipid Quantification
The ESI-MS/MS procedure for sphingolipid (SL) quantification was similar to that for PGL quantification. Lipid species were detected with the following scans: CER (Ceramide), [M + H–H2O]+ ions in positive ion mode with Pre 300 and Pre 328; IPC (Inositol phosphoryl ceramide, [M - H]− ions in negative ion mode with Pre 259; MIPC (Mannosyl inositol phosphoryl ceramide), [M - H]-ions in negative ion mode with Pre 421; M(IP)2C (Mannosyl di-inositol phosphoryl ceramide), [M-H]− in negative mode with Pre 663.1. The internal standard, 16:0–18:1-PI, was detected with [M + NH4]+ in positive ion mode with NL 277.0, as described in the previous section. The CER internal standard, CER t18:0/8:0, was detected with [M + H–H2O]+ in positive ion mode with Pre 300. The collision gas pressure was set at 2 au. The collision energies, with nitrogen in the collision cell, were +43 V for CER, −72 V for IPC, −80 V for MIPC, and −75 V for M(IP)2C. The declustering potential was +180 V for CER and −180 V for IPC, MIPC, and M(IP)2C. The exit potential was +10 V for CER and −15 V for IPC, MIPC, and M(IP)2C. The mass analyzers were adjusted to a resolution of 0.7 u full width at half height. For each spectrum, 125 to 250 continuum scans were averaged in multiple channel analyzers (MCA) mode. The source temperature (heated nebulizer) was 100°C, the interface heater was “on”, and +5.5 kV or −4.5 kV were applied to the electrospray capillary. The curtain gas was set at 20 au, and the two ion source gases were set at 45 au. The rest of the processing was similar to that for PGLs; however, all SL signals were normalized to the signal for 0.23 nmol 16:0–18:0-PI that was added in as an internal standard.
SL amounts were determined by normalizing the mass spectral signal so that a signal of 1.0 represents a signal equal to the signal of 1 nmol 16:0–18:0-PI (the internal standard). These data were then divided by the sample dry weight to obtain signal/dry weight, by the total SL signal to obtain % of total SL signal. It is possible that there is variation in ionization efficiency among various SLs and between the internal standard and SL species. Thus, normalized SL species amounts may not reflect their molar amounts. However, the employed procedure allows for determination of relative abundance of SLs and comparison of amounts of particular SLs among samples.
3.6.3 Sterol esters, di- and tri-acyl glycerol quantification
The ESI-MS/MS procedure for Sterol ester (SE), Di-acyl glycerol (DAG) and Tri-acyl glycerol (TAG) quantification was similar to that for PGL quantification. Precise amounts of internal standards were added in the following quantities (with some small variation in amounts in different batches of internal standards): 4.6 nmol di15:0-DAG, 3.1 nmol tri17:0-TAG. Lipid species for SE, DAG and TAG were detected with the following scans: 16:1, 16:0, 18:3, 18:2, 18:1 and 18:0 -containing species, were detected as [M + NH4]+ in positive ion mode with NL 271.2, 273.2, 295.2, 297.2, 299.2 and 301.2 respectively. The internal standard, tri17:1-TAG was detected with [M + NH4]+ in positive ion mode with NL 285.2, and di15:0-DAG was detected with [M + NH4]+ in positive ion mode with NL 259.2. The collision gas pressure was set at 2 au. The collision energies, with nitrogen in the collision cell, was +25 V for SE, DAG and TAG. The declustering potential was +100 V for SE, DAG and TAG. The exit potential was +12 V for SE, DAG and TAG. The rest of the processing was similar to that for PGLs; however, all SE signals were normalized to the signal for 4.6 nmol di15:0-DAG that was added in as an internal standard.
For these samples, all SE, DAG and TAG are represented as a list of “fatty acid containing” species. So, there are the 16:0 containing species, the 18:1 containing species and so on. There is no total DAG or TAG, as some of these species overlap with each other. For example, 16:0–18:1 DAG will appear in both the 16:0 containing and the 18:1 containing list. The data for DAG and TAG has been described as “Relative mass spectral signal”, where the unit is the signal for 1 nmol of the internal standard. The data are normalized to dry lipid weight. Thus, these amounts are not true molar amounts, but they can be used to compare the amounts of particular molecular species among samples.
SE amounts were determined by normalizing the mass spectral signal so that a signal of 1.0 represents a signal equal to the signal of 1 nmol di15:0-DAG (the internal standard). The SE data were then divided by the dry lipid weight to obtain signal/dry lipid weight, by the total SE signal to obtain % of total SE signal. It is possible that there is variation in ionization efficiency among various SEs and between the internal standard and SE species. Thus, normalized SE species amounts may not reflect their molar amounts. However, the employed procedure allows for determination of relative abundance of SEs and comparison of amounts of particular SEs among samples.
3.7 Sterol quantification by Gas chromatography mass spectrometry (GCMS)
Total lipids were extracted using the method of Bligh and Dyer (20) and dissolved in 200 μl chloroform. Sterols were extracted and analyzed using the slight modification of the method described previously (24). The saponified lipids were re-extracted using 5 ml hexane and vortexed several times. 1 ml H2O was added to separate the organic phase, which was then dried in N2 gas at 60°C. The extracted sterols were derivatized using 100 μl N, O-Bis (trimethylsilyl) trifluoroacetamide with trimethyl-chlorosilane BSTFA/TMCS (Sigma) at 80°C for 1 hr in N2 gas. The derivatized sterols were then analyzed using GCMS (Schimadzu QP2010 Plus, Japan). Sterols were separated using DB5-MS column 30 m X 0.2 mm, film thickness 0.20 μm. The carrier gas was helium with a flow rate of 1ml/min and a pressure of 80.8 kPa. Initial column temperature of 120°C was held for 1 min. then programmed at 120°C to 300°C at 2°C/min where it was held for 20 min. 1 μl injection was made using a split ratio of 10. Injection temperature was 300°C. The total ion mass spectra were recorded in the mass range m/z 40–650 at the scan rate of 1 s/scan. The interface temperature was 300°C and the detector temperature was 300°C. Peak identification was based on relative retention time and total ion mass spectral comparison with an external standard. Peak identification was based on relative retention time and total ion mass spectral comparison with an external standard (20–22).
4. RESULTS
We had earlier shown that CUR could be exploited as a promising antifungal agent because of its proven growth inhibitory effects and its synergy with azoles and polyenes against Candida species. Since, both azoles and polyenes target the ergosterol or its biosynthetic pathway in Candida, we examined if CUR affects ergosterol or its metabolism. Interestingly, CUR at its antifungal concentration (MIC50= 92.5μg/ml), could reduce ergosterol content up to ~90 %, however, it could not do so at its non-antifungal synergistic concentration (23.12μg/ml). (Figure 1A and B). Notably, CUR in combination with FLC could significantly lower ergosterol levels (~84%) as compared to FLC alone (~48%). For a deeper insight of the CUR effects on sterol and lipid metabolism, we performed a high throughput mass spectroscopy (MS) based lipid profiling of CUR treated Candida cells.
Figure 1. Effect of CUR on ergosterol content.
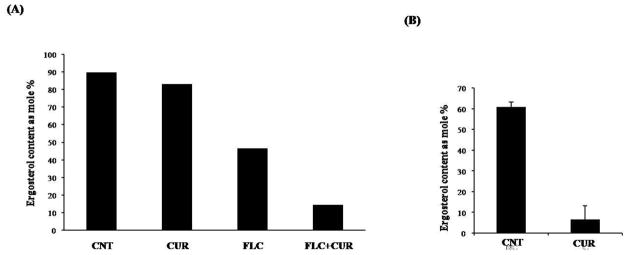
(A) Shows the mole percentage of ergosterol content in C. albicans cells at non-antifungal concentration of CUR (23.12μg/ml).
(B) Shows the mole percentage of ergosterol content at antifungal concentration (MIC50= 92.5 μg/ml).
4.1 Lipidome analysis of CUR treated Candida cells
As described in Materials and Methods section, C. albicans, cells were harvested at the exponential growth phase (2×10⁸ cells/ml) and their total lipids were extracted by employing Bligh and Dyers method (20), subjected to ESI-MS/MS by direct infusion of the lipid extracts into MS, as described in Materials and Methods section. For a comparison among different lipid groups, mole percentage of each lipid group was calculated after totaling the percentages of respective molecular species.
4.2 CUR treatment changes composition of molecular species of PGLs
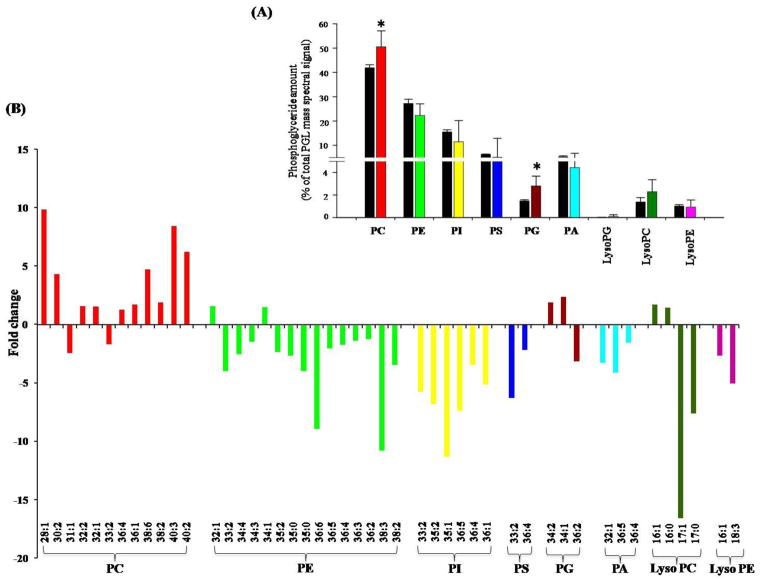
Major phosphoglycerides (PGLs) of C. albicans, identified and analyzed were PC, PE, PI, PS, PG and PA. The abundance of PGLs was in order PC>PE>PI>PS>PA>PG (Figure 2A). A statistically significant increase in PG (48%) and PC (17%) content was observed in CUR treated cells. No major differences were observed in other PGLs levels. The three major lyso-lipids namely LysoPC, LysoPE and LysoPG also did not change upon CUR treatment. Despite the fact that, there were no drastic differences among various PGLs upon CUR treatment, significant profile differences were noticed at the molecular lipid species level (Supplementary Table S1) and Figure 2A.
Figure 2. Effect of CUR on PGLs.
(A) Shows the mole percentage composition of PGL classes.
(B) Depicts fold changes in molecular lipid species composition of PGLs. Only the molecular lipid species that were statistically significant (with p-value <0.05) are included in this figure. The entire data set is shown in the Supplementary Table S1.
Our analysis thus determined nine PGLs. These PLs could be further differentiated based on differences in their composition and the degree of unsaturation of their FAs. Lipid profiling by ESI-MS/MS generated data in the form of “number of acyl carbons: number of acyl carbon-carbon double bonds”. The numbers of detected PGLs species for Candida after CUR treatment were 35, 45, 30, 46, 15, 12, 20, 12 and 5 for PC, PE, PI, PS, PA, LysoPC, PG, LysoPE and LysoPG, respectively. We could detect a total of 220 molecular lipid species belonging to different PLs (Supplementary Table S1). Our analysis revealed that at least 80 molecular lipid species showed statistically significant differences upon CUR treatment (Figure 2B). These species had mono- or di- unsaturation in the lower carbon number PCs, and poly unsaturation for PCs with 34 or more carbon (C) atoms. Out of major PC species, significant increase in amounts were seen in case of 32:0, 32:1, 32:2, 36:1, 36:4 etc. in CUR treated cells (Figure 2B). The molecular species of PE contained 26 to 44 C atoms with poly unsaturation in 34, 36 and 40 C atom diacyl species. Most of the PE species showed significant decrease upon CUR treatment, except 32:1 and 34:1, which were present in higher amounts. PI included major molecular species of 26 to 38 C atoms where poly unsaturation was seen only in PIs with 34 and 36: l C atom containing species. PI species with odd chain FAs (31:1, 33:1, 33:2, 35:1, 35:2) and 36 C atom containing species (36:1, 36:4, 36:5), were significantly reduced upon CUR treatment. PS molecular species contained 30 to 42 C atoms with long chain poly unsaturated FA containing PS species (34:4, 36:3, 36:4, 36:5) showing significant reduction on CUR treatment. The major PG species, 34:1 and 34:2, were abundant in CUR treated Candida. PA species (32:1, 34:4, 36:1, 36:4, 36:5, 36:6) were present in low amounts in CUR treated Candida cells (Figure 2B). Amongst lyso-PGLs analyzed, majority of Lyso PE’s and Lyso PC’s showed reduced amounts, except Lyso PC 16:0 and Lyso PC 16:1 species, which were present in significantly higher amounts Lyso PG species amounts remained unaltered on CUR treatment (Supplementary Table S1).
4.3 Effect of CUR on SLs
The change in lipid profile of CUR treated C. albicans cells was not restricted to PGLs, since there were changes observed in SL composition as well. By our analysis, we could detect four major SL groups including CER, IPC, MIPC and M(IP)2C (Figure 3). CUR treated cells showed a depletion of CER (~6 fold) and accumulation of IPCs (~2 fold). However, MIPC and M(IP)2C levels did not show statistically significant changes (Figure 3).
Figure 3. Effect of CUR on SLs composition.
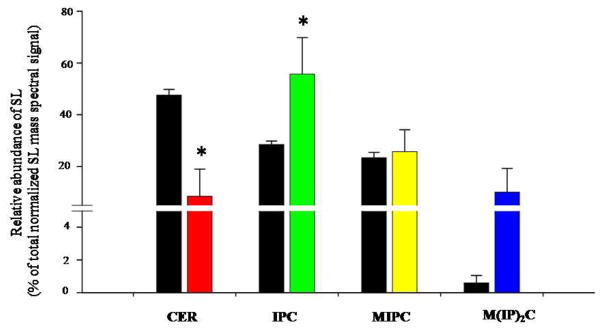
Figure shows the relative abundance of SL groups as mole percentage of the normalized total SL mass spectral signal. The total for each SL class was calculated by adding the mole percentage of the molecular lipid species of that class. The entire data set is shown in the supplementary table (Table S1). Values are means ± SD (n = 3). Statistically significant (p-value <0.05) differences are marked by an asterisk (*). The black bars represent the untreated cells and the colored bars are the CUR treated cells.
Using SL profiling by ESI-MS/MS as discussed in Materials and Methods, we detected 23 molecular SL species of CER (2 species), IPC (9 species), MIPC (8 species) and M(IP)2C (4 species). SL molecular species are represented as total number of C in the sphingoid base and acyl chains: total number of C-C double bonds in the sphingoid base and acyl chains; number of hydroxyl groups present in the sphingoid base and acyl chains. The CER 44:0;3 species, which is the most abundant in Candida, showed a 6 fold reduction in CUR treated cells. IPC 52:0;3 species, which is the major IPC in Candida, showed a 2 fold increase in amount upon CUR treatment. Other SL species, MIPC species 54:0;3 and 58:0;5 was decreased upon CUR treatment. M(IP)2C’s which are the least abundant class of SLs, did not alter upon CUR treatment since there was no statistically significant (p-value > 0.05) difference as shown in Supplementary Table S1.
4.4 Sterol biosynthetic pathway is targeted by CUR
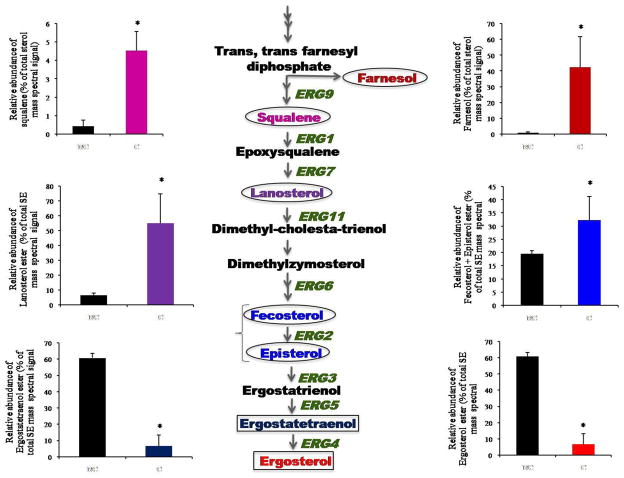
Sterols were identified and quantified as sterol esters (SE) including lanosterol, zymosterol, episterol, fecosterol, ergostatetraenol and ergosterol esters (ES). Of note, episterol and fecosterol esters were identified as one entity as these SEs have same mass and lack unique mass spectral fragments upon fragmentation. CUR treatment showed drastic changes in the ES content. For example, the intermediate metabolites of sterol biosynthetic pathway such as episterol, fecosterol and lanosterol esters showed ~2–8 fold increase in CUR treated cells, while, ergostatetraenol and ergosterol esters showed a 9 fold decrease in CUR treated cells (Figure 4). We could not detect all the intermediates of the sterol biosynthetic pathway using ESI-MS/MS because of the limitation of the method used. Therefore, we performed GCMS analysis of sterol extracts as described in methods. Using GCMS (Supplementary Table S1), in addition to the sterols analyzed in ESI-MS/MS, we could detect raised levels of early precursors of ergosterol biosynthesis, such as farnesol and squalene (Figure 4).
Figure 4. Effect of CUR on sterol composition.
Flow diagram depicts part of sterol biosynthetic pathway highlighting responsive genes and their products in CUR treated Candida cells. The accumulated intermediates are highlighted by circles and the depleted products are highlighted by rectangles. Squalene and farnesol were determined by GCMS analyses while other sterols depicted were determined as sterol esters using ESI-MS/MS, as described in methods. Error bars indicate ± SD. (n = 3). Statistically significant (p-value <0.05) differences are marked by an asterisk (*). The levels of all the sterol intermediates responsive to CUR treatment are plotted as histograms with matching color coding with the intermediates of the pathway. The black bars represent the untreated cells. See supplementary table S1 for details.
4.5 Effect of CUR on di- and tri- acyl glycerols
As discussed in methods both DAGs and TAGs were analyzed on the basis of their FA compositions and were screened for six major FA (C16:1, C16:0, C18:3, C18:2, C18:1 and C18:0) containing lipids. As shown in supplementary Table S1, an increase in 36 C atom containing saturated DAG species (36:0) and a decrease in 36 C atom containing polyunsaturated DAG species (36:2, 36:3, 36:5), was observed in CUR treated cells. TAG molecular species showed severe ripple effects in CUR treated cells (Supplementary Table S1). For example, amongst the major 16:1-FA containing TAG species, an increase in amounts of 46:2 and 46:3 TAG species, and a reduced amount of 50:2, 50:3, 52:3, 52:4, 52:5 TAG species, was observed in CUR treated cells. Similar differences could be seen throughout the TAG species in CUR treated cells (Supplementary Table S1).
4.6 Lipid mutants are hyper susceptible to CUR
Considering the effect of CUR on lipid metabolism, we analyzed some of the available mutants particularly defective in sterol and sphingolipid metabolism. We observed that as compared to WT cells, the mutants defective in ergosterol biosynthesis (ERG2 and ERG11) were highly susceptible to CUR (Figure 5 A and B). The cells lacking UPC2 (the transcription factor which regulates the expression of ERG genes) were also highly susceptible to CUR (Figure 5). In comparison to the wild type (MIC80 =185 μg/ml) cells, there is a drastic drop in the MIC80 value of ΔERG2 (23.12μg/ml), ΔERG11 (11.54 μg/ml) and ΔUPC2 (2.88 μg/ml) mutants (Figure 5B). Additionally, IPT1 mutant (ΔIPT1) defective in mannosyldiinositol phosphorylceramide synthesis also showed increased susceptibility to CUR (MIC80=11.54 μg/ml), however, change in CUR sensitivity in ΔOLE2 (encodes a fatty acid desaturase responsible for oleic acid acid synthesis) mutants which was marginally detected in spot assays could not be seen at MIC level between CUR treated and untreated cells (Figure 5).
Figure 5. Effect of CUR on the growth of Candida cells.
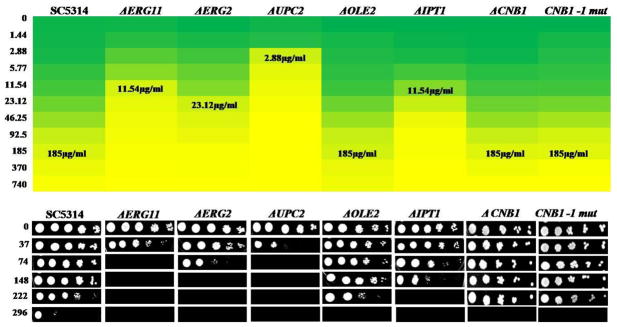
(A) Heat plot of growth inhibition of the Candida cells by broth micro dilution assay in presence of CUR at concentrations ranging from 1.44–740 μg/ml. Growth of the cells was evaluated both visually and by reading the absorbance (A600) in a microtitre reader as described earlier (18). A stock solution of 11 mg/ml was used (DMSO). Growth was not affected by the presence of the solvent (data not shown). (B) The cells were grown overnight on YEPD plates and then resuspended in normal saline to an OD600 of 0.1. Five microliters of fivefold serial dilution of each strain was spotted onto YEPD plates as described earlier (18), either in the absence or presence of varying concentrations of CUR.
4.7 CUR down regulates Δ5, 6 desaturase (ERG 3)
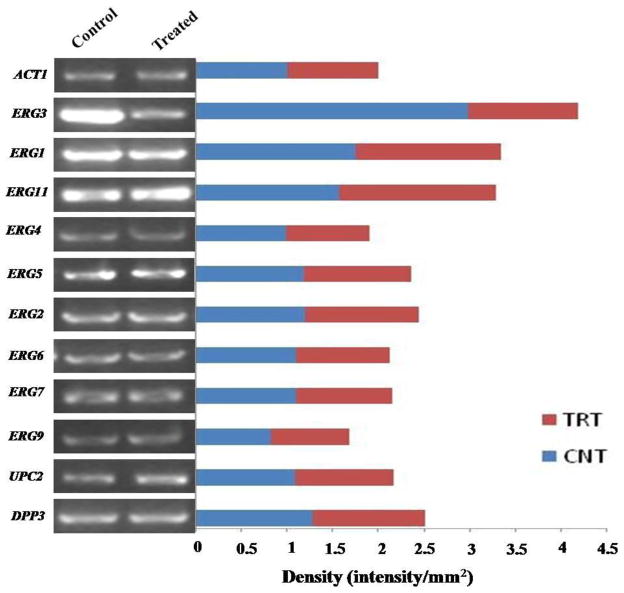
Our lipidome data following CUR treatment showed accumulation of sphingolipid (ceramide, mannosyl-di-inositolphospho-ceramide) and sterol biosynthesis intermediates. To validate this, we carried out the RT-PCR analysis of responsible genes following CUR treatment. From RT-PCR data, we could not detect any major difference in the transcript levels of ERG (ERG9, ERG7, ERG6, ERG2, ERG5, ERG4, ERG11 and ERG1) and SLs synthesis genes (DPP3, ISC1, IPT1), following CUR treatment. None of the genes showed any significant difference in transcript levels except, that the expression levels of Δ5,6 desaturase (ERG3) following CUR treatment was significantly reduced (Figure 6).
Figure 6. Effect of CUR on the expression of ERG genes as determined by RT-PCR.
Transcript levels of genes associated with ergosterol and sphinolipid metabolism in control and treated samples following CUR treatment in C. albicans isolate SC5314, as described in the Methods. Following electrophoresis through 1.2% agarose gel, the amplified PCR products were visualized by staining with ethidium bromide and quantified using the software Image J as represented by horizontal bars. ACT1 mRNA levels were used as a loading control.
5. DISCUSSION
Natural polyphenol curcumin (CUR), a component of turmeric (Curcuma longa), is a mixture of three curcuminoids viz diferuloylmethane (CUR-I), demethoxycurcumin (CUR-II) and bisdemethoxycurcumin (CUR-III), however, CUR-I represents its predominant component of the three curcuminoids. CUR is a known therapeutic agent against variety of cancers and various neurodegenerative disorders (14). We previously demonstrated that CUR and its purified components exert their antifungal activity against various species and azole resistant clinical isolates of Candida (18). Notably, combination of azoles and polyenes with purified CUR resulted in potent synergistic killing of Candida species in vitro (17). We now demonstrate that CUR at its antifungal concentration drastically reduces ergosterol levels (Figure 1). Further, sterol analysis of Candida cells showed that if treated with synergistic but non-lethal concentrations of CUR, there was no change in ergosterol contents. However, in combination with FLC, even non-lethal concentrations of CUR could deplete ergosterol.
To validate that CUR targets ergosterol or other lipid metabolic pathways, we performed total lipidome analysis of CUR treated Candida cells. Lipidome analysis did not show significant changes in mole percentage of PGs and SLs, however, there were significant differences at the level of molecular species of these lipids which suggested modification of membrane lipids in response to CUR treatment. Additionally, reduced level of ceramide and the accumulation of IPCs, PC and PG were significant observed changes, thus SLs and PGLs were partly responsive to CUR treatment. Of note, SLs and ergosterol, particularly are major constituents of membrane raft microdomains and hence functionally relevant (8). Sterol analysis revealed that CUR treatment not only depleted ergosterol but it also in parallel accumulated biosynthetic intermediates like farnesol, squalene and lanosterol (Figure 4). RT-PCR data of ergosterol biosynthetic responsive genes showed that most of the ERG genes did not respond to CUR treatment, however, it exclusively down regulated ERG3 (2.8 fold) which leads to the depletion of ergosterol and accumulation of its biosynthesis intermediates.
We had earlier observed that CUR blocks the hyphae development at non antifungal concentration (18), and thus its effect on morphological transition would appear to be independent of ergosterol pathway. CUR at lower concentration behaves as an antioxidant (25), however, it accumulates ROS at antifungal concentrations and blocks ergosterol pathway and accumulates its precursors. Farnesol has been shown to generate ROS (26). We observed that other accumulated precursors such as lanosterol and squalene also accumulate ROS (data not shown). Thus the antifungal activity of CUR could directly be linked to its ability to generate and accumulate ROS through ergosterol biosynthetic intermediates which results in early apoptosis and cell death (18).
ERG11 which encodes lanosterol 14α-demethylase in ergosterol biosynthetic pathway of Candida is the main target of azoles (3). Interestingly, CUR differs from azoles since it does not appear to target ERG11 which was evident from its transcript levels which remained unchanged after CUR treatment (Figure 6). Thus, both azoles and CUR though target ergosterol pathway, but exert their growth inhibitory effects by distinct mechanisms. Additionally, the effect of CUR on the well known reciprocal regulation of ERG3 and ERG11 is different from that of azoles. In case of azoles, the inhibition of ERG11 leads to the up regulation of ERG3 (27), however, CUR down regulates ERG3 without affecting ERG11 expression. These differences are even more apparent if one considers that CUR, unlike azoles does not target calcineurin stress pathway (17). Calcineurin is a highly conserved calcium dependent serine/threonine-specific protein phosphatase that mediates various stress responses inside the cell (28) and enhances sensitivity to azoles and other drugs by targeting ergosterol biosynthesis in C. albicans. Our data shows that CUR effect was similar to WT cells in mutants defective in calcineurin signaling (ΔCNB1) and in the protein phosphatase Calcineurin (CNB1-1mutation) (Figure 5).
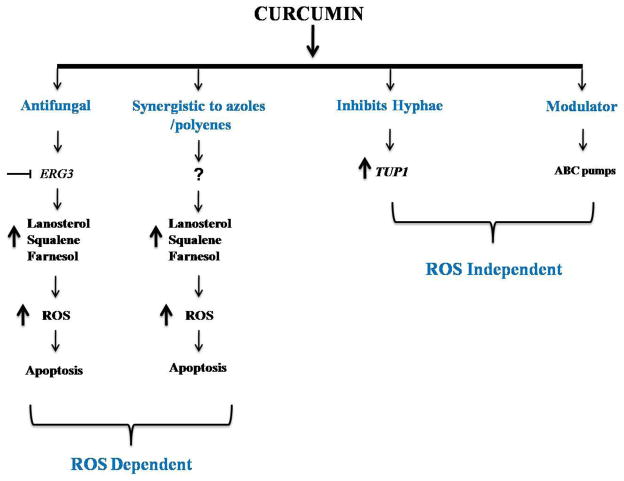
Taken together, our study provides first evidence that CUR while displaying its antifungal and synergistic activity with azoles and polyenes targets ergosterol pathway by inhibiting ERG3 resulting in the depletion of ergosterol levels and accumulation of its precursors. The accumulated precursors generate ROS leading to cell death (Figure 7). On one hand, CUR exerts its effect via ROS but also have parallel effects such as inhibition of hyphal development of Candida cells which are independent of ROS pathway (18). Figure 7 summarizes the overall effects of CUR on the human pathogen C.albicans. Considering the effect of CUR on PGLs, SLs and ergosterol metabolism, it would imply that CUR affects membrane lipid homeostasis in exerting its antifungal activity.
Figure 7.
Overall effects of CUR on the human pathogen C.albicans
Supplementary Material
Acknowledgments
The work presented in this paper has been supported in part by grants to R.P. from Department of Biotechnology (BT/PR9100/Med/29/03/2007, BT/PR9563/BRB/10/567/2007, BT/PR11158/BRB/10/640/2008). Department of Science and Technology (SR/SO/BB-34/2008) and Indo-Swiss project INT/SWISS/P-31/2009. We acknowledge Advanced Instrumentation Research Facility (AIRF), JNU for providing instrumental support. The lipid analyses described in this work was performed at the Kansas Lipidomics Research Centre Analytical Laboratory. Kansas Lipidomics Research Centre was supported by National Science Foundation (EPS 0236913, MCB 0455318, DBI 0521587), Kansas Technology Enterprise Corporation, K-IDeA Networks of biomedical Research Excellence (INBRE) of National Institute of Health (P20RR16475), and Kansas State University. M.S. acknowledges Department of Biotechnology (DBT), India, for the award of senior research fellowship.
References
- 1.Odds FC. Candida and candidosis: A review and Bibliography. Balliere Tindall; London, United Kingdom: 1988. [Google Scholar]
- 2.White TC, Marr KA, Bowden RA. Clinical, cellular, and molecular factors that contribute to antifungal drug resistance. Clin Microbiol Rev. 1998;11:382–402. doi: 10.1128/cmr.11.2.382. [DOI] [PMC free article] [PubMed] [Google Scholar]
- 3.Hitchcock CA, Dickinson K, Brown SB, Evans EG, Adams DJ. Interaction of azole antifungal antibiotics with cytochrome P-450-dependent 14 alpha-sterol demethylase purified from Candida albicans. Biochem J. 1990;266:475–480. doi: 10.1042/bj2660475. [DOI] [PMC free article] [PubMed] [Google Scholar]
- 4.Kato M, Wickner W. Ergosterol is required for the Sec18/ATP-dependent priming step of homotypic vacuole fusion. EMBO J. 2001;20:4035–4040. doi: 10.1093/emboj/20.15.4035. [DOI] [PMC free article] [PubMed] [Google Scholar]
- 5.Schneiter R, Brugger B, Sandhoff R, Zellnig G, Leber A, Lampl M, Athenstaedt K, Hrastnik C, Eder S, Daum G, Paltauf F, Wieland FT, Kohlwein SD. Electrospray ionization tandem mass spectrometry (ESI-MS/MS) analysis of the lipid molecular species composition of yeast subcellular membranes reveals acyl chain-based sorting/remodeling of distinct molecular species en route to the plasma membrane. J Cell Biol. 1999;146:741–754. doi: 10.1083/jcb.146.4.741. [DOI] [PMC free article] [PubMed] [Google Scholar]
- 6.Umebayashi K, Nakano A. Ergosterol is required for targeting of tryptophan permease to the yeast plasma membrane. J Cell Biol. 2003;161:1117–1131. doi: 10.1083/jcb.200303088. [DOI] [PMC free article] [PubMed] [Google Scholar]
- 7.Munro S. Lipid rafts: elusive or illusive ? Cell. 2003;115:377–388. doi: 10.1016/s0092-8674(03)00882-1. [DOI] [PubMed] [Google Scholar]
- 8.Pasrija R, Prasad T, Prasad R. Membrane raft lipid constituents affect drug susceptibilities of Candida albicans. Biochem Soc Trans. 2005;33:1219–1223. doi: 10.1042/BST20051219. [DOI] [PubMed] [Google Scholar]
- 9.Rajendran L, Simons K. Lipids and membrane dynamics. J of Cell Science. 2005;118:1099–1102. doi: 10.1242/jcs.01681. [DOI] [PubMed] [Google Scholar]
- 10.Guo N, Wu X, Yu L, Liu J, Meng R, Jin J, Lu H, Wang X, Yan S, Deng X. In vitro and in vivo interactions between fluconazole and allicin against clinical isolates of fluconazole-resistant Candida albicans determined by alternative methods. FEMS Immunol Med Microbiol. 2010;58:193–201. doi: 10.1111/j.1574-695X.2009.00620.x. [DOI] [PubMed] [Google Scholar]
- 11.Quan H, Cao YY, Xu Z, Zhao JX, Gao PH, Qin XF, Jiang YY. Potent in vitro synergism of fluconazole and berberine chloride against clinical isolates of Candida albicans resistant to fluconazole. Antimicrob Agents Chemother. 2006;50:1096–1099. doi: 10.1128/AAC.50.3.1096-1099.2006. [DOI] [PMC free article] [PubMed] [Google Scholar]
- 12.Rukayadi Y, Lee K, Lee MS, Yong D, Hwang JK. Synergistic anticandidal activity of xanthorrhizol in combination with ketoconazole or amphotericin B. FEMS Yeast Res. 2009;9:1302–1311. doi: 10.1111/j.1567-1364.2009.00548.x. [DOI] [PubMed] [Google Scholar]
- 13.Martins CV, da Silva DL, Neres AT, Magalhaes TF, Watanabe GA, Modolo LV, Sabino AA, de FA, de Resende MA. Curcumin as a promising antifungal of clinical interest. J Antimicrob Chemother. 2009;63:337–339. doi: 10.1093/jac/dkn488. [DOI] [PubMed] [Google Scholar]
- 14.Prasad JS, Aggarwal BB. Curcumin and cancer cells: how many ways can curry kill tumor cells selectively? AAPS J. 2009;11:495–510. doi: 10.1208/s12248-009-9128-x. [DOI] [PMC free article] [PubMed] [Google Scholar]
- 15.Bava SV, Puliappadamba VT, Deepti A, Nair A, Karunagaran D, Anto RJ. Sensitization of taxol-induced apoptosis by curcumin involves down-regulation of nuclear factor-kappaB and the serine/threonine kinase Akt and is independent of tubulin polymerization. J Biol Chem. 2005;280:6301–6308. doi: 10.1074/jbc.M410647200. [DOI] [PubMed] [Google Scholar]
- 16.Shishodia S, Singh T, Chaturvedi MM. Modulation of transcription factors by curcumin. Adv Exp Med Biol. 2007;595:127–148. doi: 10.1007/978-0-387-46401-5_4. [DOI] [PubMed] [Google Scholar]
- 17.Sharma M, Manoharlal R, Negi AS, Prasad R. Synergistic anticandidal activity of pure polyphenol curcumin I in combination with azoles and polyenes generates reactive oxygen species leading to apoptosis. FEMS Yeast Res. 2010 doi: 10.1111/j.1567-1364.2010.00637.x. [Epub ahead of print] [DOI] [PubMed] [Google Scholar]
- 18.Sharma M, Manoharlal R, Puri N, Prasad R. Antifungal curcumin induces reactive oxygen species and triggers an early apoptosis but prevents hyphae development by targeting the global repressor TUP1 in Candida albicans. Biosci Rep. 2009 doi: 10.1042/BSR20090151. [Epub ahead of print] [DOI] [PubMed] [Google Scholar]
- 19.Banerjee D, Lelandais G, Shukla S, Mukhopadhyay G, Jacq C, Devaux F, Prasad R. Responses of pathogenic and nonpathogenic yeast species to steroids reveal the functioning and evolution of multidrug resistance transcriptional networks. Eukaryot Cell. 2008;7:68–77. doi: 10.1128/EC.00256-07. [DOI] [PMC free article] [PubMed] [Google Scholar]
- 20.Bligh EG, Dyer WJ. A rapid method of total lipid extraction and purification. Can J Biochem Physiol. 1959;37:911–917. doi: 10.1139/o59-099. [DOI] [PubMed] [Google Scholar]
- 21.Devaiah SP, Roth MR, Baughman E, Li M, Tamura P, Jeannotte R, Welti R, Wang X. Quantitative profiling of polar glycerolipid species from organs of wild-type Arabidopsis and a phospholipase Dalpha1 knockout mutant. Phytochemistry. 2006;67:1907–1924. doi: 10.1016/j.phytochem.2006.06.005. [DOI] [PubMed] [Google Scholar]
- 22.Singh A, Prasad T, Kapoor K, Mandal A, Roth M, Welti R, Prasad R. Phospholipidome of Candida: Each species of Candida has distinctive phospholipid molecular species. OMICS: A Journal of Integrative Biology. 2010 doi: 10.1089/omi.2010.0041. (In Press) [DOI] [PubMed] [Google Scholar]
- 23.Welti R, Li W, Li M, Sang Y, Biesiada H, Zhou HE, Rajashekar CB, Williams TD, Wang X. Profiling membrane lipids in plant stress responses. Role of phospholipase D alpha in freezing-induced lipid changes in Arabidopsis. J Biol Chem. 2002;277:31994–32002. doi: 10.1074/jbc.M205375200. [DOI] [PubMed] [Google Scholar]
- 24.Michael AQ, Kelly SL. The Extraction and Analysis of Sterols from. Yeast. 2008;53:123–131. doi: 10.1385/0-89603-319-8:123. [DOI] [PubMed] [Google Scholar]
- 25.Motterlini R, Foresti R, Bassi R, Green CJ. Curcumin, an antioxidant and anti-inflammatory agent, induces heme oxygenase-1 and protects endothelial cells against oxidative stress. Free Radical Biology & Medicine. 2000;28:1303–1312. doi: 10.1016/s0891-5849(00)00294-x. [DOI] [PubMed] [Google Scholar]
- 26.Shirtliff ME, Krom BP, Meijering RA, Peters BM, Zhu J, Scheper MA, Harris ML, Jabra-Rizk MA. Farnesol-induced apoptosis in Candida albicans. Antimicrob Agents Chemother. 2009;53:2392–2401. doi: 10.1128/AAC.01551-08. [DOI] [PMC free article] [PubMed] [Google Scholar]
- 27.Henry KW, Nickels JT, Edlind TD. Upregulation of ERG genes in Candida Species by Azoles and Other Sterol Biosynthesis Inhibitors. Antimicrob Agents Chemother. 2000;44:2693–2700. doi: 10.1128/aac.44.10.2693-2700.2000. [DOI] [PMC free article] [PubMed] [Google Scholar]
- 28.Bader T, Bodendorfer B, Schroppel K, Morschhauser J. Calcineurin is essential for virulence in Candida albicans. Infection and Immunity. 2003;71:5344–5354. doi: 10.1128/IAI.71.9.5344-5354.2003. [DOI] [PMC free article] [PubMed] [Google Scholar]
Associated Data
This section collects any data citations, data availability statements, or supplementary materials included in this article.


