Abstract
Non-alcoholic steatohepatitis (NASH) is a progressive fibrotic disease, the pathogenesis of which has not been fully elucidated. One of the most common models used in NASH research is a nutritional model where NASH is induced by feeding a diet deficient in both methionine and choline. However, the dietary methionine-/choline-deficient model in mice can cause severe weight loss and liver atrophy, which are not characteristics of NASH seen in human patients. Exclusive, long-term feeding with a high-fat diet (HFD) produced fatty liver and obesity in mice, but the HFD for several months did not affect fibrosis. We aimed to establish a mouse model of NASH with fibrosis by optimizing the methionine content in the HFD. Male mice were fed a choline-deficient, L-amino acid-defined, high-fat diet (CDAHFD) consisting of 60 kcal% fat and 0.1% methionine by weight. After 1–14 weeks of being fed CDAHFD, the mice were killed. C57BL/6J mice maintained or gained weight when fed CDAHFD, while A/J mice showed a steady decline in body weight (of up to 20% of initial weight). In both strains of mice, plasma levels of alanine aminotransferase increased from week 1, when hepatic steatosis was also observed. By week 6, C57BL/6J mice had developed enlarged fatty liver with fibrosis as assessed by Masson's trichrome staining and by hydroxyproline assay. Therefore, this improved CDAHFD model may be a mouse model of rapidly progressive liver fibrosis and be potentially useful for better understanding human NASH disease and in the development of efficient therapies for this condition.
Keywords: fibrosis, high-fat diet, methionine-restricted diet, mouse model, non-alcoholic steatohepatitis
Non-alcoholic fatty liver disease (NAFLD) affects one in five adult males in Japan (Bellentani & Marino 2009). Some of them progress slowly to non-alcoholic steatohepatitis (NASH) followed by progression to fibrosis and cirrhosis or hepatocellular carcinoma over many years. Hepatocellular steatosis represents an excess accumulation of fat (triglycerides) in hepatic parenchymal cells; it is a multifactorial process that ultimately leads to impairment of lipid processing and clearance in the liver (Anderson & Borlak 2008). This steatosis is the first step in the pathogenesis of NAFLD/NASH and is considered to sensitize the liver to factors involved in the second step, which may be oxidative stress or abnormal cytokine production (Day & James 1998; Day 2002). However, the exact role of steatosis in the development of fibrosis in NASH is still debated.
The literature contains numerous mouse models that develop histological evidence of hepatocellular steatosis or, more variably, steatohepatitis; however, few replicate the entire human phenotype. Genetic leptin-deficient (ob/ob) or leptin-resistant (db/db) mouse and dietary methionine-/choline-deficient (MCD) models are used in the majority of published research (Anstee & Goldin 2006). The MCD model of feeding a diet deficient in both methionine and choline is one of the most common tools used in NASH research. Methionine and choline are required for hepatic secretion of triglycerides in the form of very low-density lipoproteins (VLDL); thus, in these models, lipid export from the liver to peripheral tissues may be impaired due to defective incorporation of triglycerides into apolipoprotein B (ApoB) or reduced ApoB synthesis or excretion. The phenotype resulting from feeding with the MCD diet (MCDD) is characterized by macrovesicular steatosis, hepatocellular death, inflammation, oxidative stress and fibrosis (Caballero et al. 2010). One drawback to the use of MCDD to induce development of NASH is that the mice show dramatic systemic weight loss (Kashireddy & Rao 2004; Rizki et al. 2006). In particular, the A/J mouse strain fed MCDD is reported to demonstrate significantly greater serum alanine aminotransferase (ALT) values and weight loss than other strains, followed by strain C57BL/6 (Rangnekar et al. 2006). Severe loss of body weight in mice occurs although the loss of skeletal muscle and fat mass and is associated with increased risk of death. These factors are major problems for long-term fibrogenesis experiments.
The choline-deficient, l-amino acid-defined (CDAA) dietary model overcomes these problems to study the development of NASH-induced fibrosis, and this model has been demonstrated to mimic human NASH in both mice and rats by sequentially producing steatohepatitis, liver fibrosis and liver cancer without any loss of body weight (Nakae et al. 1990, 1992; Sakaida et al. 1994; Denda et al. 2007). With rats, optimized feeding with the CDAA diet results in rapid progression of fibrosis followed by a rise in ALT, which is a parameter indicating liver injury. In mice, on the other hand, feeding with the CDAA diet results in little or negligible increase in ALT (Kamada et al. 2007), and long-term feeding of 20 weeks or more is required before liver fibrosis is observed (Denda et al. 2002, 2007; Kodama et al. 2009). Establishment of optimal conditions for the rapid progression of fibrosis in mice would be useful when using genetically engineered mice to understand the mechanisms of disease and to assess the in vivo effects of drugs. In this study, we investigated several dietary treatments for two mouse strains in an effort to establish an improved dietary model for this disease.
Materials and methods
Animals
Specific pathogen-free C57BL/6J or A/J male mice of 5 weeks of age were purchased from Japan SLC Inc. (Shizuoka, Japan) and were acclimated for 1 week before the start of treatments. Animals were maintained at 23 ± 3 °C with a 12:12 h light/dark cycle and fed with a commercial standard diet (#CE-2; CLEA Japan Inc., Shizuoka, Japan) and tap water ad libitum. The standard diet (SD) provided 3.4 kcal per gram and contained 46 g/kg of crude fat.
Ethical Approval
All experimental animal care and handling were performed in accordance with the recommendations in the Guidelines for the Care and Use of Laboratory Animals at Chugai Pharmaceutical Co. Ltd. The animal experimental protocol was approved by the Institutional Animal Care and Use Committee at Chugai Pharmaceutical Co. Ltd (Approval No: 09-293).
Test diets
MCD diet (#518810) and CDAA diet (#518753) were purchased from Dyets (Bethlehem, PA, USA). These diets each contained 50 g/kg of corn oil and 100 g/kg of hydrogenated vegetable oil (Primex) as lipid sources. A low-fat diet with 10 kcal% fat (LFD; #D12450B), a high-fat diet with 60 kcal% fat (HFD; #D12492), an MCD HFD (MCDHFD; #A06071301B) and a CDAA, HFD with 0.1% methionine (CDAHFD; #A06071302) were purchased from Research Diets (New Brunswick, NJ, USA). These HFDs provided 5.2 kcal per gram and contained 320 g/kg of lard-based fat. We prepared methionine-supplemented diets in our laboratory by adding various levels of l-methionine (Sigma-Aldrich, Tokyo, Japan) to MCDD or MCDHFD.
Experimental procedures
All mice were maintained under the above-mentioned conditions for 1–14 weeks. At the end of each time point, mice were weighed and then killed by exsanguination under isoflurane anaesthesia. Blood samples were collected from the heart cavities or the postcaval vein and maintained at −80 °C until assayed. The liver was quickly removed and weighed. Part of the liver tissue was snap-frozen in liquid nitrogen or on dry ice for hydroxyproline (OH-Pro) and molecular analyses. A small piece of liver was immediately fixed in 20% neutral-buffered formalin for further histology analysis. The epididymal fat pad was removed and weighed and used as an indicator for visceral fat mass.
Biochemical analyses
The plasma levels of total protein, ALT, aspartate aminotransferase (AST), total cholesterol and triglycerides were measured with a biochemical analyser (Toshiba TBA-120FR; Toshiba Medical Systems Corporation, Tochigi, Japan).
Total liver lipids were extracted by the Folch method (Folch et al. 1957). Hepatic triglyceride was quantified using a Triglyceride test kit (Wako Pure Chemical Industries, Osaka, Japan). The levels of tumour necrosis factor alpha (TNF-α) and monocyte chemoattractant protein-1 (MCP-1) in plasma were measured with commercial mouse TNF-α and MCP-1 enzyme-linked immunosorbent assay (ELISA) kits (R&D Systems, Minneapolis, MN, USA).
To assess collagen content in the liver, we measured OH-Pro content by a modified colorimetric method (Kivirikko et al. 1967; Inayama et al. 1978; Nagatani et al. 1986; McAnulty 2005). Briefly, the chopped liver specimens were hydrolysed overnight in 6 N HCl at 110 °C, neutralized with NaOH and filtered. Aliquots of hydroxylate were diluted in borate buffer and oxidized with chloramine-T. The reaction was stopped with sodium thiosulfate, and the hydroxylate was then boiled and mixed with toluene. After centrifugation, an aliquot of the organic phase was added to Ehrlich's reagent. The endpoint reaction was measured as the difference in absorbance between 550 and 600 nm. The amount of OH-Pro was determined by the comparison with a standard curve prepared from known concentrations of reagent OH-Pro (Sigma-Aldrich). The hepatic OH-Pro content is expressed in milligrams per gram of tissue (dry weight).
mRNA analyses of collagen genes
Total RNA was extracted from liver tissues using an RNeasy Mini Kit (Qiagen, Tokyo, Japan), and cDNA was synthesized using a Transcriptor First Strand cDNA Synthesis Kit (Roche Applied Science, Tokyo, Japan). Gene expression was measured using the LightCycler 480 System and LightCycler 480 Probes Master (Roche Applied Science). The amplification used 50 cycles of 95 °C for 5 min, 95 °C for 10 s and 60 °C for 30 s. Rodent glyceraldehyde 3-phosphate dehydrogenase (GAPDH; Life Technologies Japan, Tokyo, Japan) expression was used as the endogenous reference for each sample. Primers and TaqMan probes for genes were designed using the Universal ProbeLibrary Assay Design Center (Roche Applied Science). The probes used were from the Roche Universal Probe Library (Roche Applied Science). Relative mRNA expression values were calculated using the relative standard curve method normalized to GAPDH.
Western blot analysis
Liver homogenates were prepared by homogenizing 50-mg liver in 0.6 ml CelLytic M Cell Lysis Reagent (Sigma-Aldrich). Homogenated proteins (10 μg/lane) were separated by electrophoresis on 12.5% polyacrylamide gels (Wako Pure Chemical Industries). Thereafter, proteins were transferred to a PVDF-membrane (Millipore, Billerica, MA, USA). To visualize specific proteins, membranes were incubated in mouse anti-alpha-smooth muscle actin (α-SMA; Sigma-Aldrich) at 1:200 or rabbit anti-GAPDH (Santa Cruz Biotechnology, Santa Cruz, CA, USA) at 1:5000 followed by incubation in Alexa Fluor680-conjugated anti-mouse secondary antibody (Invitrogen, Carlsbad, CA, USA) or IRDye800-conjugated anti-rabbit secondary antibody (Rockland Immunochemicals, Philadelphia, PA, USA) at 1:5000. Proteins were detected using the LI-COR Odyssey Infrared Imaging System (LI-COR Biosciences, Lincoln, NE, USA).
Hepatic histopathological evaluation
For light microscopic analysis of liver histology, the paraffin-embedded liver tissues were sliced into thin sections, and standard haematoxylin and eosin (H&E) staining was performed. Hepatic fibrosis was assessed by Masson's trichrome staining. Specimens were scored for the severity of hepatocellular steatosis, ballooning, inflammation and fibrosis according to the following criteria. For hepatocellular steatosis, specimens were classified into grades 0–3 (grade 0: no fat; grade 1: steatosis occupying <33% of the hepatic parenchyma; grade 2: 34–66% of the hepatic parenchyma; and grade 3: more than 66% of the hepatic parenchyma). For inflammatory cell infiltration, specimens were classified into grades 0–3 (grade 0: none; grade 1: 1–2 foci per 200 × field; grade 2: 3–4 foci per 200 × field; and grade 3: more than 4 foci per 200 × field). For hepatocellular ballooning, specimens were classified into grades 0–2 (grade 0: none; grade 1: few balloon cells; and grade 2: many cells/prominent ballooning). The staging of hepatic fibrosis was classified into stages 0–4 (stage 0: none; stage 1: mild, perisinusoidal or periportal; stage 2: moderate, perisinusoidal and periportal; stage 3: bridging fibrosis; and stage 4: cirrhosis; Kleiner et al. 2005).
Statistical analyses
Data are presented as mean ± standard error of the mean (SEM). Statistical analysis was performed using analysis of variance (anova) and Student's t-test. When P values were <0.05 or 0.01, differences were considered significant.
Results
Model of NAFLD without liver fibrosis in C57BL/6J mice fed HFD
C57BL/6J mice were fed with SD, HFD or LFD for 24 weeks (Figure 1a). We observed a substantial increase in the body weight of mice fed the HFD relative to the LFD and SD groups. By 18 weeks of diet treatment, plasma ALT level was significantly increased in mice fed HFD (Figure 1b). Microscopically, the livers showed that feeding of the HFD for 24 weeks promoted hepatocellular steatosis but without evidence of fibrosis (Figure 2).
Figure 1.
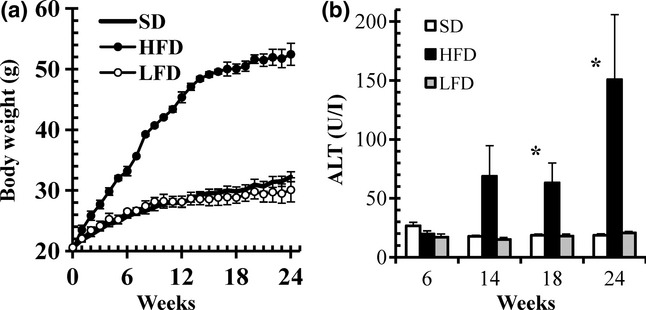
Body weight and alanine aminotransferase (ALT) levels in C57BL/6J mice fed standard diet (SD), low-fat diet (LFD) or high-fat diet (HFD) for 24 weeks. (a) Body weight gain. (b) ALT levels. Data are means ± SEM (n = 3). *P < 0.05 vs. SD (control).
Figure 2.
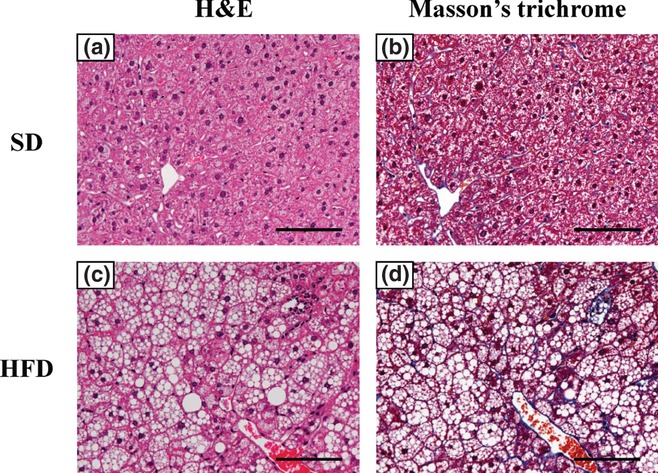
Representative liver histopathology in C57BL/6J mice fed standard diet (SD) or high-fat diet (HFD) for 24 weeks. Haematoxylin and eosin (H&E) staining and Masson's trichrome staining of liver in SD-fed mice (a, H&E staining; b, Masson's trichrome staining, 200× magnification). The HFD-fed mice showed steatosis without fibrosis (c, H&E staining; d, Masson's trichrome staining, 200× magnification). Scale bars = 100 μm.
Optimal methionine intake for developing enlarged fatty liver in mice fed MCDHFD
Consistent with the results of previous studies on MCDD (Rizki et al. 2006; Rinella et al. 2008), C57BL/6J mice fed MCDHFD for 3 weeks developed a significantly high level of plasma ALT (486 ± 6.6 U/l) with accompanying significant loss of epididymal fat pad mass and significant loss of body weight (Table 1). However, the animals did not show a steady decrease in activity levels during the course of the 3 weeks, and their calorie intake remained at approximately 10 kcal per day.
Table 1.
Effects of methionine in drinking water on physiological characteristics and plasma markers in C57BL/6J mice fed MCDHFD (3-week study)
| SD | MCDHFD | ||||
|---|---|---|---|---|---|
| Diets Methionine in drinking water (%) | 0 | 0.01 | 0.03 | 0.1 | |
| Final body weight (g) | 24.0 ± 0.8 | 14.0 ± 0.5** | 16.0 ± 0.3** | 19.7 ± 0.1** | 23.0 ± 1.3 |
| Liver/body weight (%) | 5.49 ± 0.13 | 5.51 ± 0.28 | 6.03 ± 0.27 | 6.39 ± 0.06* | 5.66 ± 0.29 |
| Epididymal fat pad/body weight (%) | 1.33 ± 0.11 | 0.05 ± 0.02** | 0.43 ± 0.07** | 1.00 ± 0.10 | 1.27 ± 0.16 |
| ALT (U/l) | 39.5 ± 9.8 | 486 ± 6.6** | 452 ± 34** | 449 ± 38** | 222 ± 99** |
| Food intake (g/day) (kcal/day) | 3.2 ± 0.3 (10.9 ± 0.9) | 2.2 ± 0.4 (11.5 ± 1.9) | 2.0 ± 0.4 (10.3 ± 2.0) | 2.1 ± 0.1 (10.7 ± 0.5) | 2.5 ± 0.3 (12.7 ± 1.4) |
| Methionine intake (mg/day) | – | 0 | 0.8 ± 0.1 | 2.4 ± 0.1 | 7.3 ± 1.6 |
ALT, alanine aminotransferase; SD, standard diet; MCDHFD, methionine-/choline-deficient high-fat diet.
Values are expressed as means ± SEM (SD: n = 6; MCDHFD: n = 3).
P < 0.05,
P < 0.01, compared with the SD (control).
Methionine was added to the drinking water to determine the optimal methionine concentration. The animals' intake of methionine increased in accordance with the higher concentrations of methionine added to the drinking water, and the loss of body weight declined dose-dependently.
In mice fed MCDHFD along with 0.1% methionine added to the drinking water for 3 weeks, epididymal fat pad mass accumulated and the animals' body weight increased in a manner similar to that observed in animals fed SD.
In mice fed MCDHFD along with 0.03% methionine in the drinking water for 3 weeks, the epididymal fat pad mass level was maintained although body weight decreased slightly. This group showed significantly high levels of plasma ALT (449 ± 38 U/l) and significant increase in the relative liver weight, which was not observed in other groups. Over the 3-week feeding period, an average food intake of 2.1 ± 0.1 g/day and average methionine intake of 2.4 ± 0.1 mg/day were recorded for this group.
Difference in enlarged fatty liver between mice fed MCDD and MCDHFD
Based on the results obtained from the experiment examining different doses of methionine in the drinking water, C57BL/6J mice were fed with MCDD or MCDHFD each containing either 0.1% or 0.03% added methionine for 3 weeks. The groups fed either MCDD or MCDHFD containing 0.03% added methionine showed significantly decreased levels of epididymal fat pad mass and body weight compared to mice fed SD. There was a decrease of >20% of the initial body weight (Table 2). In addition to this loss of body weight, a significant decrease in the relative liver weight was observed in the group fed MCDD with 0.03% added methionine. The relative liver weight and the epididymal fat pad mass increased in accordance with the percentage of methionine contained in MCDD and MCDHFD. Plasma ALT and AST were measured as indicators of hepatic function. As the levels of methionine contained in the diets increased, these biomarkers for hepatic dysfunction and the epididymal weight losses of animals decreased.
Table 2.
Effects of adding methionine to MCDD or MCDHFD on physiological characteristics and plasma markers in C57BL/6J mice (3-week study)
| MCDD | MCDHFD | ||||
|---|---|---|---|---|---|
| Diets Methionine (%) | SD | 0.03 | 0.1 | 0.03 | 0.1 |
| Body weight (g) | |||||
| Initial | 20.9 ± 0.5 | 20.9 ± 0.6 | 21.0 ± 0.5 | 20.8 ± 0.4 | 21.2 ± 0.8 |
| Final | 25.1 ± 0.8## | 16.5 ± 0.6**,## | 22.3 ± 0.7* | 15.1 ± 0.4**,## | 20.1 ± 0.7** |
| Liver/body weight (%) | 5.48 ± 0.11 | 4.21 ± 0.15** | 5.53 ± 0.41 | 5.62 ± 0.14 | 6.66 ± 0.05** |
| Epididymal fat pad/body weight (%) | 1.42 ± 0.16 | 0.98 ± 0.13* | 1.46 ± 0.09 | 0.35 ± 0.04** | 1.25 ± 0.07 |
| ALT (U/l) | 29 ± 5.5 | 333 ± 51** | 124 ± 5.8 | 556 ± 86** | 360 ± 23** |
| AST (U/l) | 65 ± 7.7 | 289 ± 8.4** | 171 ± 16 | 489 ± 82** | 309 ± 9.3** |
| Triglyceride (mg/dl) | 83 ± 13 | 21 ± 3.1** | 29 ± 3.2* | 45 ± 21 | 56 ± 4.3 |
| Total cholesterol (mg/dl) | 82 ± 5.3 | 31 ± 7.6** | 54 ± 3.2** | 46 ± 9.0** | 48 ± 3.7** |
ALT, alanine aminotransferase; AST, aspartate aminotransferase; SD, standard diet; MCDD, methionine-/choline-deficient diet; MCDHFD, methionine-/choline-deficient high-fat diet.
Values are expressed as means ± SEM for 3 mice in each group.
P < 0.05,
P < 0.01, compared with the SD (control).
P < 0.01, compared with the initial body weight.
With mice fed MCDD or MCDHFD with 0.1% added methionine, the final body weight was within ±10% of initial body weight; also, the relative epididymal fat pad mass was observed to be of a similar level to that of mice fed SD. Mice fed MCDHFD with 0.1% added methionine showed high levels of plasma ALT and AST and developed an obviously enlarged fatty liver, which was not seen in mice fed MCDD with 0.1% added methionine.
In this study, C57BL/6J mice fed the CDAA diet for 6 weeks showed weight gain similar to or greater than that of mice kept on SD (29.1 ± 1.0 g vs. 26.7 ± 0.7 g body weight, P = 0.13; Figure 3a). There were no significant changes in plasma ALT and AST levels (Figure 3b). Histological evaluation of liver specimens of mice fed the CDAA diet for 6 weeks showed development of grade 2 hepatocellular steatosis and grade 1 focal lobular inflammation without hepatocyte death or fibrosis (Figure 3c–f).
Figure 3.
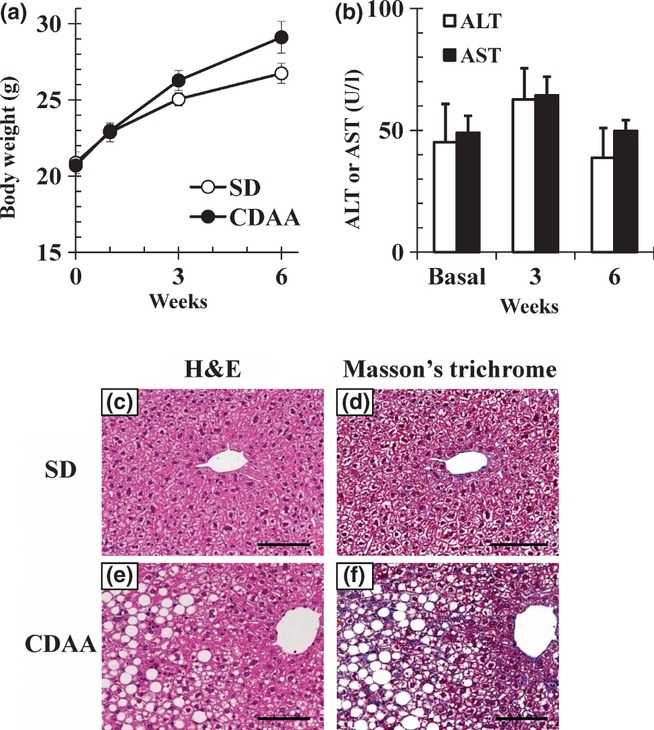
Body weight, alanine aminotransferase (ALT) and aspartate aminotransferase (AST) levels and representative liver histopathology in C57BL/6J mice fed standard diet (SD) or choline-deficient, L-amino acid-defined (CDAA) diet for 6 weeks. (a) Changes in body weight of mice fed SD or the CDAA diet and (b) ALT and AST levels in mice fed the CDAA diet. Data are means ± SEM (n = 3). (c–f) Liver sections were stained with haematoxylin and eosin (H&E) and Masson's trichrome (200× magnification). Scale bars = 100 μm.
Difference between strains C57BL/6J and A/J in liver fibrotic response
C57BL/6J and A/J mice were fed with a CDAHFD consisting of 60 kcal% fat and 0.1% methionine for 6 weeks. The body weight losses were smaller in C57BL/6J mice than in A/J mice, with only a 3–5% decrease from baseline (Figure 4a). Elevated levels of plasma ALT were observed in both strains 1 week after the initiation of feeding (Figure 4b). Histopathological results (Figure 4c–j) indicated grade 3 hepatocellular steatosis in both strains after 3-week feeding. The C57BL/6J mice fed CDAHFD showed grade 1 or 2 lobular inflammation. The A/J mice fed CDAHFD exhibited a lesser degree of lobular inflammation (H&E staining, Figure 4c–h). When feeding with CDAHFD was carried out for 6 weeks, fibrosis developed in C57BL/6J mice, but not in A/J (Masson's trichrome staining, Figure 4i, j).
Figure 4.
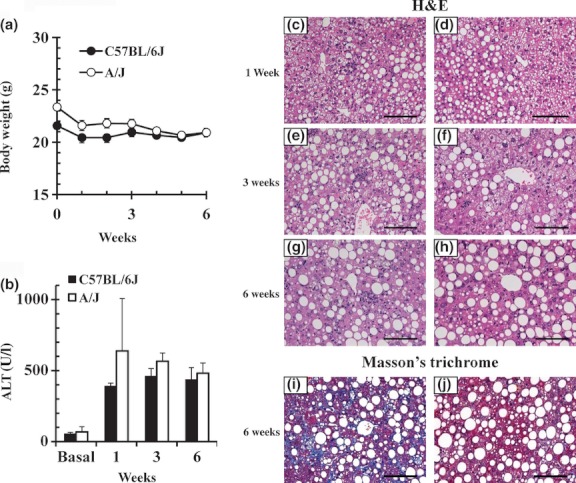
Body weight, alanine aminotransferase (ALT) levels and representative liver histopathology in two inbred mouse strains fed choline-deficient, L-amino acid-defined, high-fat diet (CDAHFD) for 1, 3 or 6 weeks. (a) Changes in body weight. (b) ALT levels. Data are means ± SEM (n = 3). Histological findings in the livers of C57BL/6J (left column) and A/J (right column) mice. Haematoxylin and eosin (H&E) staining (c–h) and Masson's trichrome staining (i, j) of liver sections are shown (200 × magnification). Scale bars = 100 μm.
Expression of fibrosis biomarkers and histopathological alterations in C57BL/6J mice fed CDAHFD
In C57BL/6J mice fed CDAHFD, significant elevations in mRNA expressions of collagen 1A1, 3A1 and 4A1 (Figure 5a) and clear expression of α-SMA protein (Figure 5b) were observed after both 3 and 6-weeks feeding. In C57BL/6J mice fed CDAHFD for 14 weeks, we observed that the body weight decreased temporarily through the first 3 weeks and then gradually recovered and increased afterwards (Figure 6a). To monitor the progression of fatty liver, the accumulation of hepatic triglycerides was measured. In 3 weeks of feeding with CDAHFD, a remarkable increase in triglycerides in the liver was observed that persisted for up to 10 weeks before gradually decreasing (Figure 6b). As also indicated in Figure 4, C57BL/6J mice fed CDAHFD for 6 weeks showed a remarkable increase in the markers for liver injury, ALT and AST. Levels of both markers decreased gradually thereafter, but even at 14 weeks, ALT (253 ± 35 U/l) and AST (220 ± 25 IU/l) remained significantly high (Figure 6c). The levels of circulating inflammation markers such as MCP-1 and TNF-α were measured. A rapid increase in MCP-1 in plasma was observed after 3 weeks of feeding CDAHFD. Thereafter, MCP-1 levels gradually decreased, although a high concentration persisted for 14 weeks (Figure 6d). Plasma TNF-α concentrations were below the detection limit (<10.9 pg/ml) in all groups. The levels of OH-Pro content in the liver started increasing 6 weeks after the diet was started, reaching 3–4 times the level in mice fed SD by 10 weeks (Figure 6e). Liver histopathology specimens from C57BL/6J mice fed CDAHFD or SD were scored for the severity of hepatocellular steatosis, ballooning, inflammation and fibrosis (Figure 7). At 6 weeks, mild fibrosis in all three mice was observed, and the severity increased time-dependently after that. Representative light micrographs of liver are shown in Figure 8. Masson's trichrome staining after 12-weeks feeding revealed severe fibrosis in CDAHFD livers, but not in SD livers.
Figure 5.
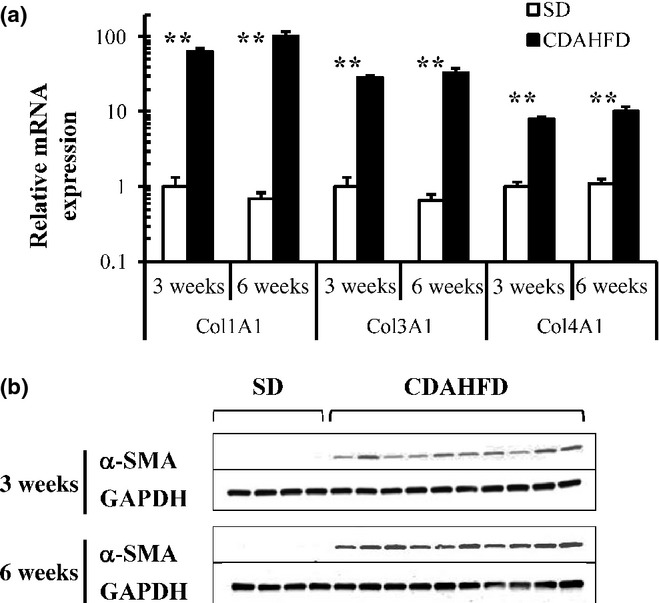
Quantitative real-time PCR of collagen genes (a) and Western blot analysis of alpha-smooth muscle actin (α-SMA; b) of the livers in C57BL/6J mice fed standard diet (SD) or choline-deficient, L-amino acid-defined, high-fat diet (CDAHFD) for 3 and 6 weeks. Collagen mRNA expression levels were normalized to glutaraldehyde-3-phosphate dehydrogenase (GAPDH). Data are means ± SEM (SD, n = 4; CDAHFD, n = 10). **P < 0.01 vs. SD (control).
Figure 6.
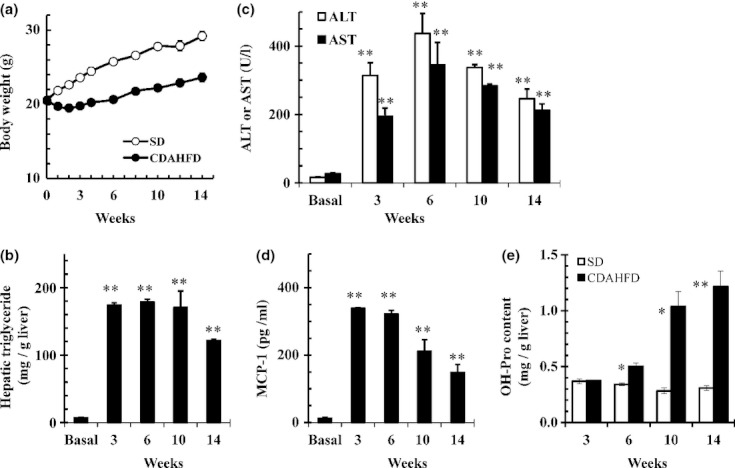
C57BL/6J mice were fed standard diet (SD) or choline-deficient, L-amino acid-defined, high-fat diet (CDAHFD) for 14 weeks. (a) Changes in body weight of mice fed SD or CDAHFD, (b) accumulation of hepatic triglycerides in mice fed CDAHFD, (c) alanine aminotransferase (ALT) and aspartate aminotransferase (AST) levels in mice fed CDAHFD, (d) MCP-1 levels in mice fed CDAHFD, and (e) hydroxyproline (OH-Pro) content of the livers of mice fed SD or CDAHFD. Data are means ± SEM (n = 3). *P < 0.05 and **P < 0.01 vs. Basal or SD (control).
Figure 7.
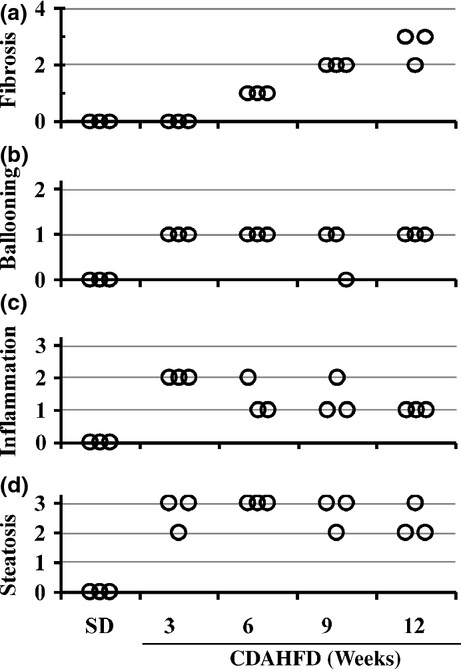
Histopathological evaluation of liver injury in C57BL/6J mice fed standard diet (SD) or choline-deficient, L-amino acid-defined, high-fat diet (CDAHFD) for 3, 6, 9 and 12 weeks (n = 3). Fibrosis (a), ballooning (b), inflammation (c) and steatosis (d) scores were evaluated as detailed in Materials and Methods.
Figure 8.
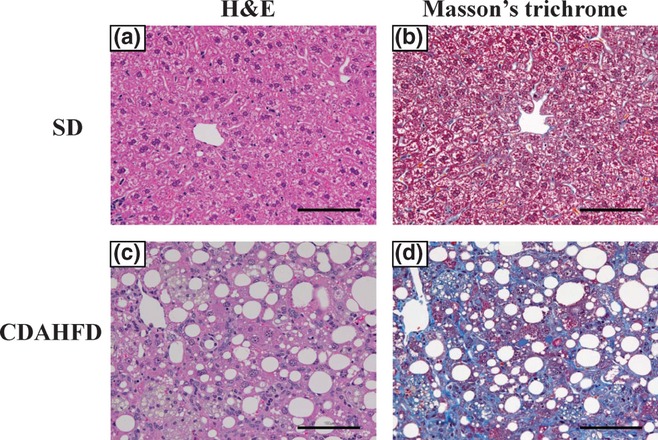
Representative liver histopathology in C57BL/6J mice fed standard diet (SD) or choline-deficient, L-amino acid-defined, high-fat diet (CDAHFD) for 12 weeks. Liver sections were stained with haematoxylin and eosin (H&E) and Masson's trichrome (200 × magnification). Scale bars = 100 μm.
Discussion
The CDAHFD used in this study was formulated as a high-fat, choline-deficient diet including 0.1% methionine and 60 kcal% fat. Our study provided evidence for rapid progression towards steatohepatitis with fibrosis in the short period of 6 weeks in the experimental model of C57BL/6J mice fed CDAHFD. Moreover, when C57BL/6J mice continued to be fed in the same way for 14 weeks, transient loss of body weight recovered and continued to increase and fibrosis further developed.
To date, several groups have reported differences among mice strains with respect to their susceptibility to diet-induced obesity and NASH (Yamazaki et al. 2008; Burrage et al. 2010; Maina et al. 2012). In particular, the NASH phenotype induced by feeding MCDD is more severe in A/J mice than in C57BL/6 mice (Rangnekar et al. 2006), and long-term exposure to a HFD led to NASH and to a high rate of spontaneous hepatocellular carcinomas in C57BL/6J mice but not in A/J mice (Hill-Baskin et al. 2009). In the present study, with A/J mice, whose body weight decreases more markedly than C57BL/6J mice when fed MCDD (Rangnekar et al. 2006), the decrease in body weight when fed CDAHFD was also greater than that of C57BL/6J mice, but the decrease from baseline body weight remained within about 20%. Histopathological fatty liver started developing as steatosis in A/J mice 1 week after starting the diet, accompanied with a marked rise of ALT in the same way as in C57BL/6J mice; inflammatory cell infiltration was weaker than in C57BL/6J mice, and fibrosis was identified not in the sixth week but in the ninth week (data not shown). It was clear that in this model, feeding with CDAHFD rapidly induced fibrosis to develop within 6–9 weeks of beginning the diet, regardless of the mouse strain.
Both choline and methionine are major lipotropic compounds. Lipotropes are important not only as a nutritional elements but as components of the transmethylation pathway (Chahl & Kratzing 1966; György et al. 1967). Humans taking a choline-deficient diet are unable to synthesize phosphatidylcholine (PC) and begin to accumulate intrahepatic triglycerides because PC plays an important role in the secretion of VLDL containing an abundance of triglycerides (Noga & Vance 2003; Sha et al. 2010). Moreover, single-nucleotide polymorphisms (SNPs) of phosphatidylethanolamine N-methyltransferase (PEMT) and microsomal triglyceride transfer protein (MTP) associated with intrahepatic triglyceride metabolism have been found, and several reports indicate that they increase the susceptibility to NAFLD/NASH (Namikawa et al. 2004; Song et al. 2005; Gambino et al. 2007). Intrahepatic triglyceride metabolism is important as the mechanism that controls the accumulation of intrahepatic fat, and the MCDD model, which lacks both choline and methionine, is a representative model of intrahepatic triglyceride metabolism disablement. However, because the MCDD model causes strong systemic effects and extreme loss of body weight, involving not only intrahepatic lipid metabolism but also muscle and visceral fat loss, it is difficult to use this model for long-term observation of the fibrosis process or for a drug efficacy evaluation system. Methionine is the precursor for choline biosynthesis, and the addition of this amino acid as a supplement to a choline-deficient diet can correct the induction of extreme body weight loss depending on the methionine amount.
The CDAA diet is a diet of 30 kcal% fat content containing Primex and corn oil as fat and containing 0.17% methionine to compensate for choline deficiency (Nakae et al. 1990, 1992). This CDAA diet was originally developed as a model to strongly and rapidly cause hepatocellular carcinoma in Fischer 344 or Wistar rats. The processes of fatty liver, liver injury and fibrosis development were observed in the process of hepatocellular carcinoma development in both mice and rats, and its use was expanded to become a NASH model (Nakae et al. 1992; Sakaida et al. 1994; Denda et al. 2002, 2007). In this NASH model, rats fed the CDAA diet develop macrovesicular steatosis, parenchymal inflammation and more pronounced fibrosis, which evolves rapidly forming thin bridges between vascular areas by week 12 (Hironaka et al. 2000). In contrast, C57BL/6J mice fed the CDAA diet develop fatty liver within a few weeks, followed by mild features of NASH; after a prolonged dietary period of 20 weeks or more, mild-to-moderate fibrosis is induced (Denda et al. 2007). Therefore, a rat model fed the CDAA diet is considered to be a suitable animal model with which to examine potential therapeutic agents, such as multiple cytokine modulators (Tsujimoto et al. 2009) and anti-platelet drugs (Fujita et al. 2008).
We also confirmed that there is a difference between mice and rats in the level of demand for lipotropes and the development of liver damage. We fed the CDAA diet to C57BL/6J mice for 6 weeks and confirmed that, differently from the results reported for rats, liver injury was negligible. On the other hand, the development of NAFLD inducing liver injury from the fatty liver could be observed when mice were fed with a 60 kcal% HFD for a long period of time (more than 18 weeks); however, the fibrosis process could not be induced. This reconfirmed that an imbalance of lipotropic elements is an important factor in creating a model to allow rapid study of the process of fibrosis in NAFLD/NASH.
Although there are reports that the amount of methionine required in the feed for growing mice is 0.5%, it is also indicated that this amount may vary with environmental factors (Chahl & Kratzing 1966; John & Bell 1976; Boyd et al. 1985; NRC 1995). We supplied methionine in the drinking water to MCDHFD-fed mice and observed the amount of methionine ingested. As shown in Table 1, the importance of methionine as a dietary lipotrope was reinforced by the methionine-concentration-dependent increase in body weight and epididymal fat pad mass seen in MCDHFD-fed mice. When methionine concentration in the drinking water was 0.1%, no marked differences from mice fed SD were observed in terms of body weight or relative organ weight, although a rise in the level of the liver impairment marker ALT was observed. The amount of methionine ingested under these conditions was observed to correspond to about 3 mg methionine per gram of diet. When feeding was carried out for 3 weeks at a lower methionine level of 0.03% in the drinking water, hypertrophy of the fatty liver was observed, and the epididymal fat pad mass was maintained, although the increase in body weight was suppressed. This methionine ingestion amount corresponded to about 1 mg methionine per gram of diet. On the basis of this result, we prepared a diet containing 0.1% methionine. Feeding with this diet for 3 weeks showed excellent reproducibility, confirming the sharp rise in the liver impairment biomarker and induction of an enlarged liver.
This choline-deficient diet containing 60 kcal% of fat and 0.1% of methionine was named the CDAHFD. Choline-deficient, l-amino acid-defined, HFD pellets were commercially prepared for us, and we examined the results of feeding this diet for 14 weeks. Body weight showed a tendency to decrease 3–6 weeks after the start of feeding; the expression of α-SMA protein, which is a marker for the activation of hepatic stellate cells, increased after the third week; and the development of the hepatic fibrosis process accompanied by an increase in the OH-Pro content, which shows the rise in intrahepatic collagen synthesis, was confirmed after the sixth week. Steatosis and inflammatory cell infiltration were confirmed in chronological histopathological observations of these, and fibrosis was observed via Masson's trichrome staining after 6-weeks feeding. Moreover, when C57BL/6J mice continued to be fed in the same way for 14 weeks, the transient loss of body weight recovered and continued to increase and fibrosis further developed.
The most widely accepted mechanism describing the pathogenesis and progression of NAFLD/NASH is the ‘two-hit’ model; whereby, the first hit is the development of steatosis, which increases the sensitivity of the liver to a variety of the second hits that lead to hepatocyte injury, inflammation and finally fibrosis. With regard to the first hit, obesity-associated insulin resistance has been pointed out as a crucial factor (Day & James 1998; Day 2002). Obesity is a condition marked by excessive deposition and storage of fat, and visceral adiposity is particularly an important risk factor for the development of insulin resistance. Adipose tissue has recently been recognized not only as the body's largest storage site for triglycerides but also as an endocrine organ involved in energy homeostasis (Guilherme et al. 2008). The accumulation of excess lipids in obesity is thought to disturb the normal function of adipose tissue leading to the development of peripheral insulin resistance and thereby to ectopic fat deposition in non-adipose tissues. The HFD model is considered an appropriate model for the process of early liver injury from fatty liver. The current study also found that C57BL/6J mice fed HFD developed steatosis, but without evidence of fibrosis in 24-weeks feeding.
This CDAHFD mouse model could be a useful new tool for investigating the second or multiple hits leading to rapid onset and progression of hepatic fibrosis due to excess accumulation of ectopic fat in the liver. Although CDAHFD was a high-fat and high-calorie diet, it was choline-deficient and contained only the minimum amount of methionine necessary to maintain about the same amount of visceral fat mass as mice fed SD. Similar to the results of a choline-deficient diet (Raubenheimer et al. 2006) and blocking VLDL secretion (Minehira et al. 2008), the CDAHFD model is thought to increase hepatic steatosis due to impaired hepatic VLDL-triglyceride secretive capacity and, by not inducing hypertrophy of visceral fat, would not affect excessive body weight, adiposity or peripheral insulin sensitivity. In contrast to peripheral insulin resistance, hepatic insulin resistance is reported to be associated with fat accumulation and TNF-α expression in the liver (Samuel et al. 2004; Schattenberg et al. 2005). In the present study, we suspected that the observation of hepatic fat accumulation and enhanced expression of TNF-α in the liver (data not shown) might lead to the development of hepatic insulin resistance. Further studies are needed to determine the effect of hepatic fat accumulation on hepatic insulin responsiveness and the insulin signalling pathway.
More recently, the ‘multiple parallel hits’ hypothesis has been proposed to understand the pathogenesis of NASH. The hypothesis emphasizes that a number of very diverse parallel processes might contribute to the development of liver inflammation (Tilg & Moschen 2010). Although the pathogenesis of NASH is a complex, multifactorial process that involves genetic and environmental elements, ectopic accumulation of fat in the liver may begin as a simple over-storage of excess energy. The CDAHFD-fed mice immediately developed liver steatosis with a marked rise in the levels of the liver impairment marker ALT and inflammation marker MCP-1. In a detailed study currently in progress, histology in the first 3 weeks showed that cells in the inflammatory exudates in the liver during the acute phase comprised mononuclear cells and also polymorphonuclear cells. Thereafter, chronic inflammatory infiltrate persisted in the liver, and by 6–14 weeks, it was mainly composed of mononuclear cells. Interestingly, the microscopic features of granuloma-like foci were found in the development of liver fibrosis. The final stage of hepatic fibrosis is cirrhosis, which results in fibrous scarring, and the characterization of these granuloma-like foci and their association with the progression to end-stage liver disease require further study. In addition to these detailed histopathological observations of specimens, analysis of the fibrosis signal based on intrahepatic gene expression is also presently underway. Further examination is in progress aimed at constructing a system for evaluating extracellular matrix remodelling associated with liver fibrosis. It will also be of great interest and will lead the way to a better understanding of the mechanisms that underlie reversal of fibrosis.
In conclusion, we have newly prepared the CDAHFD as a dietary model of NASH with which to rapidly and continuously examine the process of fibrosis in mice. This study showed that mice fed with CDAHFD exhibited an increase in the level of hepatic impairment biomarkers due to excessive fat accumulation in the liver and developed rapidly progressive hepatic fibrosis. This model reproduces the typical disease development of human NASH. With this model, the body weight of mice was maintained and showed a gradual increase during long-term feeding, and the fat continued to accumulate in the liver; therefore, it is possible to make rapid and stable evaluations when studying the fibrosis process. Thus, the CDAHFD model is expected to be utilized as a useful model for evaluating the causes of NASH fibrosis and the changes and remodelling that occur with therapy.
Acknowledgments
We thank Takeshi Arai and Tetsuro Kosugi (LSG Corporation, Tokyo, Japan) for their help with the preparation of this manuscript. We gratefully acknowledge the skilful animal technical assistance of Takako Sakamoto, Mari Kinoshita, Mio Kawai and Yuuichiro Ochiai, members of the In Vivo Experimental Technology Group. We thank Shigeo Suzuki for his contribution in the histopathological evaluation of liver damage and Naoto Toyota for his help in analysing plasma biochemistry. We also thank Editing Services at Chugai Pharmaceuticals Co. Ltd. for language support.
Conflict of interest
All authors are employees of Chugai Pharmaceutical Co. Ltd. and Chugai Research Institute for Medical Science Inc. The authors declare no conflict of interest.
References
- Anderson N, Borlak J. Molecular mechanisms and therapeutic targets in steatosis and steatohepatitis. Pharmacol. Rev. 2008;60:311–357. doi: 10.1124/pr.108.00001. [DOI] [PubMed] [Google Scholar]
- Anstee QM, Goldin RD. Mouse models in non-alcoholic fatty liver disease and steatohepatitis research. Int. J. Exp. Pathol. 2006;87:1–16. doi: 10.1111/j.0959-9673.2006.00465.x. [DOI] [PMC free article] [PubMed] [Google Scholar]
- Bellentani S, Marino M. Epidemiology and natural history of non-alcoholic fatty liver disease (NAFLD) Ann. Hepatol. 2009;8(Suppl 1):S4–S8. [PubMed] [Google Scholar]
- Boyd JN, Graham ES, Graham TC, Tennant BC. A comparison of the response of woodchucks and rats to variations in dietary lipotrope and lipid content. J. Nutr. 1985;115:1136–1146. doi: 10.1093/jn/115.9.1136. [DOI] [PubMed] [Google Scholar]
- Burrage LC, Baskin-Hill AE, Sinasac DS, et al. Genetic resistance to diet-induced obesity in chromosome substitution strains of mice. Mamm. Genome. 2010;21:115–129. doi: 10.1007/s00335-010-9247-9. [DOI] [PMC free article] [PubMed] [Google Scholar]
- Caballero F, Fernandez A, Matias N, et al. Specific contribution of methionine and choline in nutritional nonalcoholic steatohepatitis: impact on mitochondrial S-adenosyl-l-methionine and glutathione. J. Biol. Chem. 2010;285:18528–18536. doi: 10.1074/jbc.M109.099333. [DOI] [PMC free article] [PubMed] [Google Scholar]
- Chahl JS, Kratzing CC. Environmental temperature and choline requirements in rats. II. Choline and methionine requirements for lipotropic activity. J. Lipid Res. 1966;7:22–26. [PubMed] [Google Scholar]
- Day CP. Pathogenesis of steatohepatitis. Best Pract. Res. Clin. Gastroenterol. 2002;16:663–678. doi: 10.1053/bega.2002.0333. [DOI] [PubMed] [Google Scholar]
- Day CP, James OFW. Steatohepatitis: a tale of two “hits”? Gastroenterology. 1998;114:842–845. doi: 10.1016/s0016-5085(98)70599-2. [DOI] [PubMed] [Google Scholar]
- Denda A, Kitayama W, Kishida H, et al. Development of hepatocellular adenomas and carcinomas associated with fibrosis in C57BL/6J male mice given a choline-deficient, l-amino acid-defined diet. Jpn. J. Cancer Res. 2002;93:125–132. doi: 10.1111/j.1349-7006.2002.tb01250.x. [DOI] [PMC free article] [PubMed] [Google Scholar]
- Denda A, Kitayama W, Kishida H, et al. Expression of inducible nitric oxide (NO) synthase but not prevention by its gene ablation of hepatocarcinogenesis with fibrosis caused by a choline-deficient, l-amino acid-defined diet in rats and mice. Nitric Oxide. 2007;16:164–176. doi: 10.1016/j.niox.2006.07.002. [DOI] [PubMed] [Google Scholar]
- Folch J, Lees M, Sloane-Stanley GH. A simple method for the isolation and purification of total lipides from animal tissues. J. Biol. Chem. 1957;226:497–509. [PubMed] [Google Scholar]
- Fujita K, Nozaki Y, Wada K, et al. Effectiveness of antiplatelet drugs against experimental non-alcoholic fatty liver disease. Gut. 2008;57:1583–1591. doi: 10.1136/gut.2007.144550. [DOI] [PubMed] [Google Scholar]
- Gambino R, Cassader M, Pagano G, Durazzo M, Musso G. Polymorphism in microsomal triglyceride transfer protein: a link between liver disease and atherogenic postprandial lipid profile in NASH? Hepatology. 2007;45:1097–1107. doi: 10.1002/hep.21631. [DOI] [PubMed] [Google Scholar]
- Guilherme A, Virbasius JV, Puri V, Czech MP. Adipocyte dysfunctions linking obesity to insulin resistance and type 2 diabetes. Nat. Rev. Mol. Cell Biol. 2008;9:367–377. doi: 10.1038/nrm2391. [DOI] [PMC free article] [PubMed] [Google Scholar]
- György P, Cardi E, Rose CS, Hirooka M, Langer BW., Jr Lipid transport in experimental dietary hepatic injury in rats. J. Nutr. 1967;93:568–578. doi: 10.1093/jn/93.4.568. [DOI] [PubMed] [Google Scholar]
- Hill-Baskin AE, Markiewski MM, Buchner DA, et al. Diet-induced hepatocellular carcinoma in genetically predisposed mice. Hum. Mol. Genet. 2009;18:2975–2988. doi: 10.1093/hmg/ddp236. [DOI] [PMC free article] [PubMed] [Google Scholar]
- Hironaka K, Sakaida I, Uchida K, Okita K. Correlation between stellate cell activation and serum fibrosis markers in choline-deficient l-amino acid-defined diet-induced rat liver fibrosis. Dig. Dis. Sci. 2000;45:1935–1943. doi: 10.1023/a:1005556328028. [DOI] [PubMed] [Google Scholar]
- Inayama S, Shibata T, Ohtsuki J, Saito S. A new microanalytical method for determination of hydroxyproline in connective tissue. Keio J. Med. 1978;27:43–46. doi: 10.2302/kjm.27.43. [DOI] [PubMed] [Google Scholar]
- John AM, Bell JM. Amino acid requirements of the growing mouse. J. Nutr. 1976;106:1361–1367. doi: 10.1093/jn/106.9.1361. [DOI] [PubMed] [Google Scholar]
- Kamada Y, Matsumoto H, Tamura S, et al. Hypoadiponectinemia accelerates hepatic tumor formation in a nonalcoholic steatohepatitis mouse model. J. Hepatol. 2007;47:556–564. doi: 10.1016/j.jhep.2007.03.020. [DOI] [PubMed] [Google Scholar]
- Kashireddy PV, Rao MS. Lack of peroxisome proliferator-activated receptor alpha in mice enhances methionine and choline deficient diet-induced steatohepatitis. Hepatol. Res. 2004;30:104–110. doi: 10.1016/j.hepres.2004.06.004. [DOI] [PubMed] [Google Scholar]
- Kivirikko KI, Laitinen O, Prockop DJ. Modifications of a specific assay for hydroxyproline in urine. Anal. Biochem. 1967;19:249–255. doi: 10.1016/0003-2697(67)90160-1. [DOI] [PubMed] [Google Scholar]
- Kleiner DE, Brunt EM, Van Natta M, et al. Design and validation of a histological scoring system for nonalcoholic fatty liver disease. Hepatology. 2005;41:1313–1321. doi: 10.1002/hep.20701. [DOI] [PubMed] [Google Scholar]
- Kodama Y, Kisseleva T, Iwaisako K, et al. c-Jun N-terminal kinase-1 from hematopoietic cells mediates progression from hepatic steatosis to steatohepatitis and fibrosis in mice. Gastroenterology. 2009;137:1467–1477. doi: 10.1053/j.gastro.2009.06.045. [DOI] [PMC free article] [PubMed] [Google Scholar]
- Maina V, Sutti S, Locatelli I, et al. Bias in macrophage activation pattern influences non-alcoholic steatohepatitis (NASH) in mice. Clin. Sci. 2012;122:545–553. doi: 10.1042/CS20110366. [DOI] [PubMed] [Google Scholar]
- McAnulty RJ. Methods for measuring hydroxyproline and estimating in vivo rates of collagen synthesis and degradation. Methods Mol. Med. 2005;117:189–207. doi: 10.1385/1-59259-940-0:189. [DOI] [PubMed] [Google Scholar]
- Minehira K, Young SG, Villanueva CJ, et al. Blocking VLDL secretion causes hepatic steatosis but does not affect peripheral lipid stores or insulin sensitivity in mice. J. Lipid Res. 2008;49:2038–2044. doi: 10.1194/jlr.M800248-JLR200. [DOI] [PMC free article] [PubMed] [Google Scholar]
- Nagatani Y, Muto Y, Sato H, Iijima M. An improved method for the determination of hydroxyproline. Yakugaku Zasshi. 1986;106:41–46. doi: 10.1248/yakushi1947.106.1_41. (in Japanese) [DOI] [PubMed] [Google Scholar]
- Nakae D, Yoshiji H, Maruyama H, Kinugasa T, Denda A, Konishi Y. Production of both 8-hydroxydeoxyguanosine in liver DNA and gamma-glutamyltransferase-positive hepatocellular lesions in rats given a choline-deficient, l-amino acid-defined diet. Jpn. J. Cancer Res. 1990;81:1081–1084. doi: 10.1111/j.1349-7006.1990.tb02515.x. [DOI] [PMC free article] [PubMed] [Google Scholar]
- Nakae D, Yoshiji H, Mizumoto Y, et al. High incidence of hepatocellular carcinomas induced by a choline deficient l-amino acid defined diet in rats. Cancer Res. 1992;52:5042–5045. [PubMed] [Google Scholar]
- Namikawa C, Shun-Ping Z, Vyselaar JR, et al. Polymorphisms of microsomal triglyceride transfer protein gene and manganese superoxide dismutase gene in non-alcoholic steatohepatitis. J. Hepatol. 2004;40:781–786. doi: 10.1016/j.jhep.2004.01.028. [DOI] [PubMed] [Google Scholar]
- National Research Council (NRC) Nutrient requirements of the laboratory mouse. In: Benevenga NJ, editor. Nutrient Requirements of Laboratory Animals. 4th edn. Washington, D.C: National Academy Press; 1995. pp. 80–102. [Google Scholar]
- Noga AA, Vance DE. Insights into the requirement of phosphatidylcholine synthesis for liver function in mice. J. Lipid Res. 2003;44:1998–2005. doi: 10.1194/jlr.M300226-JLR200. [DOI] [PubMed] [Google Scholar]
- Rangnekar AS, Lammert F, Igolnikov A, Green RM. Quantitative trait loci analysis of mice administered the methionine-choline deficient dietary model of experimental steatohepatitis. Liver Int. 2006;26:1000–1005. doi: 10.1111/j.1478-3231.2006.01314.x. [DOI] [PubMed] [Google Scholar]
- Raubenheimer PJ, Nyirenda MJ, Walker BR. A choline-deficient diet exacerbates fatty liver but attenuates insulin resistance and glucose intolerance in mice fed a high-fat diet. Diabetes. 2006;55:2015–2020. doi: 10.2337/db06-0097. [DOI] [PubMed] [Google Scholar]
- Rinella ME, Elias MS, Smolak RR, Fu T, Borensztajn J, Green RM. Mechanisms of hepatic steatosis in mice fed a lipogenic methionine choline-deficient diet. J. Lipid Res. 2008;49:1068–1076. doi: 10.1194/jlr.M800042-JLR200. [DOI] [PMC free article] [PubMed] [Google Scholar]
- Rizki G, Arnaboldi L, Gabrielli B, et al. Mice fed a lipogenic methionine-choline-deficient diet develop hypermetabolism coincident with hepatic suppression of SCD-1. J. Lipid Res. 2006;47:2280–2290. doi: 10.1194/jlr.M600198-JLR200. [DOI] [PubMed] [Google Scholar]
- Sakaida I, Kubota M, Kayano K, Takenaka K, Mori K, Okita K. Prevention of fibrosis reduces enzyme-altered lesions in the rat liver. Carcinogenesis. 1994;15:2201–2206. doi: 10.1093/carcin/15.10.2201. [DOI] [PubMed] [Google Scholar]
- Samuel VT, Liu ZX, Qu X, et al. Mechanism of hepatic insulin resistance in non-alcoholic fatty liver disease. J. Biol. Chem. 2004;279:32345–323453. doi: 10.1074/jbc.M313478200. [DOI] [PubMed] [Google Scholar]
- Schattenberg JM, Wang Y, Singh R, Rigoli RM, Czaja MJ. Hepatocyte CYP2E1 overexpression and steatohepatitis lead to impaired hepatic insulin signaling. J. Biol. Chem. 2005;280:9887–9894. doi: 10.1074/jbc.M410310200. [DOI] [PubMed] [Google Scholar]
- Sha W, da Costa KA, Fischer LM, et al. Metabolomic profiling can predict which humans will develop liver dysfunction when deprived of dietary choline. FASEB J. 2010;24:2962–2975. doi: 10.1096/fj.09-154054. [DOI] [PMC free article] [PubMed] [Google Scholar]
- Song L, da Costa KA, Fischer LM, et al. Polymorphism of the PEMT gene and susceptibility to nonalcoholic fatty liver disease (NAFLD) FASEB J. 2005;19:1266–1271. doi: 10.1096/fj.04-3580com. [DOI] [PMC free article] [PubMed] [Google Scholar]
- Tilg H, Moschen AR. Evolution of inflammation in nonalcoholic fatty liver disease: the multiple parallel hits hypothesis. Hepatology. 2010;52:1836–1846. doi: 10.1002/hep.24001. [DOI] [PubMed] [Google Scholar]
- Tsujimoto T, Kawaratani H, Kitazawa T, et al. Immunotherapy for nonalcoholic steatohepatitis using the multiple cytokine production modulator Y-40138. World J. Gasteroenterol. 2009;15:5533–5540. doi: 10.3748/wjg.15.5533. [DOI] [PMC free article] [PubMed] [Google Scholar]
- Yamazaki Y, Kakizaki S, Takizawa D, et al. Interstrain differences in susceptibility to non-alcoholic steatohepatitis. J. Gastroenterol. Hepatol. 2008;23:276–282. doi: 10.1111/j.1440-1746.2007.05150.x. [DOI] [PubMed] [Google Scholar]


