

Abstract
Marburg virus causes a highly infectious and lethal haemorrhagic fever in primates and may be exploited as a potential biothreat pathogen. To combat the infection and threat of Marburg haemorrhagic fever, there is a need to develop and license appropriate medical countermeasures. To determine whether the common marmoset (Callithrix jacchus) would be an appropriate model to assess therapies against Marburg haemorrhagic fever, initial susceptibility, lethality and pathogenesis studies were performed. Low doses of virus, between 4 and 28 TCID50, were sufficient to cause a lethal, reproducible infection. Animals became febrile between days 5 and 6, maintaining a high fever before succumbing to disease between 8 and 11 days postchallenge. Typical signs of Marburg virus infection were observed including haemorrhaging and a transient rash. In pathogenesis studies, virus was isolated from the animals’ lungs from day 3 postchallenge and from the liver, spleen and blood from day 5 postchallenge. Early signs of histopathology were apparent in the kidney and liver from day 3. The most striking features were observed in animals exhibiting severe clinical signs, which included high viral titres in all organs, with the highest levels in the blood, increased levels in liver function enzymes and blood clotting times, decreased levels in platelets, multifocal moderate-to-severe hepatitis and perivascular oedema.
Marburg virus (MARV) and the Ebola viruses are members of the family Filoviridae that cause highly lethal haemorrhagic fever (the Ebola viruses are reviewed in Feldmann & Geisbert 2011). There is currently only one recognized species of MARV (Lake Victoria), but numerous different isolates exist (ICTV 2009).
Marburg virus infection initially presents with flu-like symptoms characterized by fever, headaches, nausea, muscle and joint aches and pains. The disease develops rapidly, and a maculopapular rash is a classical clinical sign. Haemorrhage does not occur universally, although is observed in some cases. Death normally occurs within 2 weeks of infection and is due to multiorgan failure, shock or disseminated intravascular coagulation (Hartman et al. 2010). During outbreaks, the virus is normally transmitted through direct contact with infected animals or people, or via their blood, excreta and clothing.
The aerosol route of transmission is not generally associated with natural outbreaks; however, there is some evidence that droplet spread of Reston Ebola virus (REBOV) may have occurred (Jahrling et al. 1996), and animals, and by extrapolation probably humans, can be infected with MARV (or Ebola viruses) by the aerosol route (Bray 2003; Jahrling et al. 1996). The high infectivity and lethality of MARV and other members of the family Filoviridae mean they have to be handled under maximum biocontainment (Containment Level 4 in the UK, Biosafety Level 4 or BSL-4 in the US). They are also considered possible biowarfare or bioterrorist agents and are classed as category A select agents (Borio et al. 2002; Bray 2003; CDC List of Bioterrorism Agents, October 2010). These constraints limit the amount of research that can be performed.
To date, there are no licensed vaccines or other medical countermeasures for disease caused by MARV and the other filoviruses; however, a number of promising vaccine candidates and antiviral treatments are emerging. There is also a need for further understanding of the disease caused by aerosolized virus and the ability to test medical countermeasures against aerosolized virus, to protect populations from the threat (Leffel & Reed 2004). Licensure of a drug or vaccine to protect against MARV infection is likely to rely on the Food and Drug Administration (FDA) Animal Rule (FDA, HHS, 2002), which requires robust and reproducible animal models with high similarity and correlation with the disease in humans. There is, therefore, a real need to develop appropriate animal models, particularly against aerosol infection (Reed & Mohamadzadeh 2007; Reed et al. 2011).
A number of animal models have been developed to assess medical countermeasures for haemorrhagic fevers caused by filoviruses (Bente et al. 2009). Rodents, particularly mice, can be used for initial screening of protective and therapeutic compounds. However, there are limitations as rodents are not naturally susceptible to infection by members of the family Filoviridae and, hence, do not exhibit some of the classical signs of infection. To develop rodent models, it is necessary to either adapt the virus (Bray et al. 1998; Gibb et al. 2001; Warfield et al. 2009) or use immunodeficient mice (Bray 2001; Warfield et al. 2007; Lever et al. 2012). This manipulation limits their suitability for licensure of products. A number of nonhuman primate models of filoviral haemorrhagic fever have been developed (reviewed in Schou & Hansen 2000). Rhesus macaques and other Old World primates are naturally susceptible to filovirus disease by multiple routes of infection and show similar clinical signs and disease progression to that observed in human cases (Geisbert et al. 2003; Haas et al. 1969; Jaax et al. 1996; Shurtleff et al. 2011; Reed et al. 2011).
The common marmoset (Callithrix jacchus) is a New World non-human primate species whose small size (300–500 g) offers some advantage to traditional Old World primates as an animal model (Orsi et al. 2011). Previously, C. jacchus has been reported as a model for inhalational anthrax (Lever et al. 2008a,b), tularaemia (Nelson et al. 2009), melioidosis (Nelson et al., 2011) and for infection by Lassa virus (Carrion et al. 2007) and eastern equine encephalitis virus (Adams et al. 2008) and, more recently, as a model for MARV infection delivered by the intramuscular route of infection (Carrion et al. 2012). The current study was performed to determine whether the common marmoset was susceptible to MARV infection by the aerosol route and whether the pathogenesis was consistent with data obtained from other non-human primate studies and from human data obtained during outbreaks or cases of infection with MARV. This may, then, offer an alternative animal model for the development and testing of vaccines and/or therapeutics against disease caused by MARV.
Materials and methods
Animals
Healthy, sexually mature common marmosets (C. jacchus) were obtained from the Dstl Porton Down breeding colony and housed in male (vasectomized) and female pairs. Animals were allowed free access to food, water and environmental enrichment. The rooms were held at 25 °C on a 12-h light/dark cycle with 30 min dawn and dusk periods at all times. Prior to use in challenge studies, animals were surgically implanted intraperitoneally with a Remo 200 telemetry device to record core body temperature (Remo Technologies Ltd) (Lever et al. 2008a,b). Animals also had Remo 210 Actimeters attached to their identification collars. Activity output was transmitted every 2 s. Data were analysed using eDacq software (EMMS, Hampshire). Baseline temperature data were obtained for at least a week prechallenge. Baseline activity data were obtained for 5–7 days prechallenge, and the average activity of this period was taken as 100%. Prior to challenge, animals were bled from the femoral vein to obtain baseline blood parameters and transferred to a specially designed CL-4 animal laboratory for acclimatization a week prior to challenge. Purpose-built cages were held inside a rigid half-suit isolator compliant with British Standard BS5726.
All animal studies were carried out in accordance with the UK Animals (Scientific Procedures) Act of 1986 and the Codes of Practice for the Housing and Care of Animals used in Scientific Procedures 1989.
Virus growth and enumeration
Human-derived Lake Victoria Marburg virus strain Popp (Vero cell passage 7), from the original human outbreak, was cultured in Vero C1008 cells (ECCAC Cat. Number 85020206) in Dulbecco's modified Eagle's medium (DMEM) (Sigma), supplemented with 2% FCS (Sigma, Dorset, UK), 1% HEPES, 3 mmol/l l-glutamine and 100 units/ml of penicillin and streptomycin (Sigma). Virus cultures were grown at 37 °C in a 5% CO2, humidified atmosphere for 7 days. Virus was isolated from infected tissue culture supernatant cells by centrifugation at 900 g for 15 min prior to titration by end point dilution and storage at −80 °C.
Viral titres within impinger samples (aerosol collection device), blood and homogenized tissues were determined by the use of a modified microtitre end point dilution assay (Piercy et al. 2010). Briefly, to each well of the first column of a tissue culture 96-well plate, containing 70% confluent monolayers of Vero C1008 cells, 100 μl of a 1/10 dilution of the homogenized tissue or blood suspension, or 100 μl neat impinger fluid, was added and serially diluted across the remaining columns of the plate, transferring 20 μl volumes. The plate was incubated at 37 °C in a 5% CO2, humidified atmosphere for 6 days before the addition of 3 μl (1.5%) of neutral red dye (Sigma) and a further overnight incubation at 37 °C in a 5% CO2, humidified atmosphere. Cell monolayers were, then, fixed for 30 min, by the addition of 100 μl per well of 10% formal saline, followed by the removal of excess fluid from the well. The 50% tissue culture infectious dose (TCID50) was calculated by Reed–Muench analysis of virus positive wells as identified by cytopathic effect (CPE), compared with control wells (Reed & Muench 1938).
Aerosol challenge
Marmosets were anaesthetized intramuscularly with 25 mg/kg ketamine prior to exposure and were challenged in pairs by the inhalational route (Lever et al. 2008a,b; Nelson et al. 2009). Briefly, a Collison nebulizer containing 10 ml MARV was used to generate aerosol particles of approximately 1–3 μm. The aerosol was conditioned in a modified Henderson apparatus (Druett 1969). Marmosets were placed in a bespoke exposure/plethysmograph tube (EMMS, Hampshire), and the head only was exposed for 10 min to a dynamic aerosol maintained at 50–55% relative humidity and 18–20 °C. The total accumulated tidal volume for each animal during exposure was determined by whole body real-time plethysmography with a Fleisch pneumotachograph (EMMS, Hampshire). The concentration of virus in the aerosol cloud was quantified by sampling into an all-glass impinger (AGI-30) containing tissue culture media. The sampling is performed for 1 min and ran concurrently with the exposure. The TCID50 assay, as described above, was used to enumerate the virus. An inhaled dose for each individual animal was then derived from the virus concentration and plethysmography data. Inhaled dose was calculated from the aerosol concentration and inhaled volume. The aerosol concentration was derived from the impinger count (TCID50/L), impinger flow rate (12 l/min), impinger volume (10 ml) and impinger sampling time (2 min).
Susceptibility and pathophysiology studies
Initially, a pair of animals was challenged with approximately 10 TCID50 of MARV by the aerosol route to determine whether the common marmoset was susceptible to MARV by the aerosol route. Two further pairs were challenged with approximately the same dose (10 TCID50) to determine whether the course of disease was reproducible. The dose of 10 TCID50 was the lowest virus titre that could be reliably quantified in the assay. This reproducible dose was used in a further pathophysiology study where, following challenge, five pairs of animals were culled at predetermined time-points.
Post-mortem
Post-mortem examinations were performed on all animals upon humane culling or immediately after they were found dead. Organs were removed and assessed for gross pathological changes. For virology, weighed sections were homogenized in 1 ml tissue culture fluid using cell sieves and a syringe barrel. Viral load within homogenized tissue samples was then enumerated in a tissue culture assay as described above. All virology analysis was performed in an ACDP level 4 (BSL-4) containment laboratory within a cabinet line (Lever et al. 2008a,b).
Blood was collected at post-mortem by cardiac puncture into EDTA tubes for haematological analysis by a laser flow cytometry-based haematological analyser (LaserCyte; IDEXX laboratories). Concentrations of albumin, alkaline phosphatase (ALKP), alanine aminotransferase (ALT), aspartate aminotransferase (AST), amylase, total bilirubin, creatinine, blood urea nitrogen, calcium, phosphate, total protein and glucose levels were determined using a ‘dry-slide’ technology biochemistry analyser (VetTest; IDEXX laboratories) from plasma separated from whole blood in lithium heparin tubes. Citrated blood was used to obtain clotting times (prothrombin time, PT and activated partial thromboplastin time, aPPT) using a cassette-based coagulation analyser (DX Coag; IDEXX laboratories). All equipment was kept inside a half-suit isolator and handled under BSL-4 conditions.
Electron microscopy
Tissue samples for electron microscopy were transferred from 10% formalin and fixed in 3% glutaraldehyde in 0.1 M Na-cacodylate buffer for 4 h. To visualize the tissues by scanning electron microscopy (SEM), the sample block faces to be examined were trimmed using a razor blade and postfixed with 1% osmium tetroxide in 0.1 M Na-cacodylate buffer for 1 h. The samples were dehydrated in a graded ethanol series for 30 min each followed by drying in 100% hexamethyldisilazane. After drying, tissues were mounted onto stubs, sputter-coated with 20 nm gold and examined in a Hitachi S-800 field emission SEM operating at 5 kV. For transmission electron microscopy (TEM), tissues were processed as for SEM but, following dehydration in ethanol, were embedded in LR White acrylic resin. Ultrathin sections were stained using uranyl acetate and lead citrate and examined using a FEI CM12 TEM operating at 80 kV. Digital images were acquired using a SIS Keenview 1MP camera.
Histology
Tissues were fixed in 10% buffered formalin solution (Sigma) and processed for paraffin wax embedding using standard techniques for histopathological analysis. Sections nominally 5 ± 2 μm thick were prepared and stained with haematoxylin and eosin (H&E).
Immunohistochemistry
Sections of formalin-fixed wax-embedded tissues were prepared and dried onto polysine slides (VWR Ltd). Sections were rehydrated in xylene, graded alcohol solutions and water before incubating at 37 °C for 10 min in antigen retrieval solution consisting of 0.05% (w/v) pronase XIV (5.2 U/mg Sigma P5147-1G) in phosphate-buffered saline (PBS). Sections were incubated (20 °C for 30 min) to block for secondary antibody binding using rabbit serum (Abcam ab7487 diluted 1:10 in PBS) followed by 10 min in 3% H2O2 to block endogenous peroxidase activity. Slides were incubated at 4 °C overnight in a humidifier tray with a MARV antinucleoprotein monoclonal antibody and then incubated at 20 °C with 7 μg/ml biotinylated polyclonal secondary rabbit anti-mouse IgG antibody (Abcam ab6727-1). Slides were treated with streptavidin-HRP conjugate (Abcam ab64269-125) and antigen binding visualized using diaminobenzidine (DAB) as HRP substrate (Sigma staining kit D-4293). To test for primary antibody non-specific binding, primary monoclonal antibody was replaced with a mouse IgG anti-tularensis antibody, a pathogen not anticipated to be present in any of the tissues. Absence of non-specific secondary antibody binding was confirmed by omission of the primary antibody in the staining procedure. All DAB stained tissue sections were counterstained in haematoxylin for visualization of cell nuclei and then dehydrated in graded alcohols and xylene and coverslipped with DPX mountant (Bios Europe, Lancashire, UK).
In situ detection of apoptosis
The TUNEL technique was applied as previously described (Salguero et al. 2005). Tissue sections were dewaxed, rehydrated and treated for quenching of endogenous per-oxidize activity as described above. Sections were permeabilized by incubation in PBS containing proteinase K (Roche, Welwyn Garden City, UK) 20 mg/ml in PBS for 20 min and washed twice for 5 min in PBS. The terminal deoxynucleotidyl transferase-mediated dUTP nick end labelling (TUNEL) method was used for the histological detection of apoptotic cells. The cells were detected with a kit containing horseradish peroxidase (In Situ Cell Death Detection kit, PODw; Roche) according to the manufacturer's directions. The colour reaction was developed with DAB, and slides were counterstained with Mayer's haematoxylin. Negative controls were always included in each series of sections assayed.
Additional staining of tissue sections
For fibrin, the Lendrum's Martius Scarlet Blue (MSB) technique was applied as previously described (Lendrum et al. 1962) to differentiate new from old fibrin. Viral inclusion bodies were detected by the histochemical Macchiavello's stain as previously described (Baskerville et al. 1978; Bancroft & Gamble 2008).
Cell type determination
Duplicate 200 μl of samples of blood was taken for immunological analysis. For erythrocyte lysis, samples were resuspended in 1 ml of PharmLyse (BD biosciences, Oxford, UK) and incubated for 5 min at room temperature. Samples were microcentrifuged again and resuspended in 200 μl of PBS with 2 μl anti-CD14 (M5E2, BD biosciences, PerCP-cy5.5), anti-CD56 (B159, BD biosciences, PE-cy7), anti-CD3 (SP34-2, BD biosciences APC-cy7) and anti-γ9 (7B6, a kind gift from Prof. Mark Bonneville (INSERM), APC). Samples were incubated for 15 min at room temperature, and paraformaldehyde was added to a final concentration of 4%. Samples were incubated for 96 h at 4 °C to kill virus. Absolute counts were determined by use TRUcount tubes (BD Biosciences) to manufacturer's instructions. Samples were run on a FACS cant II, and analysis was performed on FACS diva (BD biosciences). Events were gated first on the leucocyte population and then by lymphocyte population. CD14+ cells were taken from the leucocyte population, and CD56+ and CD3+ cells were taken from the lymphocyte population.
Cytokine determination
Cytokine bead assay (CBA) flex sets for human Macrophage chemotactic protein-1 (MCP-1), interleukin-1β (IL-1β), interleukin-6 (IL-6) and transforming growth factor-β (TGF-β) were used in accordance with manufacturer's instructions (BD Biosciences). Additionally, a marmoset compatible interferon-γ (IFN-γ) CBA was generated using antibodies supplied by MabTech. In short, bead E4 was conjugated to antibody B6-1 using the bead conjugation kit (BD Biosciences). IFN-γ concentration was elucidated using antibody D1K conjugated to FITC and a standard human interferon-γ (Becton Dickinson, Oxford, UK), and samples were prepared as above. Samples were run on a FACS cant II, and analysis was performed on FACS diva (BD biosciences).
Statistics
Statistical analysis of blood parameters was performed using GraphPad Prism (v4, La Jolla, CA, USA). Data were subjected to a Pearson's omnibus normality test to determine whether it deviated from a Gaussian distribution and data that failed this test were log-transformed and retested. Data that failed both normality tests were analysed by Mann–Whitney U-test. Gaussian-distributed data were analysed by Student's t-test. The Welch's correction was used where t-tested groups had unequal variance, which was determined by F-tests. These analyse were used to determine whether there was a statistically significant difference between the blood parameters obtained prechallenge and at post-mortem at the terminal stage of disease at the 95% confidence level. The statistic program PASW (SPSS) V18 was used to analyse the cytokine and cell count data. Log10-transformation of these data brought the data within the normal distribution, and parameters were tested using univariate analysis of variance (anova).
Results
Lethality studies
A summary of the dose and time to death for animals challenged with aerosolized MARV during lethality studies is shown in Table 1. The disease was assessed using survival, temperature, activity and clinical signs. Initially, the susceptibility of marmosets to aerosolized MARV challenge was investigated with an initial target challenge dose of approximately 10 TCID50 in a pair of animals (Experiment 1). This dose is the lowest viral titre that could be accurately quantified. The calculated dose for these animals was 4 and 8 TCID50 for the female and male, respectively, based on an average impinger count of 10 TCID50 (Table 1). Both animals succumbed to a lethal infection; 8.5 days postchallenge for the female and 10 days for the male. Two further pairs of animals were challenged with approximately the same target challenge dose to determine reproducibility with calculated doses of 16 and 28, and 5 and 11 TCID50s for Experiments 2 and 3, respectively. Animals succumbed between 8.5 and 9.25 days postchallenge (Table 1).
Table 1.
Summary of exposures of marmosets to Marburg virus by the inhalational route during lethality studies
| Experiment | Sex | Accumulated volume (L) | Inhaled dose (TCID50) | Time to death (Days) |
|---|---|---|---|---|
| 1 | ♀ | 1.960 | 8 | 8.50 |
| ♂ | 1.033 | 4 | 10.50 | |
| 2 | ♀ | 1.222 | 16 | 8.50 |
| ♂ | 2.097 | 28 | 8.50 | |
| 3 | ♀ | 2.739 | 11 | 8.75 |
| ♂ | 1.185 | 5 | 9.25 | |
| Mean | 1.706 | 12 | 9.00 |
The temperature profile for all the animals was similar, with a normal diurnal rhythm for 5 days (Figure 1). From 130 h postchallenge (between days 5 and 6), animals became febrile. The fever peaked on day 6–7 and remained high for approximately 60–90 h. Shortly before succumbing to disease, the temperature spiked followed by a rapid decline. The activity data showed a converse pattern as temperature increased, activity decreased. For 5 days postchallenge, the activity of the animals remained unchanged, and then, as the fever commenced, dropped to between 55 and 77% (mean of 66%) of prechallenge activity. The activity continued to decrease to 53% of prechallenge activity on day 7 and for the remaining animals on day 9 was only 20% of prechallenge activity.
Figure 1.
Temperature profile of marmosets after exposure to Marburg virus by the inhalational route. The temperature profile of six animals (represented by six different colours) postchallenge with approximately 10 TCID50 Marburg virus (MARV). Animals were challenged in pairs (red and blue, yellow and green, pink and purple) on three separate occasions to obtain a consistent disease profile.
Animals that died or were humanely culled showed overt clinical signs between 24 and 48 h before succumbing to disease. Overt signs of infection included a hunched posture, dyspnoea and a subdued nature. Typical signs of filoviral infection were observed including haemorrhaging from the vagina, eyes and the puncture wound created by the terminal injection needle; a petechial rash in the terminal stages was observed covering approximately half the abdomen and inside thigh of one of the six animals challenged although it was transient and faded rapidly after death. In addition, three of the six animals had flushed red faces during the terminal stages of the disease.
Pathogenesis study
To investigate the progression of the disease, 10 animals were exposed to a target dose of 10 TCID50. Animals were culled at five predetermined time-points: when animals showed no overt clinical signs (24 and 72 h), when the temperature increased above baseline (128 h), mid-way through the fever period (168 h) and when they succumbed to infection (222 h).
Virological titres
Virus was isolated from the lungs of animals from day 3 postchallenge, with detectable virus in the liver, spleen, blood (and kidney, not shown) from day 5 postchallenge (Figure 2). Viral titres continued to increase, with the highest titres observed in animals that succumbed between 8 and 10 days postchallenge. Highest titres were seen in the blood, but all organs showed a five or greater log increase from the estimated inhaled dose.
Figure 2.
Virology titres in marmosets postexposure to Marburg virus by the inhalational route. Pairs of marmosets were challenged with approximately 10 TCID50 Marburg virus (MARV) by the inhalational route. At various times postchallenge, two animals were culled. Virology titres in the liver (top left), lung (top right) and spleen (bottom left) were enumerated from organ homogenate. Direct counts for virus numbers in the blood were also measured (bottom right). A total of eight animals over several studies succumbed to infection (terminal time-point). At each time-point, the mean TCID50 count and SEM are plotted.
Blood analysis
Complete blood cell counts, blood chemistry values and clotting times were determined for all animals and compared with baseline values obtained prechallenge. Notable changes in blood chemistries are shown in Figure 3. The liver enzymes ALKP and ALT showed a gradual increase in concentration up to day 7 followed by a steep increase at the terminal time-point. AST fluctuated during the initial stages of disease, but a large increase in levels was observed by the terminal time-point. Creatinine showed a similar pattern to ALT and amylase values consistently decreased after an initial peak at day 1 postchallenge (Figure 3). Blood urea nitrogen levels dipped mid-infection but were elevated by the terminal stages (Figure 3). Comparison of baseline blood chemistries to terminal values showed a significant increase in ALT and AST (both p < 0.05, t-test and Mann–Whitney U-test, respectively) and a significant decrease in the pancreatic enzyme amylase (P < 0.01, t-test). There were also significant increases in creatinine (P < 0.001), globulin (P < 0.001) and total bilirubin (P < 0.01, all t-tests, results not shown).
Figure 3.
Selected blood chemistry results and clotting times from marmosets over time after exposure to Marburg virus by the inhalational route. Blood was taken from marmosets prechallenge and at post-mortem at various times postchallenge, and sera were analysed for blood chemistries. (a) Levels of AST, aspartate aminotransferase (filled circle, solid line) and ALT alanine aminotransferase (empty square, dashed line) over time. (b) Levels of ALKP, alkaline phosphatase (filled circle, solid line) and AMYL amylase (empty square, dashed line) over time. (c) Levels of creatinine (filled circle, solid line) and blood urea nitrogen (empty square, dashed line) over time. (d) The clotting time of citrated whole blood was measured; both the activated partial thromboplastin time (aPTT, empty squares, dashed line) and the prothrombin time (PT, filled circles, solid line) were recorded. Data sets include up to 16 values for the prechallenge baseline, n = 2 for time-points at day 1, day 3, day 5 and day 7 postchallenge, and combined data from eight animals that succumbed to infection (terminal).
Complete cell counts identified differences in a number of factors such as white cell count, red blood cell count and haemoglobin levels (all increased postchallenge), mean corpuscular haemoglobin (MCH) and plateletcrit (PCT) (decreased postchallenge), and basophil and eosinophil numbers (increased as the infection progressed) (results not shown). There were statistically significant differences in platelet number, reticulocyte number and neutrophil percentage: The average prechallenge number of platelets (K/μl) was 431 (±88 SEM) compared with a mean platelet number of 198 (±28.5 SEM) at the terminal stage (P < 0.05, t-test). The mean percentage of neutrophils decreased from 41% (±5.9) prechallenge to 9.8% (±5.4 SEM) at the terminal stage (P < 0.001, t-test), and reticulocyte numbers decreased from a mean of 105 k/μl (±14 SEM) to 35 (±4) at the terminal stage (P < 0.001, t-test).
The average clotting time for naïve marmoset blood was <20 s (PT) and 70–120 s (aPPT). Coagulation times for animals that had succumbed to MARV were highly elevated (>100 s for PT, >300 s for aPPT). The increase in clotting times was statistically significant at the terminal stage (P < 0.001 for PT; P < 0.01 for aPTT, both t-tests), and in general, clotting times increased over time (Figure 3).
Flow cytometry was performed on blood collected from the marmosets during the pathogenesis study (Figure 4). The numbers of CD14+ cells fluctuated significantly during the course of infection (P < 0.05, anova). On closer examination, a near 10-fold drop in these cells was observed at 3 days postchallenge. Cytometric interrogation, testing for the cell surface markers CD11c and CD16 on the CD14+ cells, produced no additional information. Changes in B-cell (CD20+) or granulocyte numbers (determined by side and forward scatter profiles) were also observed. For NK-cells (CD56+) and T cells (CD3+), a substantial, >10-fold rise in numbers was measured late in infection at 7 and 9 days. T cells were further divided into γ9+ and CD8+ T cells, and there was no evidence of an expansion of a particular population in response to the infection.
Figure 4.
Marmoset immune response to Marburg infection. Blood was taken from marmosets at post-mortem at various times post-challenge with aerosolized Marburg virus (MARV). Cell numbers (filled shapes and solid lines) are shown against the left Y axis. Cytokine concentrations (empty shapes, dashed lines) are shown against the right Y axis. Mean of duplicate marmosets plus SEM shown.
Further to flow-cytometric analysis, cytometric bead arrays were performed for a number of key cytokines. Interferon-γ, interleukin-1β and MCP-1 all increased as the infection progressed (P < 0.01 for IFN-γ and IL-1β, P < 0.05 for MCP-1, anova) (Figure 4).
Histology and electron microscopy
Gross pathological changes were more apparent at later time-points postchallenge, with initial observations occurring on day 1 when the lungs of a single animal showed signs of haemorrhage. However, this may be an artefact due to the performance of a cardiac puncture prior to post-mortem. At 5 days postchallenge, splenomegaly was observed, livers were slightly mottled, haemorrhagic patches and raised areas were observed in the lungs, and intratesticular haemorrhage was evident in males. By day 7 postchallenge, more severe signs of haemorrhaging including visible clots were evident in the liver. When animals succumbed to infection, the pathological features included splenomegaly, mottled, jaundiced livers with areas of haemorrhaging and haemorrhagic pulmonary tissues. Internal bleeding throughout the body was frequently observed.
Histopathological changes in the organs appeared consistently from day 5 postchallenge and became more severe as animals succumbed to disease. Early signs of infection were apparent in the kidney and liver from day 3 (moderate haemorrhage, thrombi, protein casts in the renal tubules, presence of haemosiderin pigment in the kidney and mild hepatitis and hepatocyte depletion in the liver). At day 5 postchallenge, coinciding with pyrexia, livers showed multifocal, moderate necrotic hepatitis with abundant cell debris and haemorrhage. At this time-point, the kidneys also showed signs of congestion and haemorrhage, spleens showed moderate lymphoid depletion, and the lungs showed mild interstitial pneumonia. At day 7 postchallenge, the histopathology was generally more severe in all organs with interstitial necrosis becoming apparent in the lungs. At the terminal stage (Figures 5a–f), all livers showed multifocal, moderate-to-severe necrotic hepatitis with cell debris and haemorrhage. Megalocytosis was also observed in the livers. In the lungs, perivascular oedema was universally seen, and intra-alveolar haemorrhages were seen in half the animals associated with interstitial necrosis. The appearance of the spleens was characterized by severe lymphoid depletion due to both necrosis and apoptosis of lymphocytes. Haemorrhages in the red pulp were also uniformly observed. Haemorrhage and congestion were also visible in the kidneys.
Figure 5.
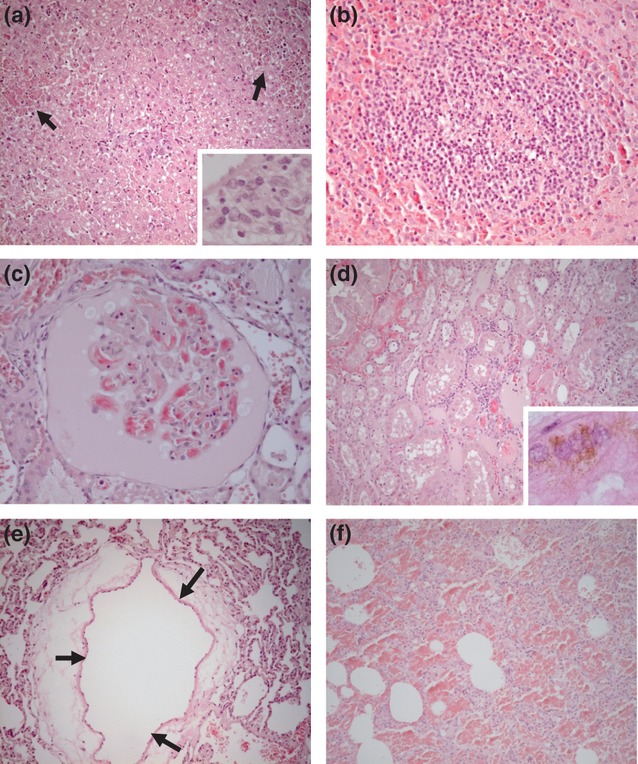
Haematoxylin and eosin (H&E)-stained histology images from marmosets after succumbing to infection with Marburg virus by the inhalational route. (a) Liver. Multiple hepatocellular necrotic foci with haemorrhages (arrows). Insert: necrosis and inflammatory cell infiltrates in the portal area. (b) Spleen. Lymphoid follicle showing significant lymphoid depletion, particularly in the centre of the follicle. (c) Kidney. Glomerular capillaries showing endothelial necrosis and thrombosis. The Bowman's capsule is filled with a protein rich exudate and cellular debris. (d) Kidney. Congestion, intertubular haemorrhages and mild inflammatory infiltrates. Degeneration of tubular epithelial cells and protein casts in the tubular lumina. Insert: haemosiderin in the cytoplasm of tubular epithelial cells. (e) Lung. Marked perivascular oedema (arrows). (f) Lung. Diffuse alveolar haemorrhage and necrosis of alveolar septal walls.
Scanning electron microscopy confirmed the lung histopathology (Figure 6); red blood cells and deposition of fibrin were observed within alveoli. Additional electron microscopy showed viral particles in the lung (Figure 6) and liver (not shown). Vacuoles in the alveolar space appeared to harbour developing virion particles in a closed coil morphology. Mature virus particles in a looped shape were also visible.
Figure 6.
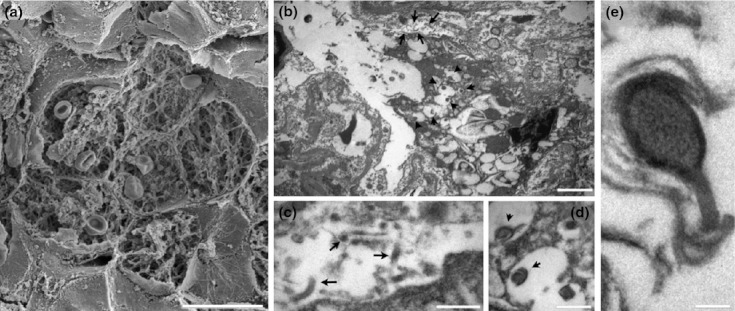
Electron microscopy images from marmoset lung after succumbing to infection with Marburg virus by the inhalational route. (a) SEM of a group of alveoli showing filling with extravasated red blood cells and fibrin deposition. (b) transmission electron microscopy (TEM) of an infected macrophage within an alveolar space. The macrophage contains numerous vacuoles, some of which can be seen to harbour developing virion particles. (c) TEM of the alveolar space adjacent to the infected macrophage showing mature viral particles (arrows) (d, e) Higher magnification TEMs of the developing virion particles within macrophage vacuoles. Scale bars: a – 20 μm; b – 2 μm; c and d – 500 nm; e – 100 nm
A number of stains were performed to gain further insight into the pathology of the disease (selected results, Figure 7). Immunohistochemical examination of tissue sections was performed with an anti-MARV nucleoprotein monoclonal antibody. A positive immunoreaction was observed in spleen, kidney, liver, lung and thymus at day 7 postchallenge and at the terminal time-point. MARV antigen was detected in the spleen of one animal at day 3 postchallenge and in the spleen, liver and lung at day 5 postchallenge. In the spleen, antigen was observed in macrophages in the red pulp, and in the kidneys, antigen was present in the epithelial tubular cell line and mesangial cells within the glomeruli and cell debris in the tubular luminae. The liver antigen was identified mostly in Kupffer cells and hepatocytes, but also within the inflammatory cell infiltrates (mainly periportal). Dendritic cells in the thymus medulla stained positively for viral antigen (Figure 7a–d), and in the lung, antigen was observed in alveolar macrophages and intraseptal cells.
Figure 7.
A range of staining techniques applied to different marmoset organs after infection with Marburg virus by the inhalational route. a–d are from immunohistochemistry (IHC) staining with an anti-Marburg antibody that appears brown. (a) IHC of liver section 7 days after challenge. (b) IHC of spleen section 3 days after challenge. (c) IHC of kidney section at the terminal point of challenge. (d) IHC of thymus section at the terminal point postchallenge. (e) TUNEL (dark brown) staining for apoptosis of a liver section at day 7 postchallenge. (f) TUNEL (dark brown) staining for apoptosis of a spleen section at day 3 postchallenge. (g) Martius Scarlet Blue staining for fibrin of kidney section at the terminal point postchallenge. New fibrin stains red and old fibrin stains blue. (h) Macchiavello staining for inclusion bodies (stained red) of liver section at the terminal point postchallenge.
Apoptosis, identified by TUNEL staining, was mainly observed in lymphocytes of splenic follicles, lymphocytes and macrophages of splenic red pulp (and marginal zone), hepatocytes and inflammatory cell infiltrates within the liver and thymic cortical lymphocytes, and was observed from day 3 postchallenge onwards (Figure 7 e,f).
Martius Scarlet Blue stain was used to stain fibrin and to differentiate new fibrin from old fibrin. Lung tissue did not exhibit any new fibrin deposits. The kidney showed massive fibrin deposits within the Bowman‘s space and tubular luminae (Figure 7g). Interestingly, epithelial tubular cells also showed multiple fibrin droplets within the cytoplasm, pointing to an active intake of protein from the luminae. Fibrin deposition was observed as early as day 3 postchallenge.
Finally, Macchiavello stain was used to detect the presence of viral inclusion bodies as an early sign of infection. Inclusion bodies were observed in the cytoplasm of macrophages in the splenic red pulp from day 5 postchallenge, mild reactions in alveolar macrophages in the lung at day 7 postchallenge and terminal time-point (results not shown), and strong reactions in Kupffer cells and hepatocytes in the liver from day 5 postchallenge onwards (Figure 7h).
Clinical signs were limited to the two animals at the last time-point and included those signs detailed above in the lethality studies. A petechial rash was observed on one of the two animals, which covered the abdomen (approximately 50%). In addition, both animals had flushed faces prior to culling.
Discussion
This study demonstrated that the common marmoset (C. jacchus) is susceptible to airborne MARV with calculated doses of between 4 and 28 TCID50 being sufficient to cause lethal infection. An LD50 for MARV by the aerosol route could not be calculated due to the limit of detection of the viral enumeration assay. However, it was possible to demonstrate reproducible disease patterns and clinical signs using a target dose of 10 TCID50. Low infectious doses (<10 TCID50) are typical for infection by filoviruses in other animal models, and it is estimated to be low in humans. In mice, an LD50 of Zaire Ebola virus (ZEBOV) by the i.p. route was <100 pfu (Bray et al. 1998), and for mouse-adapted MARV, 1000 pfu was lethal to BALB/c mice but only by the i.p route of infection (Warfield et al. 2009). A challenge of 1000 pfu of MARV-Musoke by the intramuscular route was quoted as being >10,000 LD50s, meaning an LD50 is <0.1 pfu by the i.m. route (Geisbert et al. 2010). Recent studies, in collaboration with USAMRIID compared enumeration of ZEBOV in either the TCID50 assay or plaque assay. It was shown that approximately 1 pfu was equivalent to 10 TCID50 units (Sophie Smither, personal communication). Assuming that Marburg virus behaves similarly in the assays to Ebola virus, this would mean that similar LD50 values have been achieved with other primates.
However, details of the infectious dose of MARV by the aerosol route are sparse and hard to compare due to different enumeration methods (Leffel & Reed 2004). Rhesus macaques exposed to as low as 400 pfu aerosolized Ebola virus succumbed in 4–5 days (Johnson et al. 1995). More recently, an LD50 for ZEBOV in cynomolgus macaques could not be established, but animals succumbed to infection with very low pfu challenge doses (2 or 11 pfu) by the aerosol route, similar to the very low lethal doses observed with the marmoset and MARV infection presented here (Reed et al. 2011). Morbidity and mortality were observed in cynomolgus macaques after exposure to a low dose of 2 pfu aerosolized MARV-Angola. These animals succumbed within 7–9 days (Alves et al. 2010). In our studies, marmosets succumbed to disease between 8 and 11 days post-challenge, with a mean time to death of 9 days. The time to death was slightly longer in the marmoset studies, but this is likely to be related to the different strains used, as data from human outbreaks suggest the Angola strain is more virulent than MARV-Popp (Bausch et al. 2008).
Fever is a key feature of human infection by MARV, with temperatures reaching approximately 40 °C during the original outbreak in 1967, after an incubation period of 3–7 days. Interestingly, a second peak of pyrexia was also observed in fatal cases (Hennessen 1971). In the marmoset model, a characteristic temperature profile was observed. These patterns were consistent over the small range of doses studied with no correlation between the dose and time to death (Table 1). Fever was observed in the marmosets approximately 5 days postchallenge with a second peak occurring prior to death. Similar times to the fever onset were observed in macaques exposed to aerosolized MARV-Angola (Alves et al. 2010).
In the marmoset model, other clinical signs became more apparent as the disease progressed and included bleeding, a rash, dyspnoea and vomiting. These observations, along with the fever and changes in behaviour, are consistent with observations made in other non-human primates (Baskerville et al. 1978; Bowen et al. 1978) and humans. During the human DRC MARV outbreak of 1998–2000, the most common symptoms of Marburg haemorrhagic fever included fever, fatigue, nausea and vomiting, diarrhoea and dyspnoea. Few human cases result in haemorrhaging with petechiae only observed in around 5% cases (Colebunders et al. 2007). A rash was observed in one of six animals in the lethality studies and one of the two animals at the final time-point unlike the study by Carrion et al. where no rash was observed. This may be due to viral variation, greater pigmentation of the strain of marmosets used or the slightly longer duration of disease following aerosol exposure compared to intramuscular injection (Carrion et al. 2012). After aerosol exposure to ZEBOV, a rash and other clinical signs such as anorexia are not observed in African green monkeys, but are seen in other non-human primates (Reed et al. 2011).
The onset of clinical signs coincides with the isolation of virus from multiple organs indicating the virus widely disseminates from the lungs after infection. An increasing viral load was observed from day 5 postchallenge and was consistently high in animals that succumbed to infection. This is typical of both rodent and other nonhuman primate models. In mice, adapted MARV was isolated from spleens, livers and lungs from 3 days postchallenge (Warfield et al. 2009). The earlier isolation of virus, compared with the marmosets, is likely to be due to the different challenge route resulting in a more systemic infection and shortened disease course. Virus was first detected in the lungs of rhesus macaques following aerosol infection with MARV-Popp; virus was then detected in the liver, blood and spleen 4 days after infection and in multiple organs by 6 days postinfection (Lub et al. 1995). Immunohistochemistry also confirmed the presence of MARV antigen in spleen (day 3), liver and lung (both day 5) and kidney (day 7 onwards).
The physiology of MARV infection in marmosets is generally consistent with murine and other nonhuman primate data. Increased levels in liver enzymes were observed in mice (Warfield et al. 2007, 2009) and non-human primates (Geisbert et al. 2007) infected with MARV. The increases in levels of ALT, AST and ALKP are indications of liver damage and have been associated with fatal outcomes following exposure to Sudan Ebola virus (SEBOV) in humans (Rollin et al. 2007). Changes in urea, total bilirubin, globulin and creatinine were observed in the marmoset. Elevated creatinine and urea indicate renal damage. The increased globulin and total bilirubin are further indicators of liver damage, whilst the raised bilirubin levels may also be due to the destruction of red blood cells. These results together suggest widespread tissue injury and damage. Amylase levels are typically elevated following filovirus infection, but in the marmosets, a consistent decrease was observed. A decrease in this enzyme has also been reported in control rhesus macaques following challenge with MARV-Musoke by the i.m. route (Daddario-DiCaprio et al. 2006).
Key changes in haematology and the associated coagulopathic state, which are characteristic of haemorrhagic fevers (Fisher-Hoch et al. 1983, 1985) were observed in the marmoset. A significant increase in the white blood cell count and decrease in the platelet numbers were also observed in macaques exposed to aerosolized MARV (Alves et al. 2010). Changes in reticulocyte and red blood cell numbers and haemoglobin levels are consistent with a disease showing haemorrhagic manifestations and impairment of the clotting system.
Statistically significant increases in clotting times (PT and aPTT) compared to baseline times were observed. In humans, a prolonged thrombin time was observed in patients of the original 1967 MARV outbreak (Martini 1973), and a thrombin time of >4 min has been quoted amongst many signs described for MARV infection of humans (Kuhn 2008). Some increase (although not always statistically significantly) in clotting times has been observed in non-human primates infected with Ebola viruses (Bray et al. 2001; Fisher-Hoch et al. 1983; Reed et al. 2011), but to date have only been recorded for MARV infection in mice (Warfield et al. 2009). This highlights a limitation in the MARV murine model as there was either a decrease or no change in the clotting times of mice infected with adapted MARV. The marmoset, however, does show signs of a defective clotting pathway. The decrease in platelets plus the prolonged clotting times are indicative of disseminated intravascular coagulation, a common cause of death in humans and primates exposed to filoviral haemorrhagic fevers. Fibrin deposition is associated with clotting impairment and haemorrhage and was observed in several organs and from early in infection.
Initial histological and electron microscopy examination was consistent with the observations for filovirus disease in other primates (Baskerville et al. 1978, 1985). Virus particles were visualized in the lung and liver from animals that succumbed to MARV infection (Figure 6). The virus appeared as a characteristic loop or in a curled form. The size of virus particles was consistent with other's observations of <100 nm wide and >500 nm in length (Kuhn 2008; Martini 1973).
Focal necrosis in the liver, spleen and proximal convoluted tubules in the kidney and combined with a lack of brain pathology have all been reported in a human case of MARV infection (Rippey et al. 1984) and were observed in the marmoset model. In the current marmoset study, however, there was greater pathology in the lung than observed in the human case. This is probably explained by the fact that the lung is the primary site of infection following aerosol challenge. Lung damage with intra-alveolar haemorrhage was also visible on electron microscopy. Additional staining techniques showed further pathology associated with viral infection; apoptosis, inclusion bodies and fibrin, whilst immunohistochemistry showed the presence of viral antigen in multiple organs. In a report of histological and ultrastructural findings in a fatal case of human Marburg haemorrhagic fever, observations were made similar to those seen in the marmoset; Kupffer cells and cells of the kidney and spleen contained Marburg-like inclusions, and fibrin deposits were observed throughout the red pulp of the spleen and in the macrophages in the lung and multiple organs immunostained positive for viral antigen (Geisbert & Jaax 1998). Following exposure to aerosolized MARV in macaques, aged fibrin was observed in the lung (as also observed in the marmoset), TUNEL-positive lymphocytes were seen in the red pulp of the spleen, viral inclusions were seen in necrotic hepatocytes, and fibrin was observed in the kidneys of all animals (Alves et al. 2010). These observations are consistent with our findings and further demonstrate the suitability of the marmoset as a model for MARV infection. Ultrastructural observations and results of immunostaining are also similar to observations made in mice infected with MARV (Warfield et al. 2009) as well as cynomolgus macaques infected with Ebola viruses (Geisbert et al. 2003; Johnson et al. 1995). Apoptosis, as shown by widespread TUNEL staining in the liver and spleen, may play a role in immunosuppression and the development of septic shock.
Preliminary immunological analysis showed similarities between the marmoset and other models of MARV infection. T cells and natural killer cells increased in numbers over time. Two cytokines (IFN-γ and MCP-1) increased over time. Exposure of macaques to aerosolized MARV-Angola showed little change in IFN-γ levels postexposure but did show an increase in levels of other chemokines and cytokines (Alves et al. 2010). Intramuscular infection of macaques with MARV-Angola led to an increase in IL-6, MCP-1 and IL-1 at the terminal stages of disease (Geisbert et al. 2007). In the mouse-adapted model of MARV infection, IFN-γ and MCP-1 were seen to increase over time (Warfield et al. 2009). The levels of two inflammatory cytokines, INF-γ and IL-1β, increased slightly postchallenge but were low when compared to other marmoset infections (Burkholderia pseudomallei and Francisella tularensis) (T. Laws, personal communication). Further, the rate of the increase in concentration of these cytokines declines after 5 days of infection. This is likely to contribute to the progression of disease and is consistent with a previous observation where the interferon response is evaded by MARV (Basler & Amarasinghe 2009).
The identity of the CD14+ (LPS receptor) cells is unclear. In humans, these cells are monocyte subsets (Autissier et al. 2010). The observed drop in such cells may indicate migration to tissues or that they have been killed by the infection and have not yet been replaced with new cells. The increasing NK and T-cell numbers are contrary to previous data (Fritz et al. 2008); however, a slight decrease in the numbers of these cells is apparent from days 1 and 3 (consistent with previous data), and the numbers climb after these time-points. The data are, therefore, consistent with the ‘robust innate immune response to MARV’ that is ‘delayed relative to the infection’ observed in cynomolgus macaques (Fritz et al. 2008).
Marmosets are susceptible to MARV at very low doses. Postchallenge, marmosets show similar disease patterns, clinical signs and blood chemistries to humans and other nonhuman primates infected with MARV by various routes. A robust small primate model of aerosolized MARV would be entirely appropriate for the future evaluation of filovirus medical countermeasures including vaccines and therapeutics.
Acknowledgments
This work was supported by the Transformational Medical Technologies program contract HDTRA01-03-D-0001-0010 from the Department of Defense Chemical and Biological Defense program through the Defense Threat Reduction Agency (DTRA). The authors acknowledge the skills of P Pearce and A Phelps for telemetry implant surgery and the numerous staff within the Biomedical Sciences department of Dstl who assisted in the care and checking of animals throughout the studies. Particular thanks to M Brown, D Rogers, S Sangster and V Savage for technical assistance.
References
- Adams AP, Aronson JF, Tardif SD, et al. Common marmosets (Callithrix jacchus) as a nonhuman primate model to assess the virulence of eastern equine encephalitis virus strains. J. Virol. 2008;82:9035–9042. doi: 10.1128/JVI.00674-08. [DOI] [PMC free article] [PubMed] [Google Scholar]
- Alves DA, Glynn AR, Steele KE, et al. Aerosol exposure to the angola strain of Marburg virus causes lethal viral hemorrhagic Fever in cynomolgus macaques. Vet. Pathol. 2010;47:831–851. doi: 10.1177/0300985810378597. [DOI] [PubMed] [Google Scholar]
- Autissier P, Soulas C, Burdo TH, Williams KC. Evaluation of a 12-color flow cytometry panel to study lymphocyte, monocyte, and dendritic cell subsets in humans. Cytometry A. 2010;77:410–419. doi: 10.1002/cyto.a.20859. [DOI] [PMC free article] [PubMed] [Google Scholar]
- Bancroft JD, Gamble M. Theory and Practice of histological techniques. 6th edn. Elsevier Health Sciences: Churchill Livingston Elsevier; 2008. [Google Scholar]
- Baskerville A, Bowen ET, Platt GS, McArdell LB, Simpson DI. The pathology of experimental Ebola virus infection in monkeys. J Pathol. 1978;125:131–138. doi: 10.1002/path.1711250303. [DOI] [PubMed] [Google Scholar]
- Baskerville A, Fisher-Hoch SP, Neild GH, Dowsett AB. Ultrastructural pathology of experimental Ebola haemorrhagic fever virus infection. J Pathol. 1985;147:199–209. doi: 10.1002/path.1711470308. [DOI] [PubMed] [Google Scholar]
- Basler C, Amarasinghe G. Evasion of the interferon response by Ebola and Marburg viruses. J. Interferon Cytokine Res. 2009;29:511–520. doi: 10.1089/jir.2009.0076. [DOI] [PMC free article] [PubMed] [Google Scholar]
- Bausch DG, Sprecher AG, Jeffs B, Boumandouki P. Treatment of Marburg and Ebola hemorrhagic fevers: a strategy for testing new drugs and vaccines under outbreak conditions. Antiviral Res. 2008;78:150–161. doi: 10.1016/j.antiviral.2008.01.152. [DOI] [PubMed] [Google Scholar]
- Bente D, Gren J, Strong JE, Feldmann H. Disease modeling for Ebola and Marburg viruses. Dis. Model Mech. 2009;2:12–17. doi: 10.1242/dmm.000471. [DOI] [PMC free article] [PubMed] [Google Scholar]
- Borio L, Inglesby T, Peters CJ, et al. Working Group on Civilian Biodefense. Hemorrhagic fever viruses as biological weapons: medical and public health management. JAMA. 2002;287:2391–2405. doi: 10.1001/jama.287.18.2391. [DOI] [PubMed] [Google Scholar]
- Bowen ET, Platt GS, Simpson DI, McArdell LB, Raymond RT. Ebola haemorrhagic fever: experimental infection of monkeys. Trans. R. Soc. Trop. Med. Hyg. 1978;72:188–191. doi: 10.1016/0035-9203(78)90058-5. [DOI] [PubMed] [Google Scholar]
- Bray M. The role of the Type I interferon response in the resistance of mice to filovirus infection. J. Gen. Virol. 2001;82:1365–1373. doi: 10.1099/0022-1317-82-6-1365. [DOI] [PubMed] [Google Scholar]
- Bray M. Defense against filoviruses used as biological weapons. Antiviral Res. 2003;57:53–60. doi: 10.1016/s0166-3542(02)00200-0. [DOI] [PubMed] [Google Scholar]
- Bray M, Davis K, Geisbert T, Schmaljohn C, Huggins J. A mouse model for evaluation of prophylaxis and therapy of Ebola hemorrhagic fever. J. Infect. Dis. 1998;178:651–661. doi: 10.1086/515386. [DOI] [PubMed] [Google Scholar]
- Bray M, Hatfill S, Hensley L, Huggins JW. Haematological, biochemical and coagulation changes in mice, guinea-pigs and monkeys infected with a mouse-adapted variant of Ebola Zaire virus. J. Comp. Pathol. 2001;125:243–253. doi: 10.1053/jcpa.2001.0503. [DOI] [PubMed] [Google Scholar]
- Carrion R, Jr, Brasky K, Mansfield K, et al. Lassa virus infection in experimentally infected marmosets: liver pathology and immunophenotypic alterations in target tissues. J. Virol. 2007;81:6482–6490. doi: 10.1128/JVI.02876-06. [DOI] [PMC free article] [PubMed] [Google Scholar]
- Carrion R, Jr, Ro Y, Hoosien K, et al. A small non-human primate model for filovirus disease. Virology. 2012;420:117–124. doi: 10.1016/j.virol.2011.08.022. [DOI] [PMC free article] [PubMed] [Google Scholar]
- Center for Disease Control List of Bioterrorism Agents. 2010. CDC website. Available at: http://www.bt.cdc.gov/agent/agentlist-category.asp (Accessed 23 October 2010)
- Colebunders R, Tshomba A, Van Kerkhove MD, et al. International Scientific and Technical Committee “DRC Watsa/Durba 1999 Marburg Outbreak Investigation Group”. Marburg hemorrhagic fever in Durba and Watsa, Democratic Republic of the Congo: clinical documentation, features of illness, and treatment. J. Infect. Dis. 2007;196:S148–S153. doi: 10.1086/520543. [DOI] [PubMed] [Google Scholar]
- Daddario-DiCaprio KM, Geisbert TW, Ströher U, et al. Postexposure protection against Marburg haemorrhagic fever with recombinant vesicular stomatitis virus vectors in non-human primates: an efficacy assessment. Lancet. 2006;367:1399–1404. doi: 10.1016/S0140-6736(06)68546-2. [DOI] [PubMed] [Google Scholar]
- Druett HA. A mobile form of the Henderson apparatus. J. Hyg. 1969;67:437–448. doi: 10.1017/s0022172400041851. [DOI] [PMC free article] [PubMed] [Google Scholar]
- Feldmann H, Geisbert TW. Ebola haemorrhagic fever. Lancet. 2011;377:849–862. doi: 10.1016/S0140-6736(10)60667-8. [DOI] [PMC free article] [PubMed] [Google Scholar]
- Fisher-Hoch SP, Platt GS, Lloyd G, Simpson DI, Neild GH, Barrett AJ. Haematological and biochemical monitoring of Ebola infection in rhesus monkeys: implications for patient management. Lancet. 1983;2:1055–1058. doi: 10.1016/s0140-6736(83)91041-3. [DOI] [PubMed] [Google Scholar]
- Fisher-Hoch SP, Platt GS, Neild GH, et al. Pathophysiology of shock and hemorrhage in a fulminating viral infection (Ebola) J. Infect. Dis. 1985;152:887–894. doi: 10.1093/infdis/152.5.887. [DOI] [PubMed] [Google Scholar]
- Fritz EA, Geisbert JB, Geisbert TW, Hensley LE, Reed DS. Cellular immune response to Marburg virus infection in cynomolgus macaques. Viral Immunol. 2008;21:355–363. doi: 10.1089/vim.2008.0023. [DOI] [PubMed] [Google Scholar]
- Geisbert TW, Jaax NK. Marburg hemorrhagic fever: report of a case studied by immunohistochemistry and electron microscopy. Ultrastruct. Pathol. 1998;22:3–17. doi: 10.3109/01913129809032253. [DOI] [PubMed] [Google Scholar]
- Geisbert TW, Hensley LE, Larsen T, et al. Pathogenesis of Ebola hemorrhagic fever in cynomolgus macaques: evidence that dendritic cells are early and sustained targets of infection. Am. J. Pathol. 2003;163:2347–2370. doi: 10.1016/S0002-9440(10)63591-2. [DOI] [PMC free article] [PubMed] [Google Scholar]
- Geisbert TW, Daddario-DiCaprio KM, Geisbert JB, et al. Marburg virus Angola infection of rhesus macaques: pathogenesis and treatment with recombinant nematode anticoagulant protein c2. J. Infect. Dis. 2007;196:S372–S381. doi: 10.1086/520608. [DOI] [PMC free article] [PubMed] [Google Scholar]
- Geisbert TW, Hensley LE, Geisbert JB, et al. Postexposure treatment of Marburg virus infection. Emerg. Infect. Dis. 2010;16:1119–1122. doi: 10.3201/eid1607.100159. [DOI] [PMC free article] [PubMed] [Google Scholar]
- Gibb TR, Bray M, Geisbert TW, et al. Pathogenesis of experimental Ebola Zaire virus infection in BALB/c mice. J. Comp. Pathol. 2001;125:233–242. doi: 10.1053/jcpa.2001.0502. [DOI] [PubMed] [Google Scholar]
- Haas R, Maass G, Oehlert W. Disease in laboratory personnel associated with vervet monkeys. 3. Experimental infections of monkeys. Primates Med. 1969;3:138–139. [PubMed] [Google Scholar]
- Hartman AL, Towner JS, Nichol ST. Ebola and Marburg hemorrhagic fever. Clin. Lab. Med. 2010;30:161–177. doi: 10.1016/j.cll.2009.12.001. [DOI] [PubMed] [Google Scholar]
- Hennessen W. Epidemiology of “Marburg Virus” disease. In: Martini GA, Siegert R, editors. Marburg Virus Disease. Berlin, Germany: Springer-Verlag; 1971. pp. 161–165. [Google Scholar]
- ICTV (International Committee on Taxonomy of Viruses) 2009. Release. Available at: http://www.ictvonline.org/virusTaxonomy.asp?version=2009 (Accessed March 2011)
- Jaax NK, Davis KJ, Geisbert TJ, et al. Lethal experimental infection of rhesus monkeys with Ebola-Zaire (Mayinga) virus by the oral and conjunctival route of exposure. Arch. Pathol. Lab. Med. 1996;120:140–155. [PubMed] [Google Scholar]
- Jahrling PB, Geisbert TW, Jaax NK, Hanes MA, Ksiazek TG, Peters CJ. Experimental infection of cynomolgus macaques with Ebola-Reston filoviruses from the 1989–1990 U.S. epizootic. Arch. Virol. 1996;11:115–134. doi: 10.1007/978-3-7091-7482-1_11. [DOI] [PubMed] [Google Scholar]
- Johnson E, Jaax N, White J, Jahrling P. Lethal experimental infections of rhesus monkeys by aerosolized Ebola virus. Int. J. Exp. Pathol. 1995;76:227–236. [PMC free article] [PubMed] [Google Scholar]
- Kuhn JH. In filoviruses: a compendium of 40 years of epidemiological, clinical, and laboratory studies. In: Calisher CH, editor. Filoviruses. Wien, New York: Springer; 2008. p. 101. [PubMed] [Google Scholar]
- Leffel EK, Reed DS. Marburg and Ebola viruses as aerosol threats. Biosec. Bioterror. 2004;2:186–190. doi: 10.1089/bsp.2004.2.186. [DOI] [PubMed] [Google Scholar]
- Lendrum AC, Fraser DS, Slidders W, Henderson R. Studies on the character and staining of fibrin. J. Clin. Pathol. 1962;15:401. doi: 10.1136/jcp.15.5.401. [DOI] [PMC free article] [PubMed] [Google Scholar]
- Lever MS, Howells JL, Bennett AM, Parks S, Broster MG. The microbiological validation of a new containment level 4 cabinet line. J. Appl. Biosafety. 2008a;13:98–105. [Google Scholar]
- Lever MS, Stagg AJ, Nelson M, et al. Experimental respiratory anthrax infection in the common marmoset (Callithrix jacchus. Int. J. Exp. Pathol. 2008b;89:171–179. doi: 10.1111/j.1365-2613.2008.00581.x. [DOI] [PMC free article] [PubMed] [Google Scholar]
- Lever MS, Piercy TJ, Steward JA, et al. Lethality and pathogenesis of airborne infection with filoviruses in A129 alpha}/{beta -/- interferon receptor-deficient mice. J. Med. Microbiol. 2012;61:8–15. doi: 10.1099/jmm.0.036210-0. [DOI] [PubMed] [Google Scholar]
- Lub M, Sergeev AN, P'Iankova OV, P'Iankova OG, Petrishchenko VA, Kotliarov LA. Certain pathogenic characteristics of a disease in monkeys infected with the Marburg virus by an airborne route. Vopr. Virusol. 1995;40:158–161. [PubMed] [Google Scholar]
- Martini GA. Marburg virus disease. Postgrad. Med. J. 1973;49:542–546. doi: 10.1136/pgmj.49.574.542. [DOI] [PMC free article] [PubMed] [Google Scholar]
- Nelson M, Lever MS, Savage VL, et al. Establishment of lethal inhalational infection with Francisella tularensis (tularaemia) in the common marmoset (Callithrix jacchus. Int. J. Exp. Pathol. 2009;90:109–118. doi: 10.1111/j.1365-2613.2008.00631.x. [DOI] [PMC free article] [PubMed] [Google Scholar]
- Nelson M, Dean RE, Salguero FJ, et al. Development of an acute model of inhalational melioidosis in the common marmoset (Callithrix jacchus. Int. J. Exp. Pathol. 2011;92:428–435. doi: 10.1111/j.1365-2613.2011.00791.x. [DOI] [PMC free article] [PubMed] [Google Scholar]
- Orsi A, Rees D, Andreini I, Venturella S, Cinelli S, Oberto G. Overview of the marmoset as a model in nonclinical development of pharmaceutical products. Regul. Toxicol. Pharmacol. 2011;59:19–27. doi: 10.1016/j.yrtph.2010.12.003. [DOI] [PMC free article] [PubMed] [Google Scholar]
- Piercy TJ, Smither SJ, Steward JA, Eastaugh L, Lever MS. The survival of filoviruses in liquids, on solid substrates and in a dynamic aerosol. J. Appl. Micobiol. 2010;109:1531–1539. doi: 10.1111/j.1365-2672.2010.04778.x. [DOI] [PubMed] [Google Scholar]
- Reed DS, Mohamadzadeh M. Status and challenges of filovirus vaccines. Vaccine. 2007;25:1923–1934. doi: 10.1016/j.vaccine.2006.11.037. [DOI] [PubMed] [Google Scholar]
- Reed LJ, Muench H. A simple method of estimating fifty percent endpoints. Am. J. Hyg. 1938;27:493–497. [Google Scholar]
- Reed DS, Lackemeyer MG, Garza NL, Sullivan LJ, Nichols DK. Aerosol exposure to Zaire ebolavirus in three nonhuman primate species: difference in disease course and clinical pathology. Microbes Infect. 2011;13:930–936. doi: 10.1016/j.micinf.2011.05.002. [DOI] [PubMed] [Google Scholar]
- Rippey JJ, Schepers NJ, Gear JH. The pathology of Marburg virus disease. S. Afr. Med. J. 1984;66:50–54. [PubMed] [Google Scholar]
- Rollin PE, Bausch DG, Sanchez A. Blood chemistry measurements and D-Dimer levels associated with fatal and nonfatal outcomes in humans infected with Sudan Ebola virus. J. Infect. Dis. 2007;196:S364–S371. doi: 10.1086/520613. [DOI] [PubMed] [Google Scholar]
- Salguero FJ, Sanchez-Cordon PJ, Nunez A, Fernandez de Marco M, Gomez-Villamandos JC. Proinflammatory cytokines induce lymphocyte apoptosis in acute African swine fever infection. J. Comp. Pathol. 2005;132:289–302. doi: 10.1016/j.jcpa.2004.11.004. [DOI] [PubMed] [Google Scholar]
- Schou S, Hansen AK. Marburg and Ebola virus infections in laboratory non-human primates: a literature review. Comp. Med. 2000;50:108–123. Review. [PubMed] [Google Scholar]
- Shurtleff AC, Warren TK, Bavari S. Nonhuman primates as models for the discovery and development of ebolavirus therapeutics. Expert Opin. Drug Discov. 2011;6:233–250. doi: 10.1517/17460441.2011.554815. [DOI] [PubMed] [Google Scholar]
- Warfield KL, Alves DA, Bradfute SB, et al. Development of a model for marburgvirus based on severe-combined immunodeficiency mice. Virol. J. 2007;4:108. doi: 10.1186/1743-422X-4-108. [DOI] [PMC free article] [PubMed] [Google Scholar]
- Warfield KL, Bradfute SB, Wells J, et al. Development and characterization of a mouse model for Marburg hemorrhagic fever. J. Virol. 2009;83:6404–6415. doi: 10.1128/JVI.00126-09. [DOI] [PMC free article] [PubMed] [Google Scholar]