

Abstract
We explore the evolutionary origins of dosage compensation (DC) in sex chromosomes in the context of metabolic control theory. We consider first the cost of gene loss (hemizygosity) per se in reducing flux, and examine two relationships between flux and fitness (linear and Gaussian) to calculate a fitness cost of hemizygosity. Recognizing that new sex chromosomes are derived from autosomes, we also calculate the cost of unmasking deleterious mutations segregating on the nascent sex chromosomes as loci become hemizygous. The importance of deleterious mutations to the fitness cost of hemizygosity depends on their frequency, and on the relative costs of halving gene dose for wild-type alleles. We then consider the evolution of DC in response to gene loss, and include a cost of overexpression (i.e., DC such that expression exceeds the wild-type homozygote). Even with costs to excess flux, hypomorphic mutations can cause the optimal level of DC to be higher than 2-fold when the absolute cost of hemizygosity is small. Finally, we propose a three-step model of DC evolution: 1) once recombination ceases and the Y begins to deteriorate, genes from longer metabolic pathways should be lost first, as halving these genes does not drastically reduce flux or, thereby, fitness; 2) both the cost of hemizygosity and the presence of hypomorphic mutations will drive an increase in expression, that is, DC; 3) existing DC will now permit loss of genes in short pathways.
Keywords: sex chromosome evolution, metabolic control theory, X chromosome
Introduction
Many species with genetic sex determination possess heteromorphic sex chromosomes. These sex chromosomes evolved from autosomes (Bull 1983), with the neo-Y (or neo-W) losing genes once recombination with the homolog ceased. Genes residing on nonhomologous regions of sex chromosomes have different copy numbers in males and females. In XY systems, males have one copy of such genes, compared with two copies in females. (Throughout the manuscript, we focus on males in XY species, but our conclusions are equally relevant for females in ZW systems. We return to the distinction between these two systems in the discussion.) In many species with heteromorphic sex chromosomes, the phenomenon of dosage compensation (DC) is apparent, wherein differences in gene dose are corrected by differences in gene expression.
Under the current model for the evolution of sex chromosomes from autosomes (Charlesworth B and Charlesworth D 2000; but see Carvalho 2002; Carvalho et al. 2009 for alternate models of Y chromosome evolution), once sex determination involving male heterogamety evolves, alleles at linked loci that perform well in males are expected to accumulate near the sex-determining allele (Bull 1983; Charlesworth 1996b). This in turn selects for reduction of recombination, leading to a proto-Y that no longer recombines with the X chromosome. At this point, the region of the proto-Y lacking recombination is doomed, as genes on it will begin to degrade due to a variety of Hill–Robertson effects, including Muller’s ratchet (Muller 1918; Bachtrog et al. 2011) and background selection (Charlesworth 1996a). This degradation effectively causes the loss of genes from the neo-Y, leading to hemizygosity in the heterogametic sex. The rate at which genes are lost will depend on the strength of selection opposing their loss. The strength of selection will depend on the magnitude of the deleterious fitness consequences of hemizygosity: genes whose hemizygosity results in minor fitness reductions should be lost more readily than those in which loss would exhibit major fitness costs.
There are two causes of a fitness cost of hemizygosity. One is the halving of gene dose per se, which might result in insufficient gene product to perform a particular function. This is the essence of the prevailing theory to explain DC, which presumes that asymmetries in dosage among genes result in asymmetries in their products, which in turn result in functional problems. This is the classic “peril of hemizygosity” of Ohno (1967). Second is unmasking of deleterious alleles, which will result in lower fitness of hemizygous males if the deleterious alleles exhibit incomplete dominance (Fisher 1935; Kondrashov and Crow 1991).
Loss of a gene from a population is gradual, such that there will initially be only a single Y without the gene but, over time, all Y chromosomes will come to lack the gene. When the first copy of a gene is lost from the Y, the equilibrium frequency of a deleterious allele at the homologous locus on the X is expected to be the same as if the gene were autosomal and in mutation–selection balance. However, as more Y chromosomes come to lose the gene, the frequency of the X-linked deleterious allele will decline as it becomes exposed to more frequent selection in hemizygous males. Once all Y chromosomes lack the gene, the frequency of the deleterious allele will reach a new, sex-linked, mutation–selection balance.
Once the first copy of a gene is lost from a Y, there is an opportunity for DC to evolve. Two factors may cause a benefit for the evolution of increased expression in hemizygous males, both of which confer higher fitness on males with DC relative to males lacking compensation. First is the benefit of restoring the appropriate dose that was halved due to hemizygosity. This factor is the essence of the prevailing theory to explain DC, which presumes that DC essentially acts to increase expression of loci on the single X in males relative to expression of loci present in two copies on the autosomes. Put another way, DC has evolved to maintain constant levels of expression at loci that are lost from the Y, and remain on the X, as the Y degenerates (Charlesworth 1996b). Second is the benefit of increasing the expression of hypomorphic deleterious mutations that are unmasked in hemizygotes. A hypomorphic allele is one in which the function of the protein is substantially reduced, but not eliminated, either due to reduction in expression or to a protein change resulting in lower efficiency. Overcoming the reduction in function of a hypomorphic mutation is achieved through an increase in expression levels, that is, compensation.
Here, we present simple models to examine selective pressures driving DC in response to the loss of genes from the neo-Y chromosome. Each gene is assumed to encode an enzyme that catalyzes one step in a multistep pathway. The product of the pathway alters the value of a trait that is under selection in the organism. We first elucidate the fitness consequences of gene loss from the Y to understand how factors such as the length of a pathway and the strength of selection acting on the trait affect gene loss from a newly evolving Y chromosome. We then examine the fitness consequences of compensation, that is, increased expression from the hemizygous X, in males to determine the factors affecting the evolution of DC. In our models, we include deleterious mutations, specifically hypomorphic mutations, to determine the relative importance of gene dose halving per se versus the effect caused by unmasking deleterious alleles.
Our results make specific predictions concerning the early evolution of sex chromosomes. Following the evolution of reduced recombination between the neo-X and neo-Y, genes in long but not short pathways will be lost from the Y as a consequence of Muller’s ratchet and/or background selection. Deleterious alleles will reduce the rate at which genes are lost, but selection will be weak, such that gene loss will nevertheless occur. Loss of genes from the Y will lead to selection for DC. The level of compensation that initially evolves is unlikely to be exactly 2-fold, because any level of compensation will be favored by selection. Further, the optimal level of DC may be above 2-fold if hypomorphic mutations are segregating. If the effects of increased expression extend across multiple loci, the evolution of DC will reduce the cost of loss of genes in short pathways. As more copies of the neo-Y lose a gene, the optimal level of DC will be closer to 2-fold, because hypomorphic deleterious alleles will become rarer. As more genes are lost, a regional or chromosome-wide mechanism of DC may evolve, and there will be only very weak selection against further gene loss, and deterioration of the remaining genes on the Y will accelerate.
Materials and Methods
Our interest is in examining the fitness costs of gene loss from the newly evolving Y in hemizygous males in the absence and presence of DC. To calculate this cost, we need to determine the relationship between changes in dose and changes in fitness. We construct a single locus model in which the locus encodes an enzyme representing a single step in a multistep, linear metabolic pathway. In essence, a single substrate enters the pathway and a single product is produced by the pathway. The entire pathway might involve a single enzymatic step, in which the beginning substrate is directly converted into the final product. Alternatively, the pathway can involve multiple steps, each of which produces an intermediate, which is then used by the enzyme that catalyzes the next step. The rate of production of the final product is the phenotype that affects fitness, and is determined by flux through the entire pathway.
First, we determine the effects of halving gene dose on fitness. To do this, we specify the effects of hemizygosity on enzyme concentration, and then determine the relationships between enzyme concentration and flux through a pathway, and finally between flux and fitness. We then use these fitness measures to calculate the equilibrium frequency of a deleterious allele segregating at the focal locus. We then calculate the reduction in fitness caused by hemizygosity, both in the absence and presence of DC. The cost of gene loss (hemizygosity) is the difference between the fitness of a male possessing two copies of the focal gene and a male possessing a single copy, in the absence of DC. Similarly, the benefit of DC is the difference between the fitness of a hemizygous male exhibiting some level of DC versus one lacking DC.
Focal Enzyme Concentration
The enzyme we model is assumed to be encoded by a locus that resides in the region of the neo-Y that no longer recombines with the X. The Y-linked copy of the locus is thus subject to mutational loss due to background selection and/or Muller’s ratchet on the Y. All other enzymes in the pathway are assumed to be on autosomes, or in pseudo-autosomal, that is, recombining, regions of the sex chromosomes. A single wild-type allele at the focal locus produces a concentration of enzyme equal to E/2 (E is actually a composite parameter, as discussed in the next section, but is most easily considered as concentration). A single mutant allele at the locus produces an amount of enzyme equal to Em/2. The only constraint on the enzyme concentration produced by the mutant allele is that it is less than that produced by the wild-type allele, implying that E > Em ≥ 0. If a mutant allele is hypomorphic such that the function of the protein is reduced but not eliminated, then E > Em > 0. With these assumptions, we obtain the enzyme concentrations for each of the possible genotypes shown in table 1. Note that a hemizygous male produces half as much enzyme as a homozygous, wild-type male in the absence of DC.
Table 1.
The Fitness (Second Column) and Relative Enzyme Concentration (Third Column) of Each Genotype for a Single Locus in Mutation–Selection Balance
| Genotype | Fitness | Enzyme Concentration |
|---|---|---|
| AA | 1 | E |
| Aa | wAa | (E + Em)/2 |
| Aa | waa | Em |
| A | wA | cE/2 |
| A | wa | cEm/2 |
Note.—0 ≤ waa ≤ wAa ≤ 1, 0 ≤ wa ≤ wA ≤ 1 (assumption of directional selection) and 0 ≤ Em < E. E is the enzyme concentration for a homozygous wild-type individual, and Em is the enzyme concentration for an individual who is homozygous for a deleterious mutation. The level of DC is measured by the parameter c (c ≥ 1); in the absence of compensation, c = 1.
Metabolic Control Theory
In their classic paper, Kacser and Burns (1981) demonstrated that enzymes that catalyze reactions in metabolic pathways are likely to exhibit partial dominance for loss of function mutations: that is, halving the dose of an enzyme in a metabolic pathway results in a reduction in flux through the pathway that is less than half. As the number of steps in the pathway increases, the reduction in flux caused by halving the dose becomes quite small. Beginning with standard enzyme kinetics they showed that the flux through a pathway, F, of length n enzymatically catalyzed steps is
 |
(1) |
where Cx is a constant and the Ei are composite parameters that include the kinetic parameters associated with each enzyme step i in the pathway. Importantly, the Ei are proportional to the maximal velocity of each enzymatic step, such that a reduction in dosage or expression level of an enzyme will reduce its Ei. For simplicity, we refer to an enzyme’s Ei as its concentration.
A reduction in the concentration of any enzyme in the pathway will result in a reduction in total flux through the pathway. A null mutant allele, if homozygous or hemizygous, results in no functional enzyme and will cause Ei for that enzyme to be zero, which in turn causes the flux through the pathway to be zero. For simplicity, we assume that all steps in a particular pathway are equivalent in terms of enzyme kinetics, such that Ei = E for all enzymes except the one whose expression is altered (the focal enzyme). With this assumption we can write the relative flux through the pathway, which is calculated so that the flux when all steps have the same enzyme concentration is 1 regardless of the value of n, as
| (2) |
where Ef is the concentration of the altered enzyme in the pathway. A reduction in Ef results in a reduction in flux, but if the pathway is long (n large), this reduction will be small unless the reduction in concentration is substantial (fig. 1). If the Ei vary across different steps in the pathway, then those steps with smaller Ei will be more sensitive to reductions in flux: reductions in their concentration will cause larger reductions in the flux of the entire pathway.
Fig. 1.—

The relationship between Ei for a focal enzyme in a pathway of length 1, 5, or 10 enzymatic steps, and the relative flux through the pathway. All Ei in the pathway, except the one associated with the focal enzyme, and Cx are set to 1. Relative flux is calculated by dividing absolute flux with one altered enzyme by the absolute flux with all enzymes identical, where flux is obtained from equation (2). To achieve a 50% reduction in flux in a pathway of 1, 5, or 20 enzymatic steps would require a reduction in Ei of 50%, 83%, or 95% in Ei, respectively. Modified from Kacser and Burns (1981).
Our focal enzyme has concentration equal to E when it is homozygous for the wild-type allele (table 1), in which case the relative flux through the pathway is 1. For all other genotypes, the flux will be less than 1 in the absence of DC, because of the reduction in enzyme concentration. Reduced concentration is caused either the presence of one or two mutant alleles in the heterozygote or mutant homozygote, respectively, or by the halving in dose in the wild-type hemizygote, or both in the mutant hemizygote.
Fitness versus Flux
We now turn to the relationship between fitness and relative flux through a metabolic pathway. For genes that are essential (i.e., lethal when deleted), zero flux through a pathway is expected to correspond to zero fitness. Assuming that pathways are well adapted, we might also assume that wild-type flux is optimal, and corresponds to maximal fitness. Besides these two situations, we have almost no information on the relationship between flux and fitness. There are several possibilities, and we will examine two fitness functions here, linear and Gaussian. We also examine two additional functions in the supplementary materials, Supplementary Material online, a rational function and a quadratic function of fitness versus flux. These four fitness functions likely capture much of the possible variation.
We assume that fitness is maximal when flux  ,
where
,
where  is the optimal flux, and is equal to 1 if we
are using relative flux (see previous section). This is the flux exhibited by the
homozygous wild-type genotype, which produces a concentration of enzyme equal to
E. When we consider the evolution of DC, we will need to know the
effect of fluxes greater than 1. We consider two situations: either an increase in the
trait, due to an increase in flux, has no impact on fitness, that is, it remains at 1; or,
alternatively, increasing the value of the trait, through increases in flux, reduces
fitness. We assume that the reduction in fitness has the same general shape as the fitness
function when flux is between 0 and 1, but might be stretched so that fitness can decline
slowly, or not at all, with increasing flux above the optimum. This assumption is captured
in the parameter m (0 ≤ m ≤ 1).
When m is zero, there is no cost to an increase in flux above the
optimum, and when m = 1 the fitness function is symmetrical around
the optimum (fig. 2 and supplementary figs. S1 and S2, Supplementary Material online). Manipulative overexpression of glycolytic
enzymes in yeast has no fitness effect (Rosenzweig
1992a, 1992b), suggesting that
m may be close to zero. However, others have found that perhaps
15% (Sopko et al. 2006) to 32%
(Yoshikawa et al. 2011) of genes reduce
fitness in yeast when overexpressed, suggesting a positive, nonzero m.
is the optimal flux, and is equal to 1 if we
are using relative flux (see previous section). This is the flux exhibited by the
homozygous wild-type genotype, which produces a concentration of enzyme equal to
E. When we consider the evolution of DC, we will need to know the
effect of fluxes greater than 1. We consider two situations: either an increase in the
trait, due to an increase in flux, has no impact on fitness, that is, it remains at 1; or,
alternatively, increasing the value of the trait, through increases in flux, reduces
fitness. We assume that the reduction in fitness has the same general shape as the fitness
function when flux is between 0 and 1, but might be stretched so that fitness can decline
slowly, or not at all, with increasing flux above the optimum. This assumption is captured
in the parameter m (0 ≤ m ≤ 1).
When m is zero, there is no cost to an increase in flux above the
optimum, and when m = 1 the fitness function is symmetrical around
the optimum (fig. 2 and supplementary figs. S1 and S2, Supplementary Material online). Manipulative overexpression of glycolytic
enzymes in yeast has no fitness effect (Rosenzweig
1992a, 1992b), suggesting that
m may be close to zero. However, others have found that perhaps
15% (Sopko et al. 2006) to 32%
(Yoshikawa et al. 2011) of genes reduce
fitness in yeast when overexpressed, suggesting a positive, nonzero m.
Fig. 2.—
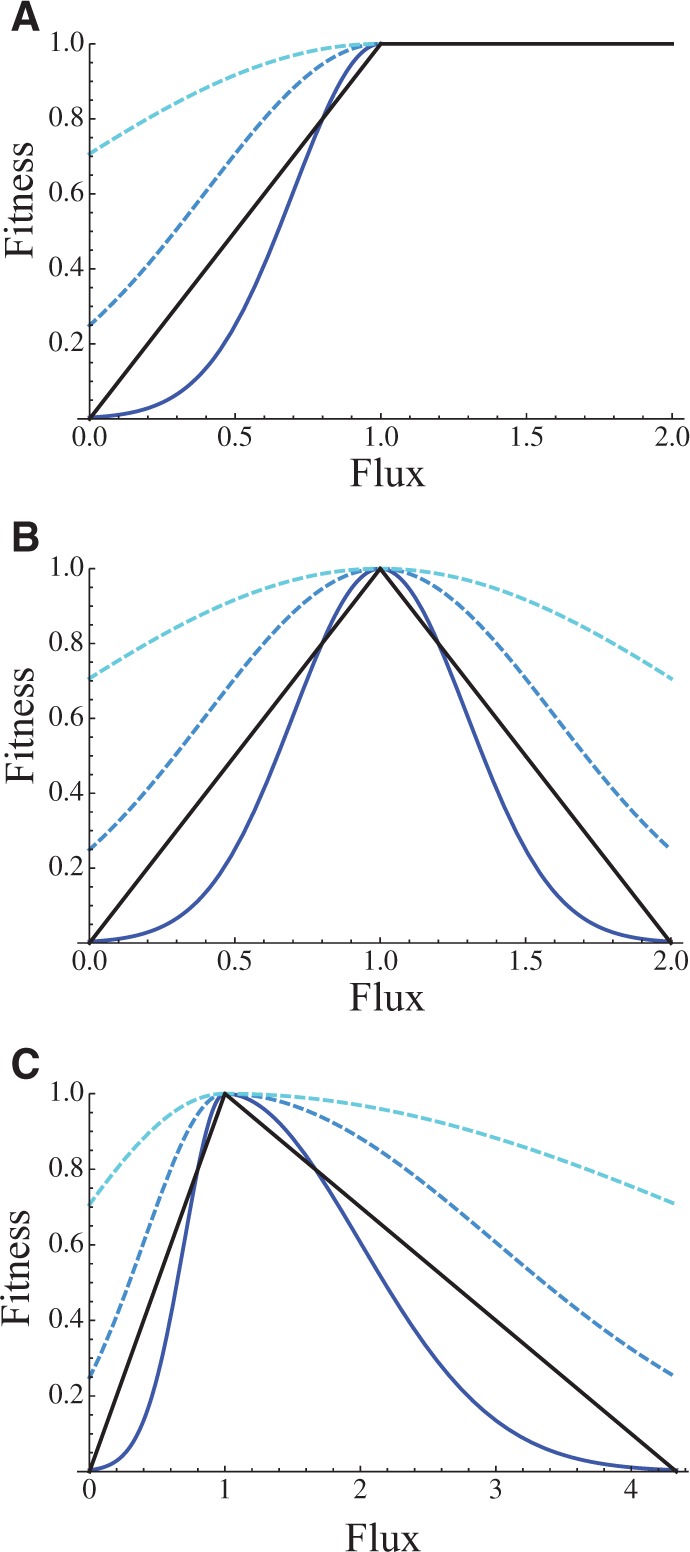
The relationship between flux and fitness under two models of fitness. Black curve is for linear fitness versus flux relationship (eq. 4), and bluish curves are for a Gaussian relationship (eq. 5), with σ = 0.3 (dark blue), 0.6 (intermediate blue), and 1.2 (light blue). (A) There is no cost (m = 0) to flux above the optimal level, which is set to 1. (B) The cost is maximal (m = 1), such that the fitness functions are symmetric around the optimal flux. (C) The cost is intermediate (m = 0.3).
A linear relationship between fitness and flux implies that a given reduction in flux causes an equal reduction in fitness. Such a relationship may apply for various catabolic pathways where each unit of flux translates into a unit of energy. One example of such a linear relationship between fitness and flux is lactose catabolism in Escherichia coli (Dykhuizen and Dean 1990). The linear relationship in this example is likely caused by fitness mapping linearly onto a trait (lactose catabolism), which itself maps linearly onto flux through the lactose utilization pathway. A linear relationship between fitness and flux, with unit slope, and a cost to flux above the optimum is captured in the following piecewise fitness function:
 |
(3) |
where
wL(F) is the fitness of a
genotype with relative flux F through the pathway. The first line on the
right hand side of equation (4) gives
the fitness when flux lies between 0 and the optimal flux ( ).
The second and third lines give the relationship between fitness and flux when flux is
above the optimal value.
).
The second and third lines give the relationship between fitness and flux when flux is
above the optimal value.
While some, and possibly most, traits may map linearly onto flux, fitness seldom maps linearly onto traits (Schluter 1988; Kingsolver et al. 2001). Instead, the fitness–trait relationship is often nonlinear and so the fitness–flux relationship will also be nonlinear. Accordingly, we consider a Gaussian relationship between flux and fitness. This relationship is commonly assumed in models of adaptation, including Fisher’s geometric model (Fisher 1930; Manna et al. 2011). Examples include birth weight in humans (Karn and Penrose 1952) and gall size produced by Eurosta solidaginis flies (Weis et al. 1992). One of the attributes of a Gaussian fitness function is a maximum at an intermediate trait value. Deviations from this intermediate, optimal trait value in either direction reduce fitness. Assuming the trait maps linearly onto flux, then the relationship between fitness and flux is
 |
(4) |
where wG(F) is the
fitness of a genotype with relative flux F through the pathway, σ
is a measure of the strength of stabilizing selection, with large σ indicting weak
selection, and  is the optimal flux through the pathway, at
which relative fitness is maximal (equal to 1). The Gaussian fitness function represented
in equation (4) implies zero flux
does not lead to zero fitness, though fitness may be very small depending on the strength
of selection, which is an appropriate assumption for nonessential genes. We note that the
standard, symmetric Gaussian fitness function corresponds to m =
1. For m < 1, the function is asymmetric (fig. 2).
is the optimal flux through the pathway, at
which relative fitness is maximal (equal to 1). The Gaussian fitness function represented
in equation (4) implies zero flux
does not lead to zero fitness, though fitness may be very small depending on the strength
of selection, which is an appropriate assumption for nonessential genes. We note that the
standard, symmetric Gaussian fitness function corresponds to m =
1. For m < 1, the function is asymmetric (fig. 2).
Mutation–Selection Balance
The frequency of the mutant allele at a gene on the neo-X will depend on whether the gene has been lost, is being lost, or is present on all copies of the neo-Y. If the gene is present on all copies of the Y, the equilibrium is the same as for an autosomal locus (assuming selection does not differ between the sexes). This equilibrium frequency, the classic mutation–selection balance, was first approximated by Haldane (1927). Consider a locus with two segregating alleles, wild-type allele A and mutant allele a, with directional selection against the a allele according to the fitness scheme shown in table 1. We assume that mutation occurs from the wild-type A allele to the hypomorphic, mutant allele a at rate µ, and that back mutation (from a to A) is negligible. The frequency of the mutant allele, qm, at equilibrium can be approximated as
| (5a) |
when wAa ≠ 1, that is, dominance is incomplete and
| (5b) |
when wAa = 1 (complete dominance), where the approximation ignores terms of order squared in the mutation rate. The approximation is valid when µ ≪ (1 − wAa) (eq. 5a) or µ ≪ (1 − waa) (eq. 5b). For many of the parameter combinations considered later, selection becomes very weak and approximations (5a) and (5b) are substantially inaccurate. For this reason, in all of our figures, we determine the equilibrium frequency by iterating recursions (detailed later), rather than using the approximations.
Equations (5a) and (5b) are derived under the assumption that the locus is autosomal. If the gene of interest has already been completely lost from the Y, such that it is a classic sex-linked locus, the equilibrium frequencies can also be derived. We calculate this equilibrium in the supplementary materials, Supplementary Material online. Depending on the timing of the evolution of DC, this equilibrium might be the relevant one when DC evolves.
To determine the equilibrium frequency of a deleterious allele, the mutation rate and selection coefficients need to be specified. The selection coefficients are obtained using the relationships between flux and enzyme concentration and between fitness and flux.
The Fitness Consequence of Hemizygosity
We have assumed that the enzyme concentration in the wild-type homozygote results in optimal flux through the pathway. However, even before the onset of hemizygosity, not every individual in a population will exhibit optimal flux because of segregating deleterious mutations. The average fitness of an individual male (or female) in a population before the loss of a gene from the neo-Y is simply the sum of the fitness of each genotype weighted by its genotype frequency:
| (6) |
where  is
the average fitness of male carrying two copies of the focal gene in the pathway,
x = L or G depending on the
fitness function, p and q are the A and
a allele frequencies at birth, and
FAa and Faa are the
fluxes through the pathway for genotypes Aa and
aa, respectively. The flux through the pathway for the
wild-type homozygote AA is 1, and its associated fitness is also 1. Using
equation (6), and enzyme
concentrations from table 1, the fluxes are
given by
is
the average fitness of male carrying two copies of the focal gene in the pathway,
x = L or G depending on the
fitness function, p and q are the A and
a allele frequencies at birth, and
FAa and Faa are the
fluxes through the pathway for genotypes Aa and
aa, respectively. The flux through the pathway for the
wild-type homozygote AA is 1, and its associated fitness is also 1. Using
equation (6), and enzyme
concentrations from table 1, the fluxes are
given by
| (7a) |
| (7b) |
When a gene is lost from the Y, hemizygous males will have altered flux and the following average fitness:
| (8) |
where  is the average fitness of a hemizygous male
carrying only one copy of the focal gene in the pathway, and
FA and Fa are the fluxes through
the pathway for genotypes A and a,
respectively. Using equation (8) and
enzyme concentrations from table 1, the
fluxes are
is the average fitness of a hemizygous male
carrying only one copy of the focal gene in the pathway, and
FA and Fa are the fluxes through
the pathway for genotypes A and a,
respectively. Using equation (8) and
enzyme concentrations from table 1, the
fluxes are
| (9a) |
| (9b) |
The
difference between the fitness of males with two copies versus one copy of the gene
encoding the focal enzyme is the fitness cost of hemizygosity. This cost, which is
calculated as  (eq. 6) minus
  (eq. 8), will be largest when the
first copy of the gene is lost because the equilibrium frequency of the deleterious allele
on the X is at its highest in this situation. After the focal gene has been lost from all
copies of the Y, the equilibrium frequency of the deleterious allele will be much lower
due to the action of selection, and the cost of hemizygosity will be at its minimum.
(eq. 8), will be largest when the
first copy of the gene is lost because the equilibrium frequency of the deleterious allele
on the X is at its highest in this situation. After the focal gene has been lost from all
copies of the Y, the equilibrium frequency of the deleterious allele will be much lower
due to the action of selection, and the cost of hemizygosity will be at its minimum.
To calculate the cost, we utilize the fitness function to calculate fitness coefficients
for each genotype, then iterate the full system of recursions (supplementary materials, Supplementary Material online) until the allele frequency reaches the
mutation–selection balance equilibrium (frequency change
<10−7 per generation). The equilibrium frequencies are
then used to determine the fitness difference,  ,
between a male possessing two copies of the focal gene and a male possessing only a single
copy:
,
between a male possessing two copies of the focal gene and a male possessing only a single
copy:
| (10) |
For the case of the linear fitness function, the reduction in fitness,
 , obtained from equation (10) using the estimated allele frequency is
| (11) |
where the approximation is accurate when μ ≪ (1 −
wAa). To obtain (11), we have assumed that the optimal flux,
 , which occurs at the wild-type homozygote
enzyme concentration, is equal to 1.
, which occurs at the wild-type homozygote
enzyme concentration, is equal to 1.
There are several patterns that are clear from equation (11). In the absence of mutation, the first term determines the loss in fitness due to hemizygosity and the reduction in fitness depends only on the number of steps in the pathway. This is an expected result because fitness is linearly related to flux (i.e., there are no other parameters except flux associated with fitness). This term decreases as the number of steps in a pathway increases (n larger), implying that halving concentration has a large effect on fitness in short pathways, but only a minor fitness effect in long pathways (fig. 3). In the shortest possible pathway, consisting of a single step, hemizygosity will cause a 50% reduction in fitness. In a long pathway, say 24 steps, the fitness reduction will only be 4%. The effect of deleterious alleles is captured in the second term of (11), and represents the effect of unmasking (as well as halving the dose) of deleterious alleles. This term is small, but increases with higher mutation rate, which increases the equilibrium frequency of the deleterious allele, and smaller Em, that is, a greater reduction in flux caused by the mutant allele, which increases the fitness effect of unmasking. As Em gets very small, this term approaches (n − 2)μ. As the number of steps in the pathway increases, the first term declines and the second increases. However, the relative size of the second term remains small compared with the first term, which dominates the effect of hemizygosity on fitness (fig. 3).
Fig. 3.—

Fitness decrease due to hemizygosity as a function of the length of the pathway. Dotted lines, μ = 0.0001; solid lines, μ = 0 (no hypomorphic mutations segregating in the population). Note for shortest pathways, the effects of mutation are negligible and thus dotted and solid lines are indistinguishable. Line color indicates fitness–flux relationship: black for linear and blue for Gaussian (with σ = 0.6). (A and B) Mutant allele produces 2% (Em = 0.02) as much enzyme as wild-type (per allele). (C and D) Mutant allele produces 10% (Em = 0.1) as much enzyme as wild-type (per allele). (E and F) Mutant allele produces 50% (Em = 0.5) as much enzyme as wild-type (per allele). (A, C, and E) Fitness reduction when the focal enzyme is in a short pathway (10 steps or less); (B, D, and E) for long pathways (15–25 steps). Note change in scale of y axis in two sets of panels. In long pathways, where the overall fitness decline is small, just a few percent in the examples shown, the effect of hypomorphic mutations is relatively large. For example in (B), well over half the reduction in fitness caused by hemizygosity can be attributed to hypomorphic mutations when the fitness–flux relationship is Gaussian (i.e., the dotted blue line, μ = 0.0001, is more than twice the value of the solid blue line, μ = 0). Allele frequency of deleterious mutation in males is equal to that expected under autosomal inheritance, and thus representing young sex chromosomes (see text for details).
In the case of the Gaussian fitness function, the reduction in fitness,
 , is obtained using the
estimated allele frequency in the same manner as in (11):
, is obtained using the
estimated allele frequency in the same manner as in (11):
 |
(12) |
A similar pattern to that seen for the linear fitness function is apparent in equation (12) in the absence of mutation. When μ = 0, the loss in fitness due to hemizygosity depends on the number of steps in the pathway and the parameter σ. The loss in fitness declines as the number of steps in a pathway increases (i.e., n gets larger), or as σ increases, which implies weaker stabilizing selection. The last term is the effect caused by deleterious mutations. It exhibits similar patterns as the linear fitness function: increasing with higher mutation rates, with more steps in the pathway, and with smaller fluxes caused by the mutant allele. The difference between this case and the linear fitness function is that the mutation term can be larger than the other terms on the right hand side of equation (12). This occurs when the fitness reduction in the absence of mutant alleles is small, that is, n and σ are both large (many steps and weak selection). This implies that deleterious mutations can contribute a substantial proportion of the fitness decline caused by hemizygosity. With a Gaussian fitness function, small changes in flux, as occur in a long pathway, can result in very small changes in fitness. The reason that mutations are relatively more important in this case is that the shape of the fitness function is concave around the optimum, and can be relatively flat if σ is large. For example, a 10% change in flux may cause an almost imperceptible change in fitness (fig. 2). This implies that the fitness effect of hemizygosity per se could be quite small if the strength of stabilizing selection is not strong, that is, if σ is not too small. In this situation, unmasking deleterious mutations can contribute a large fraction of the fitness cost of hemizygosity.
Similar patterns are seen for the rational and quadratic fitness functions (supplementary figs. S3 and S4, Supplementary Material online). Interestingly, the quadratic fitness function can cause fitness to be zero for reductions in flux that fall below a certain level, but which do not eliminate flux altogether. This situation of zero fitness with non-zero flux is most likely when selection is strong (narrow fitness function), and the metabolic pathway is short, such that halving the gene dose substantially reduces flux through the pathway. A situation in which halving gene dose causes zero fitness is equivalent to haploinsufficiency. Haploinsufficiency by definition represents the most extreme reduction in fitness that could be caused by halving gene dose.
In figure 3, we plot the expected fitness reduction in hemizygous males (=the cost of hemizygosity) as a function of the number of steps in a pathway for various parameter combinations under the two fitness models. In figure 4, we plot the effect of mutation rate on the fitness reduction due to hemizygosity with Gaussian fitness (σ = 0.6) in pathways of 15–25 steps. The curves in both figures are obtained using the actual, not the estimated, equilibrium allele frequencies. The important points illustrated in the figures are similar to insights gained from the approximations. 1) The reduction in fitness caused by hemizygosity for an enzymatic locus can be very small if the number of steps is large, regardless of the presence/absence of deleterious mutations (fig. 3B, D, and F). The reason is that flux does not decline very much with a 2-fold reduction in enzyme concentration when a pathway has many steps (fig. 1). 2) Deleterious mutations increase the reduction in fitness due to hemizygosity. Unmasking deleterious alleles will subject males to additional fitness costs above halving gene dose. 3) The relative effect of deleterious mutations is minimal when the absolute decline due to hemizygosity per se is large, but can be substantial if the overall decline is small. Because deleterious mutations are rare, their absolute effect on the average male is small. However, if the effect of halving gene dose for a wild-type allele is also small, then the effect of unmasking deleterious mutations can be relatively large. 4) Deleterious mutations play a larger role when the mutation rate is higher because they are more frequent at equilibrium (eq. 1 for example), which makes it more likely that they will be unmasked in a male. 5) Deleterious mutations are more likely to be a relatively important contributor to the cost of hemizygosity when the fitness function is nonlinear. The reason is that a nonlinear fitness function, if it is concave near the optimal flux, is more likely to result in weaker selection for the moderate reductions in flux caused by halving the dose of a wild-type allele.
Fig. 4.—

The effect of the rate of mutation on the fitness reduction due to hemizygosity with Gaussian fitness (σ = 0.6) in pathways of 15–25 steps. Hypomorphic mutation produces 2% as much gene product as wild-type, that is, Em = 0.02. Solid line is no mutation (μ = 0); short dashes is μ = 10−6, medium dashes is μ = 10−5, and long dashes is μ = 10−4 mutations per allele per generation. As the mutation rate declines to zero, the effect of hypomorphic mutations becomes negligible.
The calculated reduction in fitness can be used to estimate the rate of loss of functional loci from the neo-Y chromosome. We do this in the supplementary materials, Supplementary Material online, by calculating the probability of loss of a gene from the Y, which can then be multiplied by the product of mutation rate to loss-of-function alleles and population size to calculate a rate. The patterns we observe are as we would predict. When selection is strong (short pathways and linear fitness), the probability of fixation is essentially zero unless the effective population size of the Y is very small. In addition, segregating hypomorphic alleles are rare on the X and thus play a very minor role in reducing fixation probabilities on the Y (supplementary fig. S9, Supplementary Material online). However, when selection is weak (long pathways, Gaussian fitness), the probability of fixation can be substantially greater than zero, even in large populations and, in this case, segregating hypomoprhic mutations can play a large role in substantially reducing the probability of fixation of loss-of-function alleles on the Y (supplementary fig. S10, Supplementary Material online).
The Evolution of DC
We have determined the cost of hemizygosity under a variety of scenarios. We now determine the fitness consequences of increasing the dosage of a locus in a hemizygous male. In the absence of deleterious mutations, a 2-fold increase in expression (c = 2) will exactly compensate for the halving of gene dose in hemizygotes. However, if there are hypomorphic deleterious mutations present, the optimal level of compensation may be higher than 2-fold. If there is no cost of flux above the optimal flux (i.e., m = 0, fig. 2A), then the maximal fitness is obtained at a level that compensates for the reduced enzyme concentration in a hypomorphic hemizygote. For example, if the hypomorphic allele reduces concentration to 2% (i.e., Em = 0.02) of that produced by a wild-type allele, then a hemizygote for the hypomorphic allele will have 1% as much enzyme as a wild-type homozygote (table 1). In this case, maximal fitness will be reached once males increase allelic expression by 100-fold (i.e., c = 100). Higher expression will not increase fitness further, but also does not reduce fitness.
If there is a cost to excessive flux through a pathway (i.e., m ≠ 0),
then compensation above 2-fold is not always favored. We examined the optimal level of
compensation in hemizygous males by calculating the increase in fitness caused by
increasing allelic expression by an amount c (table 1), assuming a cost of excessive flux captured by the
parameter m (fig. 2). We
assume the cost is restricted to males, which is equivalent to assuming that changes in
expression are sex specific. If increased expression occurs in females as a result of
compensation evolving in males, as has been proposed in mammals for example (Payer and Lee 2008), then the cost of excessive
flux would be greater. Following equation
(10), we simply calculated the difference in fitness for a hemizygous male,
 , with and without DC:
| (13) |
where  is the average fitness of a hemizygous male exhibiting c-fold
compensation of the focal gene. A compensating male has fitness given by
is the average fitness of a hemizygous male exhibiting c-fold
compensation of the focal gene. A compensating male has fitness given by
| (14) |
where Fc*A and Fc*a are the fluxes through the pathway for genotypes A and a, respectively, in a compensating male. When c = 1, Fc*A = FA and Fc*a = Fa. In figure 5, we plot the fitness increase due to compensation as a function of the level of compensation for two parameter combinations under the two fitness models (supplementary figs. S5 and S6, Supplementary Material online, for the other two fitness functions). The curves shown are obtained using the actual, not the estimated, equilibrium allele frequencies, as before. The important patterns illustrated in figure 5 are the following. 1) In all situations, doubling dose (c = 2) causes an increase in fitness. In situations in which the cost of hemizygosity is high (short pathways, strong selection), doubling dose is sufficient to rescue the vast majority of fitness loss. Halving gene dose per se is thus an important component driving the evolution of DC. 2) Unless pathways are very short (a single step), any level of compensation is better than no compensation, that is, the fitness effect is positive for all c > 1. 3) Hypomorphic deleterious mutations increase the benefit of DC, though the absolute benefit is small because deleterious mutations are rare. 4) Hypomorphic mutations can cause a very high optimal level of DC when there are no fitness costs to excess flux. 5) Even with costs to excess flux, hypomorphic mutations can cause the optimal level of DC to be higher than 2-fold. This is more likely to occur when the absolute cost of hemizygosity is small (long pathways and weak selection), because increasing wild-type enzyme dose will have small effects on flux and small deleterious effects on fitness. For example, even in a relatively short pathway of 5 steps, a 100-fold increase in enzyme concentration only causes a 25% increase in flux through the pathway. In addition, optimal levels of DC are more likely to be higher than 2-fold if the deleterious allele is relatively common, that is, high mutation rate and weak selection (results not shown). 6) If there is a cost to increasing flux above the optimum (i.e., m > 0), the optimal level of DC is more likely to occur at c = 2 (e.g., fig. 5E–H and results not shown).
Fig. 5.—

Fitness increase as a function of DC in a hemizygous male. Dotted lines are for short pathways (length 5) and solid are for long pathways (length 25). Line color indicates fitness–flux relationship: black for linear, and blue for Gaussian (with σ = 0.6). Mutant allele produces 2% as much enzyme as wild-type allele, that is, Em = 0.02. (A–D) No cost to flux in excess of optimum (m = 0). (E–H) Cost to flux with m = 0.3 (fig. 2). (A and E) The gain in fitness for levels of DC (c) up to 110-fold. Other panels restrict the range of the x and/or y axes so that the shape of the curves can be seen. Points representing the level of DC that results in the highest possible fitness in males are shown by solid dots of matching color to the curves. In (A–D), these points occur at 100-fold compensation, which represents the level necessary to compensate for the hypomorphic mutation, if present. DC above this level gives the same fitness because there is no cost to overexpression. In curves (E–H), points are strict maxima, such that increased levels of DC reduce fitness.
In summary, wild-type alleles are important for the evolution of DC, but deleterious hypomorphic mutations can also play a major role in those situations where they represent significant contributors to the fitness cost of hemizygosity; that is, when they are common (high mutation rate and weak selection), and when the relative cost of halving gene dose for wild-type alleles is small (a long pathway and weak selection). When hypomorphic mutations cause a large reduction in fitness relative to the cost of hemizygosity, they will also exert selection for large values of DC, as long as costs of excess flux are not too great. The importance of this class of mutations for the evolution of DC is greatest early during the loss of a gene from the neo-Y chromosome. Later, as the locus is lost from a large percentage of the Y chromosomes in the population, the frequency of the deleterious allele on the X will decline towards the sex-linked equilibrium (which is substantially lower than the autosomal equilibrium; supplementary materials, Supplementary Material online), and the probability of carrying a hypomorphic allele will be substantially reduced. Thus, the effect of deleterious mutations on the evolution of DC will weaken as the Y degenerates.
Discussion
We have presented simple models to address the evolution of gene loss and DC in newly evolving sex chromosomes. There are several important results from our analyses. In general, we have shown there are effects due to halving gene dose per se, which are present even in the absence of deleterious alleles, and effects due to the unmasking of deleterious alleles. In this discussion, we present our main findings and discuss their implications, and specify the situations in which each of the effects (dosage versus unmasking) is likely to be important.
The Fitness Cost of Halving Gene Dose of Enzyme-Encoding Loci
Loss of genes from the Y chromosome reduces their dose in males, which lowers fitness. We have shown that for enzyme-encoding loci, this “peril of hemizygosity” (Ohno 1967) can be substantial. In very short pathways, halving enzyme concentration, as occurs in a hemizygous male, leads to a large reduction in flux through the pathway. If reduced flux causes a high fitness cost, the result is a large cost of hemizygosity. However, the cost associated with halving gene dose is substantially lessened when pathways are long, which reduces the reduction in flux through the pathway caused by halving enzyme concentration. In addition, if the fitness function is concave around the optimum, such that small reductions in flux cause vary small reductions in fitness, the cost of halving gene dose is also reduced.
These results make a very specific prediction regarding gene loss from a newly evolving Y chromosome. Genes in long pathways should be readily lost from the neo-Y, since selection preventing their loss will be weak. Thus, changes in dosage may represent a minor barrier to the evolution of a hemizygous X in males for genes in long pathways. Conversely, genes in short pathways should be initially protected from loss unless background selection is very strong, or the population size is quite small, such that Muller’s ratchet can advance more readily. In a large population, it is unlikely that the ratchet will be able to cause loss of genes in short pathways from the neo-Y because selection preventing loss is too strong, which would essentially bring the ratchet to a halt (Charlesworth 1996b; Gordo and Charlesworth 2000, 2001).
Unfortunately, to the best of our knowledge, data with explicit links to pathway length are not available for genes lost from the Y. Although there is an abundance of work on gene networks, we are unable to find rigorous work equating network theory with metabolic control theory, making extrapolations between the two paradigms challenging. However, we can make some inferences from the genomic data that are available for neo-Y chromosomes in a variety of Drosophila species. Consistent with our predictions, loss of genes from the Y is nonrandom (at least in Drosophila miranda; Kaiser et al. 2011). In particular, genes that are highly expressed are retained longer on the Y. Interestingly, “connectivity”—an estimate of the number of partners with which a gene interacts—is completely confounded with transcript abundance, such that the two cannot be evaluated separately. Certainly it has been well established that genes with high connectivity such as hub genes are less likely to be lost during the evolution of sex chromosomes (He and Zhang 2006; Veitia 2002; Veitia et al. 2008). Genes expressed in more tissues are also more likely to be retained than genes expressed in fewer tissues.
The Evolution of DC in Response to Halving Gene Dose
Perhaps, the most surprising result from our analysis is that for loci that encode genes in pathways of two or more steps, any level of DC is better than none, even when costs of increased flux are high. The reason is that even large increases in enzyme concentration cause only minor increases in flux in pathways that are more than a couple of steps. Minor increases in flux do not cause very large changes in fitness relative to the reduction in fitness caused by the reduction in flux due to halving gene dose. This result predicts that DC of genes on the X during early Y chromosome degradation could be essentially any level, from rather small increases in expression, to increases of many folds. We note that if the relationship between fitness and flux is such that fitness costs of minor increases in flux are substantial, for example, if threshold selection causes fitness above the optimal flux to be zero, then this result would no longer hold. However, such fitness functions seem unrealistic.
Though any level of DC is favored relative to no compensation, the optimal level of DC in response to halving gene dose is, of course, 2-fold. We thus predict that over time compensation will evolve such that males exhibit this level of DC. Generally the slope of fitness as a function of compensation is such that the selection gradient is stronger for compensation below 2-fold and weaker for compensation above 2-fold. Thus, if the optimal level of DC has not yet been reached, we expect more genes will show DC above 2-fold than below. Indeed, uncountered female hyperexpression as a result of DC has been proposed to explain widespread female biased genes on the X in Tribolium castaneum (Prince et al. 2010), and might serve as an alternate explanation of female-biased genes on the X in Drosophila and other taxa. High variance in expression across X-linked loci may thus be common, especially early during X chromosome evolution.
The Evolution of DC in Response to Hypomorphic Mutations
Loss of genes from the Y chromosome also unmasks deleterious alleles. The absolute fitness cost of this unmasking is small, because the equilibrium frequency of deleterious alleles is small. However, when the fitness cost of halving gene dose per se is small, that is, when pathways are long and selection is weak, deleterious mutations can contribute a substantial proportion of the total fitness cost. This cost will be largest at the very beginning of the loss of a gene from the Y chromosome. Following initial loss, the equilibrium frequency of the deleterious allele will decline and approach the sex-linked equilibrium, and so the fitness cost (and hence selective pressure) of deleterious alleles will decline as well. Initially, however, the presence of hypomorphic mutations during gene loss can cause optimal levels of DC to be substantially greater than 2-fold. This will occur in situations in which the cost of excessive flux is reasonably small, and the contribution of the unmasking of deleterious mutations to reductions in fitness due to hemizygosity is high. Though the optimum can be at very high levels of compensation, the marginal benefit of additional expression declines rapidly for levels of expression above several folds, that is, the selection gradient at very high levels of compensation becomes quite shallow. Moreover, if there is a cost of increased dosage beyond what we have incorporated into our model, such as a literal cost of transcription, the optimal level of DC might be pushed downwards. Regardless, as more copies of a gene are lost from the population of neo-Ys, the frequency of the hypomorphic deleterious allele will decline, which will reduce the strength of selection acting on increased compensation. This means that the optimal level of compensation might initially be much higher than 2-fold but will approach 2-fold as genes become lost from all copies of the Y.
The Relationship between Fitness and Flux
The nature of the relationship between fitness and flux plays a major role in our models, particularly with respect to whether deleterious mutations will be important in preventing gene loss or in the evolution of DC. If the relationship between fitness and flux is linear near the optimum level of flux, then deleterious mutations will play a reduced role. In addition, a linear fitness-flux relationship causes genes in shorter pathways to pay a major cost of halving gene dose, making it very unlikely that they would be lost prior to the evolution of DC (discussed later).
Although there is a very little if any work directly examining the relationship between fitness and flux in eukaryotes, we believe that nonlinear fitness–flux relationships are likely common. The observation of high heritability for most traits suggests that selection on these traits is not too strong, which implies a concave fitness function around the optimum. Stabilizing selection with a linear fitness function (fig. 2B and C) would rapidly remove genetic variance, leaving only mutational variance inputted each generation to contribute to heritability.
Loss of Other Types of Genes
In our model, we have attempted to capture the expected behavior of genes that catalyze steps in metabolic pathways. There are of course many genes that do not fit this category, and there are pathways that do not behave in a manner consistent with the Kacser and Burns derivation. For example, there are metabolic pathways, sometimes involving many steps, in which a single step is rate-limiting. The enzyme phenylalanine ammonia-lyase in the first step of phenylpropanoid synthesis in tobacco is one example (Bate et al. 1994). In such pathways, the genes encoding the nonrate-limiting enzymes would behave as if they were in extremely long pathways because changes in their dose would not alter flux. In contrast, the gene encoding the enzyme catalyzing the rate-limiting step would behave as if it were in a single-step pathway. The models we present can thus handle these situations as long as the enzyme kinetics and flux relationships are understood. However, these types of pathways will add noise to the pattern between pathway length and timing of gene loss from the neo-Y, which will make testing this prediction more difficult.
Some genes that are lost from the Y do not encode monomeric or homopolymeric enzymes. For example, some might encode subunits of protein complexes. Such heteropolymers are expected to be more likely to exhibit problems with changes in dosage because of the stoichiometric relationship among subunits. If a gene on a neo-Y chromosome encodes one subunit of a dimeric transcription factor that can exist as either a homo- or heterodimer, then halving the dose of one subunit may cause large functional effects (Veitia 2002; Veitia et al. 2008). For these types of genes, we expect loss from the Y to be prevented by selection until after the evolution of regional or global compensation that is close to 2-fold (see below).
Kacser and Burns’ (1981) metabolic theory was originally advanced as an explanation for dominance at enzyme-encoding loci. The theory explains the negative relationship between effect size when homozygous and degree of dominance, that is, highly deleterious mutations tend to be highly recessive. However, work utilizing the yeast deletion strains indicates that the relationship between effect size and dominance holds for essentially all types of loci in the genome, not just enzyme-encoding loci (Phadnis and Fry 2005). This work suggests that the curve captured by Kacser and Burns may apply to the majority of loci in a genome, which would mean that most loci would behave as if they were in long (or short but non-linear) metabolic pathways. Thus, the strength of selection acting against gene loss from the neo-Y would be quite weak for most loci. DC may thus have evolved in response to weak selection pressures, or to strong selection at only a handful of loci.
Local versus Global DC
We predict that many genes are protected from loss from the neo-Y prior to the evolution of DC. These genes may be in short pathways, or have extreme dosage sensitivity for other reasons (see previous section). In order for the evolution of compensation to facilitate the loss of these genes, DC cannot be a purely locally acting phenomenon (i.e., cis changes to the promoter of a particular gene). Although changes in gene expression are often gene specific, such as transcriptional regulation changes in a promoter, or stabilization of mRNA through mutation of a decay signal, other effects can be more widespread, acting regionally or even globally. Regional or global changes might include production of trans-acting enhancers, alterations in chromatin state, or removal of insulators. For example, accumulation of transposable elements (commonly observed on degenerate Y chromosomes) may directly affect transcription on both local and global scales (Kaiser and Bachtrog 2010), or even across the genome (Gowen and Gay 1934; Lemos et al. 2008). DC that acts regionally, regardless of mechanistic details, will facilitate the loss of genes, including those that cause relatively large changes in fitness with changes in dose.
In organisms where regional or global expression changes are rare, the evolution of gene loss from the Y will be extremely slow or not possible for those genes exhibiting dosage sensitivity such as those in short pathways. Indeed, it has been pointed out before that during Y-chromosome degradation the accumulation of mildly deleterious mutations at many loci is likely to lead to global DC, while accumulation of mutations of large effect at only a few loci is likely to cause local DC (Vicoso and Bachtrog 2009). In the absence of regional compensation, we expect that the gene content of Y chromosomes will be relatively close to that of the X, because Y chromosomes will contain a set of genes that are very difficult to lose.
Mammalian X-Inactivation and DC
Eutherian mammals have been thought to have a particularly baroque form of DC: upregulation of the X in both sexes, followed by silencing of a random copy in females (Lyon 1961; Nguyen and Disteche 2006). Though there is no doubt that X inactivation occurs, recent data challenges the existence of DC in mammals, in the sense of balancing expression between males and females via increased expression of X-linked genes (Xiong et al. 2010; Birchler 2012; Lin et al. 2012). Thus, although there is an abundance of spirited discussion over these analyses and results, they suggest that upregulation of the X may not exist outside Drosophila. However, all agree that some genes are always upregulated and that these genes are by definition peculiarly sensitive to dose, such as those involved in large protein complexes including both X and autosomal gene products (Lin et al. 2012; Pessia et al. 2012). Other examples would include the “hub” genes, or genes with high connectivity (Veitia 2002; He and Zhang 2006; Veitia et al. 2008), as mentioned previously. Interestingly, X inactivation may well have preceded upregulation of these genes (Pessia et al. 2012). It has been argued that these data suggest that another explanation for X inactivation must be sought (Lin et al. 2012).
Should Xiong et al. (2010) and Lin et al. (2012) prove correct, our model may be able to explain this pattern. Their data show a general trend toward 50% expression of X-linked genes in both males and females, compared with the same genes in species where these genes have remained autosomal (Lin et al. 2012). This suggests that most X-linked genes are insensitive to dose, that is, exist as steps in long pathways, and affecting traits with shallow, concave fitness functions. This result is consistent with the observation of generally minor effects of heterozygosity for null alleles discussed earlier (Phadnis and Fry 2005). However, there are 5% or so genes on the X that do exhibit increased expression in males, such that expression has not been reduced relative to the ancestral level (Lin et al. 2012). These genes may be the ones that are driving the silencing of the X in females. If so, they would be upregulated in males during loss from the neo-Y because they are dose sensitive, that is, we would predict that they are contained in short pathways affecting traits with steeper fitness functions. Inactivation in females would evolve subsequent to male upregulation, to offset the (small) costs of overexpression.
Steps in Sex Chromosome Evolution
As discussed earlier, genes in short pathways should be protected against loss from the Y chromosome. However, Y chromosomes essentially fully degrade, implying that all genes will eventually be lost. To mitigate the cost of hemizygosity, it seems clear that DC must evolve. As is discussed earlier, the level of DC does not have to be exactly 2-fold: there is a wide range of levels of compensation that substantially reduce the cost of gene loss (fig. 5).
We thus predict that in newly evolving sex chromosomes, evolution will follow a predictable pattern after reduction of recombination. First, genes in long but not short pathways will be lost as a result of background selection and Muller’s ratchet. Deleterious alleles will reduce the rate at which genes are lost, such that genes with lower frequencies of segregating deleterious alleles, that is, those under higher selective constraint, are more likely to be lost early. In addition, genes producing products that affect traits undergoing nonlinear selection, specifically with concave fitness functions around the optimum, are more likely to be lost early.
Next, loss of genes from the Y will lead to selection for DC, but initially the level of compensation is unlikely to evolve to be exactly 2-fold, because any level of compensation will be favored by selection, and the optimal level may be greater than 2-fold if hypomorphic mutations are segregating. Indeed, this very pattern is seen in the plant Silene latifolia, which has uniquely young sex chromosomes wholly derived from autosomes as opposed to representing new sex chromosome−autosome fusions, as is the case for young sex chromosomes in Drosophila. For genes whose Y-linked alleles show signs of degeneration relative to the X-linked allele (i.e., are expressed at less than half the total of the two X alleles in the female), the majority are expressed at less than 2-fold (the equivalent expression from two female Xs), but a sizeable fraction are expressed greater than 2-fold (Muyle et al. 2012). It is, however, impossible to distinguish male-biased gene expression from overly vigorous DC, as the authors point out (Muyle et al. 2012).
Finally, once DC has evolved, it will reduce the cost of loss of genes in short pathways if the effects of expression change extend to these loci. As more copies of Y chromosomes lose a gene, the optimal level of DC will be closer to 2-fold, because hypomorphic deleterious alleles will become rarer. Finally, as more genes are lost, a global mechanism of DC may evolve. If chromosome-wide DC evolves, there will be only very weak selection, through the unmasking of deleterious alleles, preventing further gene loss, and loss of the remaining genes will accelerate, as suggested previously by Engelstadter (2008). Data from a recent study in S. latifolia are consistent with near simultaneous degeneration of the Y and evolution of DC (Muyle et al. 2012).
Bachtrog (2008) has also suggested a multi-step model for Y degeneration, beginning with Muller’s ratchet and background selection while the Y is still gene rich; later, when gene number has begun to decline, she suggests that decay is more likely to be due to selective sweeps carrying along deleterious mutations. Both our model and Bachtrog’s predict acceleration of gene loss later in the life of a young Y, but for very different reasons (we consider pathway membership, rather than different selective mechanisms; discussed earlier). However, in contrast to the model presented here, Bachtrog’s simulations involved only de novo mutation on the Y rather than pre-existing load under sex chromosome mutation–selection balance; nor did she consider the evolution of DC per se. The two models are thus complementary; exploring their intersection would be an interesting future direction.
Multistep evolution of sex chromosomes has been observed via the existence of so-called evolutionary strata, or regions of the X chromosome in humans (Lahn and Page 1999; Carrel and Willard 2005) showing evidence of different levels of degeneration. These patterns have been thought to represent the signature of cessation of recombination from smaller to larger regions after an autosome becomes a sex chromosome. Recombination is expected to stop first in the immediate vicinity of a canonical sex-determining site, and then expand as sexually antagonistic alleles accumulate on the sex chromosomes, such that linkage disequilibrium between these alleles and the sex-determining region becomes favorable (Bull 1983; Charlesworth 1996b), as discussed in the Introduction. Such strata might also be the result of an existing Y chromosome fusing with a new, autosomal element containing sexually antagonistic alleles (Charlesworth D and Charlesworth B 1980) to create a neo-Y (cf. Ross et al. 2009), perhaps multiple times. Again, one would expect linkage disequilibrium between the ancient and neo-Y to be selectively favored, and that recombination would cease on the neo-Y shortly after its fusion. Regardless, if degeneration of the Y is stratified, then DC should then also evolve in a stratified manner, as larger and larger regions of the X would be subject to hemizygosity. Such stratification might be expected to result in the evolution of regions of global DC, rather than piecemeal (gene by gene) DC. Some have argued that S. latifolia shows no evidence of such strata (but see Nicolas et al. 2005); the apparent absence of strata may be due to lack of power to distinguish signal from noise (Chibalina and Filatov 2011). However, the species does have DC (Muyle et al. 2012).
As genome annotation continues to improve, and it is possible to characterize more and more genes in terms of pathway length, we look forward to explicit tests of the three-step model we propose. Further contrasts of new sex chromosomes with older ones will also be useful. Finally, associating network theory with metabolic control theory remains challenging but essential to understanding any area of expression evolution, given that the preponderance of genetic systems analysis focuses on this area.
Supplementary Material
Supplementary materials and figures S1–S11 are available at Genome Biology and Evolution online (http://www.gbe.oxfordjournals.org/).
Acknowledgments
The authors thank the anonymous reviewers and the editors for suggestions that improved the manuscript, and they also thank C.F. Baer, J.J. Bull, J. Chojnowski, L.E. Gilbert, S. Hedtke, T. Keller, M. Kirkpatrick, and S.V. Nuzhdin for helpful discussion. This work was supported by the National Institutes of Health grant R01 GM077618 to M.L.W. Publication of this article was funded in part by the University of Florida Open Access Publishing Fund.
Literature Cited
- Bachtrog D. The temporal dynamics of processes underlying Y chromosome degeneration. Genetics. 2008;179:1513–1525. doi: 10.1534/genetics.107.084012. [DOI] [PMC free article] [PubMed] [Google Scholar]
- Bachtrog D, et al. Are all sex chromosomes created equal? Trends Genet. 2011;27:350–357. doi: 10.1016/j.tig.2011.05.005. [DOI] [PubMed] [Google Scholar]
- Bate NJ, et al. Quantitative relationship between phenylalanine ammonia-lyase levels and phenylpropanoid accumulation in transgenic tobacco identifies a rate-determining step in natural product synthesis. Proc Natl Acad Sci U S A. 1994;91:7608–7612. doi: 10.1073/pnas.91.16.7608. [DOI] [PMC free article] [PubMed] [Google Scholar]
- Birchler JA. Claims and counterclaims of X-chromosome compensation. Nat Struct Mol Biol. 2012;19:3–5. doi: 10.1038/nsmb.2218. [DOI] [PubMed] [Google Scholar]
- Bull JJ. Evolution of sex determining mechanisms. Menlo Park (CA): Benjamin Cummings; 1983. [Google Scholar]
- Carrel L, Willard FH. X-inactivation profile reveals extensive variability in X-linked gene expression in females. Nature. 2005;434:400–404. doi: 10.1038/nature03479. [DOI] [PubMed] [Google Scholar]
- Carvalho AB. Origin and evolution of the Drosophila Y chromosome. Curr Opin Genet Dev. 2002;12:664–668. doi: 10.1016/s0959-437x(02)00356-8. [DOI] [PubMed] [Google Scholar]
- Carvalho AB, Koerich LB, Clark GA. Origin and evolution of Y chromosomes: Drosophila tales. Trends Genet. 2009;25:270–277. doi: 10.1016/j.tig.2009.04.002. [DOI] [PMC free article] [PubMed] [Google Scholar]
- Charlesworth B. Background selection and patterns of genetic diversity in Drosophila. Genet Res. 1996a;68:131–149. doi: 10.1017/s0016672300034029. [DOI] [PubMed] [Google Scholar]
- Charlesworth B. The evolution of chromosomal sex determination and dosage compensation. Curr Biol. 1996b;6:149–162. doi: 10.1016/s0960-9822(02)00448-7. [DOI] [PubMed] [Google Scholar]
- Charlesworth B, Charlesworth D. The degeneration of Y chromosomes. Philos Trans R Soc London B Biol Sci. 2000;355:1563–1572. doi: 10.1098/rstb.2000.0717. [DOI] [PMC free article] [PubMed] [Google Scholar]
- Charlesworth D, Charlesworth B. Sex-differences in fitness and selection for centric fusions between sex-chromosomes and autosomes. Genet Res. 1980;35:205–214. doi: 10.1017/s0016672300014051. [DOI] [PubMed] [Google Scholar]
- Chibalina MV, Filatov AD. Plant Y chromosome degeneration is retarded by haploid purifying selection. Curr Biol. 2011;21:1475–1479. doi: 10.1016/j.cub.2011.07.045. [DOI] [PubMed] [Google Scholar]
- Dykhuizen DE, Dean MA. Enzyme-activity and fitness—evolution in solution. Trends Ecol Evol. 1990;5:257–262. doi: 10.1016/0169-5347(90)90067-N. [DOI] [PubMed] [Google Scholar]
- Engelstadter J. Muller’s ratchet and the degeneration of Y chromosomes: a simulation study. Genetics. 2008;180:957–967. doi: 10.1534/genetics.108.092379. [DOI] [PMC free article] [PubMed] [Google Scholar]
- Fisher RA. The genetical theory of natural selection. Oxford: Oxford University Press; 1930. [Google Scholar]
- Fisher RA. The sheltering of lethals. Am Nat. 1935;69:446–455. [Google Scholar]
- Gordo I, Charlesworth B. On the speed of Muller’s ratchet. Genetics. 2000;156:2137–2140. doi: 10.1093/genetics/156.4.2137. [DOI] [PMC free article] [PubMed] [Google Scholar]
- Gordo I, Charlesworth B. The speed of Muller’s ratchet with background selection, and the degeneration of Y chromosomes. Genet Res. 2001;78:149–161. doi: 10.1017/s0016672301005213. [DOI] [PubMed] [Google Scholar]
- Gowen JW, Gay HE. Chromosome constitution and behavior in eversporting and mottling in Drosophila melanogaster. Genetics. 1934;19:0189–0208. doi: 10.1093/genetics/19.3.189. [DOI] [PMC free article] [PubMed] [Google Scholar]
- Haldane JBS. A mathematical theory of natural and artificial selection. Part V. Selection and mutation. Proc Cambridge Philos Soc. 1927;23:838–844. [Google Scholar]
- He XL, Zhang JZ. Why do hubs tend to be essential in protein networks? PLoS Genet. 2006;2:826–834. doi: 10.1371/journal.pgen.0020088. [DOI] [PMC free article] [PubMed] [Google Scholar]
- Kacser H, Burns AJ. The molecular basis of dominance. Genetics. 1981;97:639–666. doi: 10.1093/genetics/97.3-4.639. [DOI] [PMC free article] [PubMed] [Google Scholar]
- Kaiser VB, Bachtrog D. Evolution of sex shromosomes in insects. In: Campbell A, Lichten M, Schupbach G, editors. Annual review of genetics. Vol. 44. Palo Alto (CA): Annual Reviews; 2010. pp. 91–112. [DOI] [PMC free article] [PubMed] [Google Scholar]
- Kaiser VB, Zhou Q, Bachtrog D. Nonrandom gene loss from the Drosophila miranda neo-Y chromosome. Genome Biol Evol. 2011;3:1329–1337. doi: 10.1093/gbe/evr103. [DOI] [PMC free article] [PubMed] [Google Scholar]
- Karn M, Penrose SL. Birth weight and gestation time in relation to maternal age, parity, and infant survival. Ann Eugen. 1952;16:147–164. [PubMed] [Google Scholar]
- Kingsolver JG, et al. The strength of phenotypic selection in natural populations. Am Nat. 2001;157:245–261. doi: 10.1086/319193. [DOI] [PubMed] [Google Scholar]
- Kondrashov AS, Crow FJ. Haploidy or diploidy: which is better? Nature. 1991;351:314–315. doi: 10.1038/351314a0. [DOI] [PubMed] [Google Scholar]
- Lahn BT, Page CD. Four evolutionary strata on the human X chromosome. Science. 1999;286:964–967. doi: 10.1126/science.286.5441.964. [DOI] [PubMed] [Google Scholar]
- Lemos B, Araripe LO, Hartl LD. Polymorphic Y chromosomes harbor cryptic variation with manifold functional consequences. Science. 2008;319:91–93. doi: 10.1126/science.1148861. [DOI] [PubMed] [Google Scholar]
- Lin F, Xing K, Zhang J, He X. Expression reduction in mammalian X chromosome evolution refutes Ohno’s hypothesis of dosage compensation. Proc Natl Acad Sci U S A. 2012;109:11752–11757. doi: 10.1073/pnas.1201816109. [DOI] [PMC free article] [PubMed] [Google Scholar]
- Lyon MF. Gene action in X-chromosome of mouse (Mus Musculus L) Nature. 1961;190:372–373. doi: 10.1038/190372a0. [DOI] [PubMed] [Google Scholar]
- Manna F, Martin G, Lenormand T. Fitness landscapes: an alternative theory for the dominance of mutation. Genetics. 2011;189:923–U303. doi: 10.1534/genetics.111.132944. [DOI] [PMC free article] [PubMed] [Google Scholar]
- Muyle A, et al. Rapid de novo evolution of X chromosome dosage compensation in Silene latifolia, a plant with young sex chromosomes. PLoS Biol. 2012;10:8. doi: 10.1371/journal.pbio.1001308. [DOI] [PMC free article] [PubMed] [Google Scholar]
- Muller HJ. Genetic variability, twin hybrids, and constant hybrids, in a case of balanced lethal factors. Genetics. 1918;3:422–499. doi: 10.1093/genetics/3.5.422. [DOI] [PMC free article] [PubMed] [Google Scholar]
- Nguyen DK, Disteche MC. Dosage compensation of the active X chromosome in mammals. Nat Genet. 2006;38:47–53. doi: 10.1038/ng1705. [DOI] [PubMed] [Google Scholar]
- Nicolas M, et al. A gradual process of recombination restriction in the evolutionary history of the sex chromosomes in dioecious plants. PLoS Biol. 2005;3:47––56. doi: 10.1371/journal.pbio.0030004. [DOI] [PMC free article] [PubMed] [Google Scholar]
- Ohno S. Sex chromosomes and sex-linked genes. New York: Springer-Verlag; 1967. [Google Scholar]
- Payer B, Lee TJ. X chromosome dosage compensation: how mammals keep the balance. Annu Rev Genet. 2008;42:733–772. doi: 10.1146/annurev.genet.42.110807.091711. [DOI] [PubMed] [Google Scholar]
- Pessia E, et al. Mammalian X chromosome inactivation evolved as a dosage-compensation mechanism for dosage-sensitive genes on the X chromosome. Proc Natl Acad Sci U S A. 2012;109:5346–5351. doi: 10.1073/pnas.1116763109. [DOI] [PMC free article] [PubMed] [Google Scholar]
- Phadnis N, Fry DJ. Widespread correlations between dominance and homozygous effects of mutations: implications for theories of dominance. Genetics. 2005;171:385–392. doi: 10.1534/genetics.104.039016. [DOI] [PMC free article] [PubMed] [Google Scholar]
- Prince EG, Kirkland D, Demuth JP. Hyperexpression of the X chromosome in both sexes results in extensive female bias of X-linked genes in the flour beetle. Genome Biol Evol. 2010;2:336–346. doi: 10.1093/gbe/evq024. [DOI] [PMC free article] [PubMed] [Google Scholar]
- Rosenzweig RF. Regulation of fitness in yeast overexpressing glycolytic-enzymes—parameters of growth and viability. Genet Res. 1992a;59:35–48. doi: 10.1017/s0016672300030159. [DOI] [PubMed] [Google Scholar]
- Rosenzweig RF. Regulation of fitness in yeast overexpressing glycolytic-enzymes—responses to heat-shock and nitrogen starvation. Genet Res. 1992b;59:167–177. doi: 10.1017/s0016672300030445. [DOI] [PubMed] [Google Scholar]
- Ross JA, Urton JR, Boland J, Shapiro MD, Peichel LC. Turnover of sex chromosomes in the stickleback fishes (Gasterosteidae) PLoS Genet. 2009;5:e1000391. doi: 10.1371/journal.pgen.1000391. [DOI] [PMC free article] [PubMed] [Google Scholar]
- Schluter D. Estimating the form of natural selection on a quantitative trait. Evolution. 1988;42:849–861. doi: 10.1111/j.1558-5646.1988.tb02507.x. [DOI] [PubMed] [Google Scholar]
- Sopko R, et al. Mapping pathways and phenotypes by systematic gene overexpression. Mol Cell. 2006;21:319–330. doi: 10.1016/j.molcel.2005.12.011. [DOI] [PubMed] [Google Scholar]
- Veitia RA. Exploring the etiology of haploinsufficiency. Bioessays. 2002;24:175–184. doi: 10.1002/bies.10023. [DOI] [PubMed] [Google Scholar]
- Veitia RA, Bottani S, Birchler AJ. Cellular reactions to gene dosage imbalance: genomic, transcriptomic and proteomic effects. Trends Genet. 2008;24:390–397. doi: 10.1016/j.tig.2008.05.005. [DOI] [PubMed] [Google Scholar]
- Vicoso B, Bachtrog D. Progress and prospects toward our understanding of the evolution of dosage compensation. Chromosome Res. 2009;17:585–602. doi: 10.1007/s10577-009-9053-y. [DOI] [PMC free article] [PubMed] [Google Scholar]
- Weis AE, Abrahamson WG, Andersen CM. Variable selection on eurostas gall size.1. The extent and nature of variation in phenotypic selection. Evolution. 1992;46:1674–1697. doi: 10.1111/j.1558-5646.1992.tb01161.x. [DOI] [PubMed] [Google Scholar]
- Xiong YY, et al. RNA sequencing shows no dosage compensation of the active X-chromosome. Nat Genet. 2010;42:1043–1047. doi: 10.1038/ng.711. [DOI] [PubMed] [Google Scholar]
- Yoshikawa K, et al. Comprehensive phenotypic analysis of single-gene deletion and overexpression strains of Saccharomyces cerevisiae. Yeast. 2011;28:349–361. doi: 10.1002/yea.1843. [DOI] [PubMed] [Google Scholar]
Associated Data
This section collects any data citations, data availability statements, or supplementary materials included in this article.