Abstract
In vivo dosimetry was carried out for 152 patients receiving external beam radiotherapy and the treatment sites were divided into two main groups: Thorax, Abdomen, and Pelvic (120 fields) and Head and Neck (52 fields). Combined entrance and exit dose measurements were performed using LiF: Mg, Cu, P thermoluminescent dosimeters (TLDs). Water-equivalent (effective) thicknesses and target dose were evaluated using dose transmission data. The ratio of measured to expected value for each quantity was considered as an indicator for the accuracy of the parameter. The average ratio of the entrance dose was evaluated as 1.01 ± 0.07. In the diameter measurement, the mean ratio of effective depth divided by the contour depth is 1.00 ± 0.13 that shows a wide distribution which reflects the influence of contour inaccuracies as well as tissue inhomogeneities. At the target level, the mean ratio of measured to the prescribed dose is 1.00 ± 0.07. According to our findings, the difference between effective depth and patient depth has a direct relation to target dose discrepancies. There are some inevitable sources which may cause the difference. Evaluation and application of effective diameter in treatment calculations would lead to a more reliable target dose, especially for fields which involve Thorax, Abdomen, and Pelvic.
Keywords: External beam radiotherapy, in vivo do simetry, target dose, thermoluminescent dosimetry
Introduction
In radiotherapy, there is a close relationship between the probability of local tumor control and normal tissue injury with the actual delivered dose.[1,2] Therefore, it is vital to control the procedure to find weak points and to limit discrepancies as much as possible. An effective approach for this purpose is in vivo dosimetry programs.[3–9] One of the most common dosimeters used in such programs is thermoluminescent dosimeter (TLD). High spatial resolution and sensitivity, as well as small dependence on dose rate, temperature, and energy have made its application very popular.[10] The main advantage of TLDs is that they are not attached to bias voltage and electrometer;[11–14] however, they are passive dosimeters and their answer is not immediate. In vivo dosimetry is available in different levels like entrance dose, exit dose, and intracavity dose measurement and determination of the dose delivered to critical organs. The entrance dose serves to check the output and performance of the treatment device, accuracy of patient set-ups, and the treatment calculation. The exit dose value is used in addition to evaluate uncertainties related to patient data such as contour errors and tissue inhomogeneities, as well as the algorithm in treatment planning system.[2,11,15]
The golden goal of dosimetry is the assessment of exact and accurate value of the target dose. It is almost impossible to put dosimeter inside the target. Then physicists just try to find out the real target dose as accurate as possible.
This study is the first-quality assurance program of its kind that has been carried out in our center in which target dose was evaluated based on water-equivalent (effective) diameter. Water-equivalent diameter of patients was evaluated in order to be compared with the actual contour diameter to investigate the influence of the corresponding difference on delivered dose to the target. Furthermore, the performance of LiF: Mg, Cu, P [LiF (MCP)] chips and TLD system has been investigated under our clinical condition.
Materials and Methods
Clinical measurements
Since majority of patients in our center are given treatment in source axis distance (SAD) condition, this study was focused on this technique where generally dose is given to the midline.
For each treatment field, both the entrance and exit doses were measured. A batch of three TLDs inside a badge covered by 5-mm build-up material was placed on the surface perpendicular to the beam central axis at each measuring point. To avoid the shadow effect, either the entrance detector or the exit detector should be shifted slightly off the beam axis. Since the exit dose is more sensitive to the position displacement, it is recommended to keep the exit detector on the central axis and shift the entrance detector off the axis.[7] Ratio of the measured to the expected values is considered as an indicator for the accuracy of treatment procedure.
Equipment
The study was carried out with a 60Co (Theratron Phoenix) unit. Measurements were performed using 82 LiF (MCP) chips. This type of TLD is rather water equivalent (effective atomic number 8.2[10]) and adopted for clinical measurements. Among the chips, 16 were kept in the laboratory as reference chips. These chips were just used for calibration and control. TLDs were analyzed with Harshaw-3500 manual reader. After a preheat session at 135°C for10 s, the TL signal was acquired from 135°C to 240°C at a heating rate of 10°C/s. LiF (MCP) is usually annealed in an oven for 10 min at 240°C,[16–18] but deformed glow curves were noticed by following this procedure [Figure 1], which might be due to imperfect thermal transmission form metal plate container in the oven. For this reason, single chip annealing method using reader post-reading cycle (240°C for 10 s), was preferred. With an absorbed dose of 1 Gy at the center of a 10 × 10 cm2 field size and 80 cm source-skin distance (SSD), the residual signal (the ratio of second reading to the first one) was found to be less than 1%. Batch uniformity was 3.5% (1 SD).
Figure 1.

Samples of glow curve for two different annealing procedures. (a) TLDs were annealed in the oven for 10 min. (b) Post-read annealing cycle in the reader was followed (240°C for 10 s). Deformed glow curve was noticed during the successive measurement following the first annealing procedure
A 0.6 cm3 guarded Farmer NE 2571 Ionization Chamber (IC) connected to a Farmer NE2670A electrometer has been used as an absolute dosimeter during calibration. Expected dose was calculated from the prescribed tumor dose with the ALFARD version 4.30.2 SPLWP two-dimensional treatment planning system.
Calibration procedures
In order to convert TL signal (μC) to dose value (cGy), calibration procedure was carried out by acquiring TLDs’ response for certain dose values in the actual dose range (20–190 cGy in 10 cGy steps). Identical badges, beam geometry, and TL cycle (the time period for each anneal-irradiation–read cycle) have been followed for calibration and clinical measurements.
Entrance dose calibration
For entrance dose (Den) measurement, TLDs were positioned on the phantom surface and calibrated to determine the dose inside the phantom at the depth of maximum dose (dm) [Figure 2].[19] For the calibration in each stage, all reference TLDs were irradiated to an identical dose value on the surface of a 30 × 30 × 10 cm3 standard water phantom at the center of a 10 × 10 cm2 field size and SSD = 80 cm (reference geometry). TLD badges were covered with a 0.5-cm build-up material for the sake of electronic equilibrium. The IC was positioned inside the phantom at a depth 5 cm. After each irradiation, the absorbed dose value, which was determi ned by IC, was converted to dose at the depth of maximum using Percentage Depth Dose (PDD) data. This entrance dose corresponds to the average signal of reference TLDs at the respected dose. The same procedure was followed for 18 dose values, which took 18 weeks (1 week for each TL cycle) in order to keep the same fading time required by clinical condition. Considering IC doses and the corresponding TL response values, applying Table Curve 2D (ver. 5.01) software, the dose–response (calibration) function was fitted as a [ ] and b are constants specified by TLD sets and geometry, and
  ref is the average reading of reference TLDs, (fit standard error 1.3).
Figure 2.
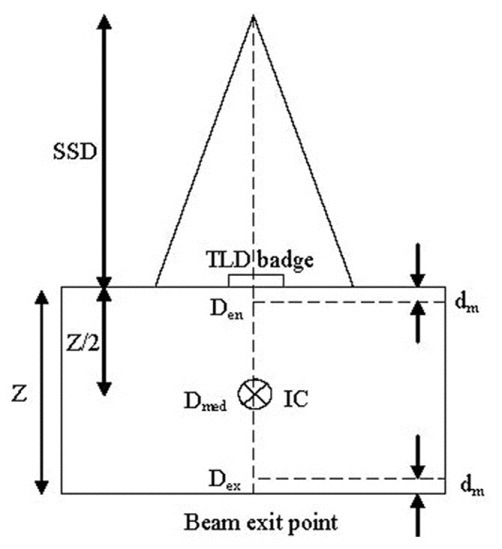
Schematic representation for entrance dose calibration of TLDs. TLD badges were positioned at the surface of standard water phantom (30 × 30 × 10 cm3) in reference geometry and covered with 0.5-cm build-up material. The aver age TLDs’ measured signal was correlated to the IC measured dose in the depth dm (Den). The geometry for exit dose calibration was the same except that TLD badges were stuck at the beam exit point
To consider the influence of intrinsic differences between TLDs, Element Correction Coefficient (ECC) was determined for each of them. For this purpose, all TLDs were irradiated to an identical dose value (1 Gy) under reference geometry, and the ECC for ith TLD (ECCi) was determined as  ref/Ri, where Ri is the TL signal of ith TLD for the identical absorbed dose. By the application of ECCs, TLDs’ intrinsic precision was improved to approximately 2% (1 SD). In order to correct the sensitivity loss during successive measurements, the irradiation procedure was repeated bimonthly and ECCs were renewed. To take care of the sensitivity loss of reference TLDs, a Sensitivity Factor (SF) was also defined as
  where suffix1 is related to first dose–response evaluation and f is the value for the last one. SF was also checked and renewed along with ECCs bimonthly.
Final dose value for each TLD is determined by incorporating Ri × ECC × SF in the calibration function. The calibration procedure was validated in cooperation with the National Secondary Standard Dosimetry Laboratory. TLDs were irradiated to 20 cGy dose in SSDL. Our evaluation of this dose value was 20.0 ± 0.6 cGy.
Exit dose calibration
There is a build-down region at the beam exit side due to the lack of full backscatter radiation and proper equilibrium.[19] Therefore, a variation in the dose–response function is expected. For this reason, dose–response function was established for the exit surface separately and was applied along with exit ECCs for measurements at this surface.
For exit dose (Dex) measurement, TLDs are positioned on the phantom at the beam exit surface and calibrated to determine the dose inside the phantom at the depth of maximum dose from exit surface [Figure 2]. The exit calibration procedure was similar to that of entrance dose calibration except that TLDs covered with 0.5 cm water-equivalent (build-down) material were stuck to the backside of phantom and irradiated to identical dose values in reference geometry. The build-down thickness is enough for electron equilibrium, but not for photons.[19] IC absorbed dose in depth 5 cm was converted to dose at the depth of Z-dm. Dose–response curve was fitted combining IC absorbed dose and respected TLDs’ response using Table Curve 2D (ver. 5.01) software (fit standard error 1.9). The general shape of exit dose–response function is similar to that of entrance calibration function with different coefficients [Figure 3]. Due to insufficient builddown and loss of some backscattered photons at the exit surface, using the entrance dose–response function and ECCs for the exit data would lead to dose values which would be systematically underestimated as illustrated in Figure 4.
Figure 3.
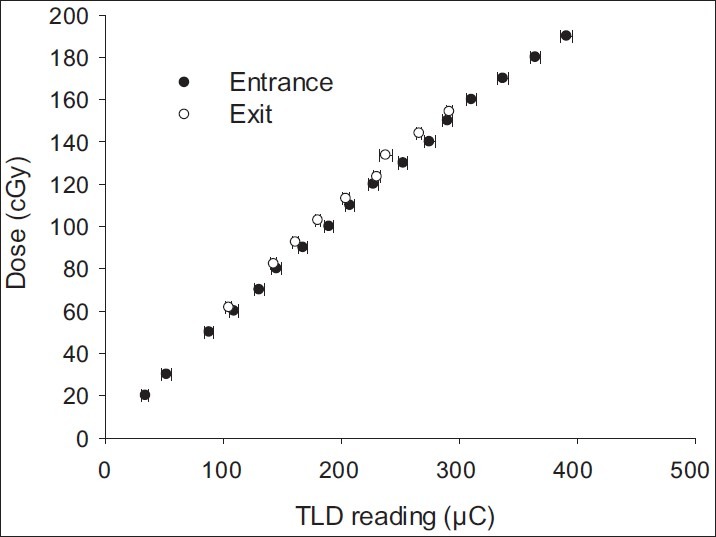
Dose–response (calibration) functions of TLDs. The function was evaluated for the entrance and exit surfaces separately
Figure 4.
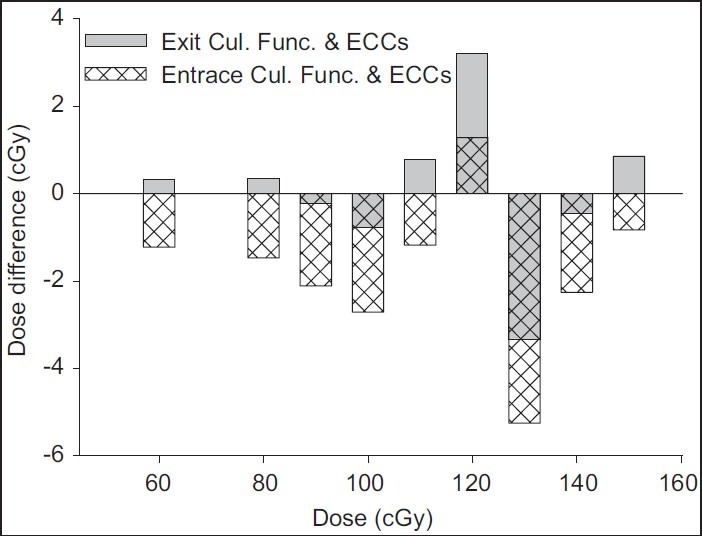
The difference between measured and delivered dose (recorded by IC) values at the exit surface. TLDs’ readings for different dose values at the exit surface were analyzed using both entrance calibration function (patterned bars) and also exit calibration function (gray bars) and the respective sets of ECCs. Application of entrance calibration function and ECCs for TL data of the exit surface could lead to a systematic underestimation of the exit dose values
Midline dose determination
Midline dose was calculated based on transmission measurements. The ratio of the exit dose (Dex) to the entrance dose (Den) is defined as the exit transmission (Tex = Dex/Den). In the same manner, midline transmission is the ratio of midline dose (Dmid) to the entrance dose (Tmid = Dmid/Den). The exit and midline transmissions (Tex, Tmid) could also be calculated and corresponding tables be established on the basis of the following relations (adapted from[2]):
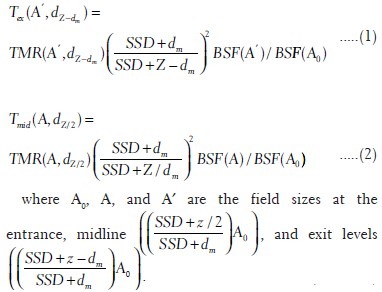
Z is the water-equivalent (effective) depth and dm is the depth of maximum dose. TMR and BSF stand for Tissue Maximum Ratio and Backscatter Factor, respectively. These relations are applicable for both SAD and SSD techniques considering appropriate values of SSD and field sizes. Delivered dose to the midline (target) was determined based on the method recommended by Leunens et al.[2] in the following manner:
Determination of the actual exit transmission (Tex): By incorporating the values of entrance and exit doses measured during treatment, the actual T ex was determined (Tex = Dex/Den).
Determination of the water-equivalent thickness (Z) of patients: For this purpose, at first by the application of BSF and TMR data, which are available as standard tables,[20] theoretical Tex values were calculated using equation (1) and established as a table for different field sizes and water-equivalent dep ths (Z). Z was determined by considering the actual Tex value, determined from part a, in this table.
Determination of theoretical midline transmission (Tmid): In the same manner, by incorporating BSF and TMR in equation (2), another table was established as midline transmission for different field sizes and water-equivalent depths (Z). Considering the water-equivalent depth, evaluated form part b, midline transmission was determined from this table.
Determination of midline absorbed dose (Dmid): By using the theoretical Tmid , determined in part c, and the measured entrance dose, midline absorbed dose was determined (Dmid = Tmid × Den).
For treatments where target was not placed exactly at the midline, the given depth (c) was converted to water-equivalent depth (w) through a depth correction factor (fd) defined as fd = Z/d, where d is patient diameter estimated from the body contour. Then water-equivalent depth was estimated according to the relation: w = c × fd. Consistency of the whole procedure was validated against a course of phantom study.
Results and Discussion
Correction factors
Correction factors have to be determined when irradiation geometry differs from the reference geometry used in the calibration procedure. These variations in TLDs’ response were examined in different SSDs and field sizes. Correction factor (CF) is defined as:

SSD correction factor was determined at both entrance and exit surfaces of the phantom. For this purpose, variations in average response of reference TLDs to 1 Gy absorbed dose (recorded by IC) in 10 × 10 cm2 field size (at the collimator) were studied in different SSDs at both entrance and exit sides of the phantom. Results are presented in Figure 5.
Figure 5.

SSD correction factor at the entrance surface (a) and the exit surface (b). All data have been evaluated for a 10 × 10 cm2 field size (at the collimator), then normalized to the response at the reference geometry
In order to determine field-size correction factor, variations in the average response of reference TLDs to 1 Gy absorbed dose (recorded by IC) in SSD = 80 cm were studied for different field sizes at both entrance and exit sides of the phantom [Figure 6].
Figure 6.

Field-size correction factor at the entrance surface (a) and the exit surface (b). All data have been evaluated for an SSD = 80 cm and different field sizes, then normalized to the response at the reference geometry
In all cases, the resultant deviations in TL response were found to be less than uncertainty level.
Phantom study
Consistency of the whole procedure was validated against a course of phantom study. For this purpose, the standard phantom was irradiated to identical exposure levels. Entrance and exit doses were measured simultaneously on the phantom (Z = 10 cm). Midline dose was also measured with IC placed inside the phantom at a depth 5 cm. The midline dose and water-equivalent thickness evaluated from TLD measurements were compared with phantom measurement results. The method was tested for both SSD (n = 11) and SAD (n = 7) technique and Results are presented in Table 1.
Table 1.
Results for phantom studies

Clinical measurements
In vivo dosimetry was carried out for 172 treatment fields on 152 patients. Treatment sites were divided into two separate groups, Thorax, Abdomen, and Pelvic (T-A-P, 120 fields) and Head and Neck (H-N, 52 fields), which were studied in different periods. Results for entrance and midline doses are presented as the ratio of measured (Dm) to the expected (De) dose values (Dm/De). The ratio is considered as an indicator for agreement between the actual and expected dose values. Furthermore, based on transmission data, target-effective depths (Zeff) are evaluated and compared with patients’ contour data. It is recommended that treatment uncertainty should be within 5% of the prescribed dose.[2–9,21] Although application of appropriate sets of calibration function and ECCs would increase the TLDs’ precision, one should see it in the context of acceptable range of variation for TL measurements, which is considered to be less than 10%.[12,21,22] Radiotherapy has the potential for accidental exposures. As described in ICRP Report-86,[23] errors in device operation, source calibration, and treatment calculation may lead to serious accidents, which in most cases can be prevented by implementing adequate in vivo dosimetry. In spite of intrinsic uncertainty, TLDs have been used widely for this purpose to find about weak points in treatment chain.[7,12,15,21,22]
Entrance dose (Den)
The entrance dose is determined as an indicator for the accuracy of treatment preparation. The overall average ratio of the measured to the expected entrance dose has been 1.01 ± 0.07. Frequency distribution of data is presented as a histogram in Figure 7 for different treatment sites.
Figure 7.
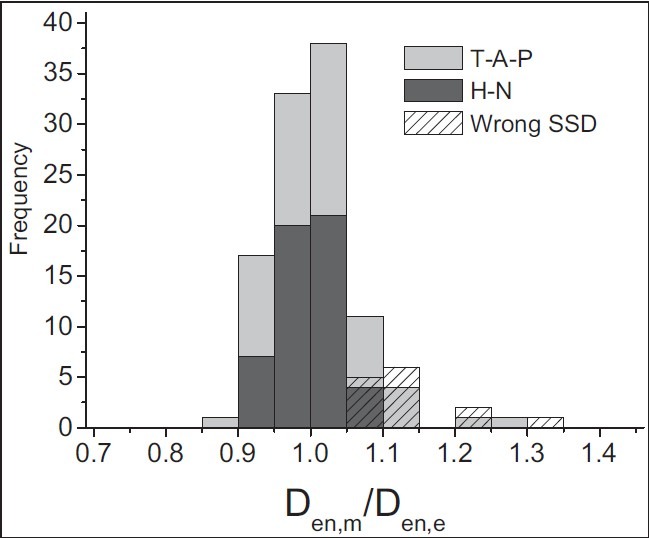
Results for entrance dose measurements. The histogram shows the distribution for the ratio of measured to expected entrance doses. Light-gray bars represent T-A-P treatments (n = 106) and dark-gray bars represent H-N treatments (n = 52). Patterned bars correspond to T-A-P data, which were collected during malfunction of SSD indicator (n = 14)
The entrance dose ratio for T-A-P treatments is 1.02 ± 0.07. Both the entrance dose distribution and the average value show a systematic overdose at this level [Figure 7]. In the period of T-A-P measurement, an error in SSD indicator was found during a routine weekly quality control program, which was corrected. Out of 27 fields which were measured in this period, in approximately 14 treatment fields, an overdose of more than 5% (more than 10% in 9 fields) was determined during this period. All measurements were repeated in the following week; however, this error was considered as a part of our uncertainty.
For H-N treatment, the average ratio of measured to expected entrance dose has been 0.99 ± 0.04. Results for H-N measurements indicated a better agreement between measured and expected doses at the entrance level with respect to T-A-P results.
Effective diameter
Apart from treatment accuracy, effective diameter is estimated using transmission data. The ratio of the effective depth (Zeff) to the patient contour depth (d) shows a wide distribution as illustrated in Figure 8. Average value of the distribution is 1.00 with a standard deviation of 0.13.
Figure 8.
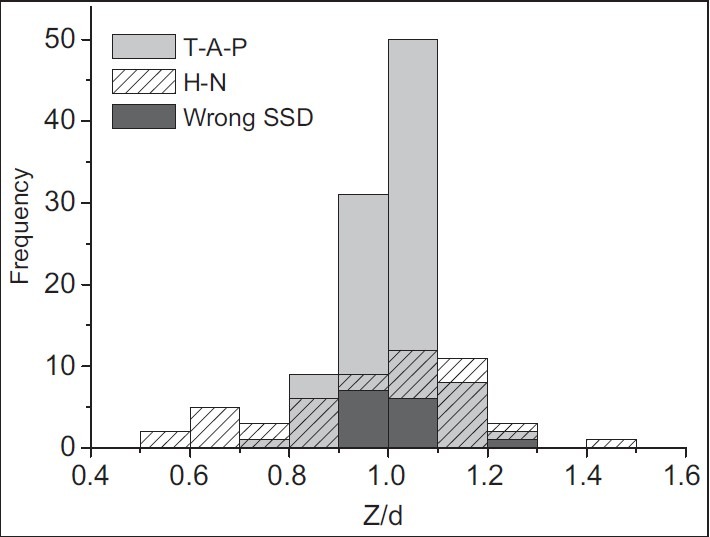
Results for water-equivalent diameter measurements. The histogram shows the distribution for the ratio of water-equivalent to contour diameters. Light-gray bars represent T-A-P treatments (n = 106) and patterned bars represent H-N treatments (n = 52). Dark-gray bars correspond to T-A-P data, which were collected during malfunction of SSD indicator (n = 14)
For T-A-P treatment, the average agreement between the effective diameter and patient's contour diameters has been 1.02 ± 0.08. On the average, water-equivalent depth in this treatment site is found to be systematically about 2% more than patient's contour depth. This could be due to contour inaccuracies, body shape, tissue inhomogeneity, and respiration. It also could be due to volume of urine, excrement, or gas.
In order to evaluate the share of contour inaccuracy in these discrepancies, 48 T-A-P patients’ diameters were checked randomly by caliper and then compared to the diameters reported on the patients’ contour. The distribution is presented in Figure 9. These measurements revealed differences of more than 1 cm in treatment depth in nine cases (18.7%). It should be noted that patient's thickness, especially at the T-A-P anterior-posterior (AP/PA) position, could extend up to 0.5 cm due to respiration. Also, body contour variation along the treatment field makes it difficult to determine the exact diameter, especially for too fat or too slim patients. In some cases, the deviation could reach 2 cm or even more.
Figure 9.
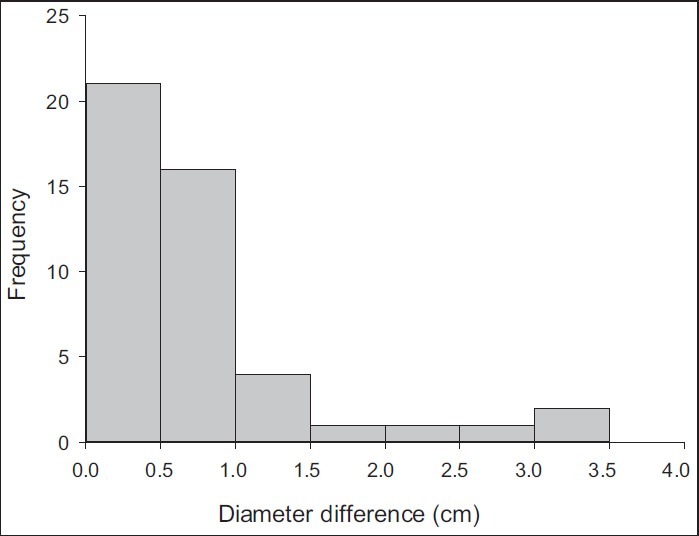
The distribution of discrepancies between patient and contour diameters. Patients’ diameters were checked with caliper and compared to contour data. All patients were treated for T-A-P
The ratio of effective to patient's contour diameters for H-N fields has shown a wider distribution with the average value of 0.98 ± 0.20. This higher diameter fluctuation seems to be due to large deviations in body shape along the treatment field, besides the tissue inhomogeneities and organ curvature. Especially, when both head and neck (with different diameters) are involved in one field (i.e., for nasopharynx treatment), it is impossible to determine one exact value as treatment depth. Therefore, usually an average value is considered as treatment depth which is generally different from the actual diameters.
Midline dose
Midline dose has been estimated by considering effective diameter along with entrance dose. Frequency distribution of the evaluated to prescribed dose, as percentage, is plotted in Figure 10. Mean value of the distribution is 1.00 with a standard deviation of 0.07.
Figure 10.
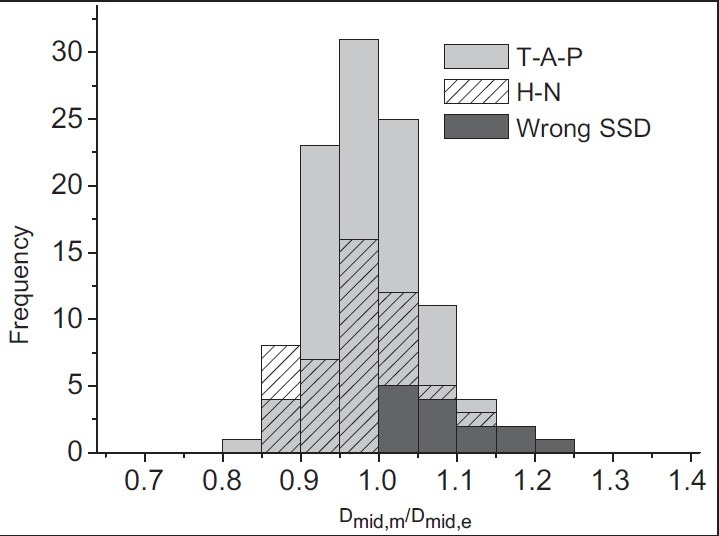
Results for midline dose measurements. The histogram shows the distribution for the ratio of measured to expected (prescribed) midline doses. Light-gray bars represent T-A-P treatments (n = 106) and patterned bars represent H-N treatments (n = 52). Dark-gray bars correspond to T-A-P data, which were collected during malfunction of SSD indicator (n = 14)
The average agreement between measured and expected target doses for T-A-P is 1.00 ± 0.07. A difference of more than 10% was recorded in 16 fields (13.3%). Among them, five fields were measured during malfunction of SSD indicator, where an overdose of more than 10% happened at the entrance surface.
For H-N fields, the average ratio of measured to prescribed dose at the target level is found to be 0.99 ± 0.08. Large deviations in body shape led to higher level of deviation in effective diameter which is reflected in the midline dose. Differences between measured and prescribed doses were found to be more than 10% in 12 treatment fields (23.1%), whereas the difference between effective and contour depths was found to be 10% or more in 11 of them.
Conclusion
A comprehensive series of in vivo dosimetry measurements has been carried out for the evaluation of treatment accuracy in external beam radiotherapy using LiF (MCP) TLDs.
Measurements of entrance and exit doses on two groups of patients in T-A-P and H-N treatments have led to a better agreement in H-N treatment for entrance doses. The inhomogeneity of H-N bony structure affects dose distribution; however, more efficient treatment fixation leads to more accurate treatment set-up. A frequent higher level of entrance dose recorded in T-A-P measurement was found to be due to an error in SSD indicator.
Evaluation of water-equivalent depth and midline dose revealed a close relationship between the midline dose inaccuracy and discrepancy of water-equivalent and contour depths in most cases. This was more pronounced in H-N treatments, where besides tissue inhomogeneity, higher variation of body shape along the treatment field makes it relatively difficult to identify an exact value for the treatment depth. Since dose ratios are used for the determination of effective diameter, its accuracy is rather independent of the treatment precision, which leads to a more comprehensive depth value for treatment calculations, especially in T-A-P treatment site.
Evaluating delivered dose in different levels provided valuable information about treatment procedure. Transmission measurements were found to be very useful in the evaluation of uncertainties in patient's data such as contour error and tissue inhomogeneities. It is also useful for the control of treatment planning system.
Acknowledgments
The authors are grateful to the kind support provided by Dr A Rahimi, head of radiotherapy department of Razi hospital in Rasht. The kind assistance of radiation therapy staff, namely F. Gholizade, S. Mostafa-poor, Z. Mohammadi, N. Ramezani, F. Rezvan-niya, H. Mohammadi-khah and H. Asi is also highly appreciated.
Footnotes
Source of Support: Nil
Conflict of Interest: None declared
References
- 1.Leunens G, Van Dam J, Dutreix A, van der Schueren E. Quality assurance in radiotherapy by in vivo dosimetry. 1. Entrance dose measurements, a reliable procedure. Radiother Oncol. 1990;17:141–51. doi: 10.1016/0167-8140(90)90102-3. [DOI] [PubMed] [Google Scholar]
- 2.Leunens G, Van Dam J, Dutreix A, van der Schueren E. Quality assurance in radiotherapy by in vivo dosimetry. 2. Determination of the target absorbed dose. Radiother Oncol. 1990;19:73–87. doi: 10.1016/0167-8140(90)90167-u. [DOI] [PubMed] [Google Scholar]
- 3.Adeyemi A, Lord J. An audit of radiotherapy patient doses measured with in vivo semiconductor detectors. Br J Radiol. 1997;70:399–408. doi: 10.1259/bjr.70.832.9166077. [DOI] [PubMed] [Google Scholar]
- 4.Fiorino C, Corletto D, Mangili P, Broggi S, Bonini A, Cattaneo GM, et al. Quality assurance by systematic in vivo dosimetry: Results on a large cohort of patients. Radiother Oncol. 2000;56:85–95. doi: 10.1016/s0167-8140(00)00195-x. [DOI] [PubMed] [Google Scholar]
- 5.Herbert CE, Ebert MA, Joseph DJ. Feasible measurement errors with undertaking in vivo dosimetry during external beam radiotherapy of the breast. Med Dosim. 2003;28:45–8. doi: 10.1016/S0958-3947(02)00241-8. [DOI] [PubMed] [Google Scholar]
- 6.Noel A, Aletti P, Bey P, Malissard L. Detection of errors in individual patients in radiotherapy by systematic in vivo dosimetry. Radiother Oncol. 1995;34:144–51. doi: 10.1016/0167-8140(94)01503-u. [DOI] [PubMed] [Google Scholar]
- 7.Tung CJ, Wang HC, Lo SH, Wu JM, Wang CJ. In vivo dosimetry for external photon treatments of head and neck cancers by diodes and TLDs. Radiat Prot Dosimetry. 2004;111:45–50. doi: 10.1093/rpd/nch358. [DOI] [PubMed] [Google Scholar]
- 8.Tunio M, Rafi M, Ali S, Ahmed Z, Zameer A, Hashmi A, et al. In vivo dosimetry with diodes in a radiotherapy department from Pakistan. Radiat Prot Dosimetry. 2011;147:608–13. doi: 10.1093/rpd/ncq566. [DOI] [PubMed] [Google Scholar]
- 9.Voordeckers M, Goossens H, Rutten J, Van Den Bogaert W. The implementation of in vivo dosimetry in a small radiotherapy department. Radiother Oncol. 1998;47:45–8. doi: 10.1016/s0167-8140(97)00177-1. [DOI] [PubMed] [Google Scholar]
- 10.Moscovitch M. Personnel dosimetry using LiF: Mg, Cu, P. Radiat Prot Dosimetry. 1999;85:49–56. [Google Scholar]
- 11.Essers M, Mijnheer BJ. In vivo dosimetry during external photon beam radiotherapy. Int J Radiat Oncol Biol Phys. 1999;43:245–59. doi: 10.1016/s0360-3016(98)00341-1. [DOI] [PubMed] [Google Scholar]
- 12.Ferguson HM, Lambert GD, Gustard D, Harrison RM. Tumor dose estimation using automated TLD techniques. Acta Oncol. 1998;37:479–84. doi: 10.1080/028418698430449. [DOI] [PubMed] [Google Scholar]
- 13.Mijnheer BJ. State of the art of in vivo dosimetry. Radiat Prot Dosimetry. 2008;131:117–22. doi: 10.1093/rpd/ncn231. [DOI] [PubMed] [Google Scholar]
- 14.Waligorski MP. What can solid state detectors do for clinical dosimetry in modern radiotherapy? Radiat Prot Dosimetry. 1999;85:361–6. [Google Scholar]
- 15.Loncol T, Greffe JL, Vynckier S, Scalliet P. Entrance and exit dose measurements with semiconductors and thermoluminescent dosimeters: A comparison of methods and in vivo results. Radiother Oncol. 1996;41:179–87. doi: 10.1016/s0167-8140(96)01826-9. [DOI] [PubMed] [Google Scholar]
- 16.Ben-Amar G, Ben-Shachar B, Oster L, Horowitz Y, Horowitz A. Investigation of the glow peak parameters, reusability and dosimetric precision of LiF: Mg, Cu, P at High Heating Rates up to 20 Ks-1. Radiat Prot Dosimetry. 1999;84:235–8. [Google Scholar]
- 17.Ramlo M, Moscovitch M, Rotunda JE. Further studies in the reduction of residual in Harshaw TLD-100H (LiF: Mg, Cu, P) Radiat Prot Dosimetry. 2007;125:217–9. doi: 10.1093/rpd/ncl115. [DOI] [PubMed] [Google Scholar]
- 18.Srivastava JK, Bhatt BC, Yoshimura EM, Okuno E, Sunta CM. A Comparative analysis of three thermoluminescent phosphors LiF: Mg, Ti (TLD-100), LiF: Mg, Cu and LiF: Mg, Cu, P. Radiat Prot Dosimetry. 1996;65:191–4. [Google Scholar]
- 19.Van Dam J, Marinello G. Methods for in vivo dosimetry in external radiotherapy. Brussels: ESTRO; 2006. [Google Scholar]
- 20.Aird EG, Burns JE, Day MJ, Duane S, Jordan TJ, Kacperek A, et al. Central axis depth dose data for use in radiotherapy. A survey of depth doses and related data measured in water or equivalent media. Br J Radiol Suppl. 1996;25:1–189. [PubMed] [Google Scholar]
- 21.Kron T, Schneider M, Murray A, Mameghan H. Clinical thermoluminescence dosimetry: How do expectation and results compare? Radiother Oncol. 1993;26:151–61. doi: 10.1016/0167-8140(93)90097-r. [DOI] [PubMed] [Google Scholar]
- 22.Ferguson HM, Lambert GD, Harrison RM. Automated TLD system for tumor dose estimation from exit dose measurements in external beam radiotherapy. Int J Radiat Oncol Biol Phys. 1997;38:899–905. doi: 10.1016/s0360-3016(97)00282-4. [DOI] [PubMed] [Google Scholar]
- 23.New York: Pergamon; 2000. International Commission on Radiological Protection (ICRP), Report 86, Prevention of accidents to patients undergoing radiation therapy. [DOI] [PubMed] [Google Scholar]


