Abstract
Mechanical stimulation of osteoblasts by fluid flow promotes a variety of pro-differentiation effects and improving the efficiency of these mechanical signals could encourage specific differentiation pathways. One way this could be accomplished is by altering mechanical properties of osteoblasts. In this study, murine osteoblastic MC3T3-E1 cells were cultured on surfaces covered with nanometer-sized islands to examine the hypothesis that the elastic modulus of osteoblastic cells is affected by nanoscale topography. Nanoislands were produced by polymer demixing of polystyrene and poly(bromostyrene), which leads to a segregated polymer system and formation of nanometer sized topographical features. The elastic modulus of MC3T3-E1 cells was determined using atomic force microscopy in conjunction with the Hertz mathematical model. Osteoblastic cells cultured on nanotopographic surfaces (11-38 nm high islands) had a different distribution of cellular modulus values, e.g., the distribution shifted towards higher modulus values, relative to cells on flat control surfaces. There were also differences in cell modulus distribution between two flat controls as surface chemistry was changed between polystyrene and glass. Taken together, our results demonstrate that both surface nanotopography and chemistry affect the mechanical properties of cells and may provide new methods for altering the response of cells to external mechanical signals.
Keywords: osteoblast, elastic modulus, nanotopography, atomic force microscopy, Hertz model
1. Introduction
An understanding of how biomaterial characteristics affect bone cell behavior would be beneficial in the rational design of skeletal tissue engineering protocols. It has recently been demonstrated that surface nanotopography affects cell behavior including that of bone cells. We demonstrated that human fetal osteoblastic cells on 11 nm high island textured surfaces display significantly enhanced cell spreading, adhesion and proliferation relative to cells on larger nanoislands or flat control (Lim et al., 2005a). We also observed that alkaline phosphatase activity, an early stage marker of bone cell differentiation, exhibited nanotopography dependence. Palin et al. (Palin et al., 2005) demonstrated that nanoscale roughness on poly(lactic-co-glycolic acid) film increased osteoblastic cell adhesion and proliferation. Interestingly, the scale of nanotopographies developed for these studies were similar to those of bone surfaces in vivo, ca. 5-10 nm deep striations every 67 nm for collagen and 50 × 25 × 4 nm3 sized hydroxyapatite. The surface roughness of bone is approximately 32 nm making it within the nanoscale range of biomaterials we and others have examined (Lim et al., 2005b; Lim et al., 2007; Palin et al., 2005).
While emerging data suggest that osteoblastic cells respond to surface nanotopography, the mechanism by which this occurs is not known. One clue comes from the finding of increased organization of cytoskeletal elements, especially actin, in cells on nanotopographies relative to flat surfaces (Ajubi et al., 1999; Dalby et al., 2006; Lim et al., 2005a). Actin stress fibers contribute to the viscoelastic properties of cells, including chondrocytes, fibroblasts and hepatocytes, and disrupting actin decreases the elastic modulus of cells (Rotsch and Radmacher, 2000; Sato et al., 1990; Trickey et al., 2004). Nanoscale topography may, through an effect on actin organization, regulate cell compliance and potentially cellular response to environmental clues, especially mechanical signals. Additionally, surface characteristics affect osteoblastic cell stiffness. For instance, culture of osteoblasts on fibronectin increases their modulus (Takai et al., 2005) and responsiveness to fluid flow (Takai et al., 2006).
Few studies have examined the effect of surface characteristics on cell modulus and none have examined nanotopography. We used atomic force microscopy (AFM) to examine the hypothesis that nanoscale topography affects osteoblastic cell modulus. The AFM was used to indent living osteoblastic cells under media and the modulus of the individual cells was analyzed with the Hertz model. MC3T3-E1 cells were cultured on two nanoisland surfaces as well as two flat control surfaces, polystyrene and plasma cleaned glass.
2. Materials and methods
2.1. Preparation and imaging of substrates
Polystyrene/poly(4-bromostyrene) (PS/PBrS) demixed films were made as previously reported (Dalby et al., 2002; Lim et al., 2005a). PS (Mw = 289 × 103) and PBrS (Mw = 65 × 103) mixed at 40/60 w/w were dissolved in toluene at either 0.5% or 2% w/w and spin-cast on 15 mm glass coverslips. Samples were annealed for 1 hour at 130°C, causing PS to migrate to the surface (Affrossman et al., 1996; Affrossman et al., 1998). Thus, topography effects could be examined under the same surface chemistry of PS. One flat control surface was a spin-cast PS film (from a 5% w/w solution) and the other was plasma-cleaned glass coverslip.
Imaging of substrates was performed using an AFM (Nanoscope IIIa, Digital Instruments) in TappingMode® under ambient conditions using Si cantilevers (MikroMasch). Three samples were examined per condition each at least six random areas.
2.2. Spring constant calibration
Spring constants of cantilevers were determined using a previously published method (Craig and Neto, 2001). AFM cantilevers (BioForce Nanosciences) had a 5.0 μm sphere attached to the end of a nominally 0.58 N/m triangular Si3N4 cantilever. These sphere-modified probes were chosen to provide a well-characterized, uniform indenter surface with less potential for damaging cells than standard pyramidal Si3N4 tips. The spring constant calibration takes advantage of this sphere by using the principle of hydrodynamic drag. As a sphere moves through a viscous medium toward a wall, a drag force develops and increases as the sphere gets closer to the wall. The AFM was used to move a freshly cleaved mica substrate (Ted Pella) toward the sphere. The drag force results in deflection of the cantilever and this deflection was used to determine spring constants. The deflection was measured using a variety of drag forces generated by solutions of different viscosity as well as a range of sphere velocities, specifically 30 and 60 mPa·s viscosity sucrose solutions were used in combination with 12 tip velocities ranging between 2 and 56 μm/s. A custom written MatLab program was used to calculate the spring constant of the cantilever.
2.3. Cell Culture
Osteoblastic MC3T3-E1 cells were plated at 1700, 3400 and 5100 cells/cm2. AFM experiments were performed after either 24 or 48 hours of cell culture, and samples were kept covered with medium throughout. Medium consisted of α-MEM (GIBCO) supplemented with 10% fetal bovine serum (Hyclone) and 1% penicillin-streptomycin.
2.4. AFM cell indentation experiments
AFM experiments consisted of acquiring force-volume images. These images consist of an array of position-deflection curves as well as a corresponding topographic map. The modulus was calculated using data contained in position-deflection curves, which were acquired by bringing the cell and probe together so that the sphere indents the cell and then subsequently separating the two. The cell was compressed by the probe at a loading rate of 3.8 μN/sec until the probe was deflected to a user-defined threshold value of 125 nm. The compression measurements necessary for calculating cell modulus and a topographic image of the substrate were performed simultaneously. All modulus data were calculated from an array of 32 × 32 position-deflection curves acquired over the surface of the sample.
2.5. Data analysis
The elastic modulus of cells was determined using the Hertz mathematical model (Chizhik et al., 1998). This related indentation of the sample to force applied. There are several assumptions required for use of the Hertz model, notably that the sphere was orthogonally indenting a homogenous, semi-infinite plane. The Hertz model for a spherical indenter is described by:
| (1) |
where δ is the deformation of the sample, F is the applied force, ν is the Poisson’s ratio (0.5), E is the elastic modulus and R is the radius of the sphere. This was rearranged into a useable form, equation 2, by using the fact that the entire indentation portion of the position-deflection curve can be used in modulus calculation. This enabled the use of any arbitrary two points, (z1, d1) and (z2, d2), on the force curve.
| (2) |
Here, k is the spring constant of the cantilever (measured experimentally) and d0 is the initial deflection of the cantilever (determined from the force curve by taking the average value of the cantilever deflection in the noncontact region before the probe contacts the cell surface).
A custom Matlab program was written to analyze the array of 32 × 32 position-deflection curves acquired during each image. To determine the elastic modulus from one of these individual curves, all the points acquired during cell-probe contact (the indentation region of the curve) were isolated by extrapolating the zero deflection curve from the non-contact region to find the (position, deflection) value corresponding to the d0 position. Each possible combination of points from the indentation region of the curve (z1, d1 and z2, d2 pairs) was fit to the model using equation 2 yielding a number of individual measures for E. The mean modulus value calculated from each of the possible combinations was designated as the value for the elastic modulus at that particular (x, y) location. This was repeated for each of the 1024 individual deflection-position curves in the x-y plane.
Non-parametric probability density function of the cell modulus was estimated using the entire 1024 set of modulus measurements. The density function estimates were constructed using a Gaussian kernel with a standard deviation of 170 Pa, as implemented in S-PLUS v7.0. The overall density function was calculated from the individual density functions as an arithmetic mean of the densities. The overall density functions of the cell modulus for each substrate were compared qualitatively with no statistical tests of formal hypotheses.
3. Results
Determination of spring constants of cantilevers showed values between 0.09 and 0.19 N/m, with a coefficient of variation less than 20%. This is 1/3 to 1/6 the expected value of 0.58 N/m and greatly increases the accuracy of modulus measurements. No additional verification of the spring constant was attempted. The consistency of these calibrations allowed a high degree of internal control for the experiments.
AFM height images of test surfaces (Figure 1) show that two control substrates, plasma cleaned glass and flat PS, were both very flat with no large topographic features. For polymer demixed surfaces, the distribution of nanoislands did not change from the center of the samples to the edges. These nanoislands were approximately 10.8 ± 1.4 nm tall for the 0.5% solution and 38.2 ± 4.8 nm tall for the 2% solution.
Figure 1.
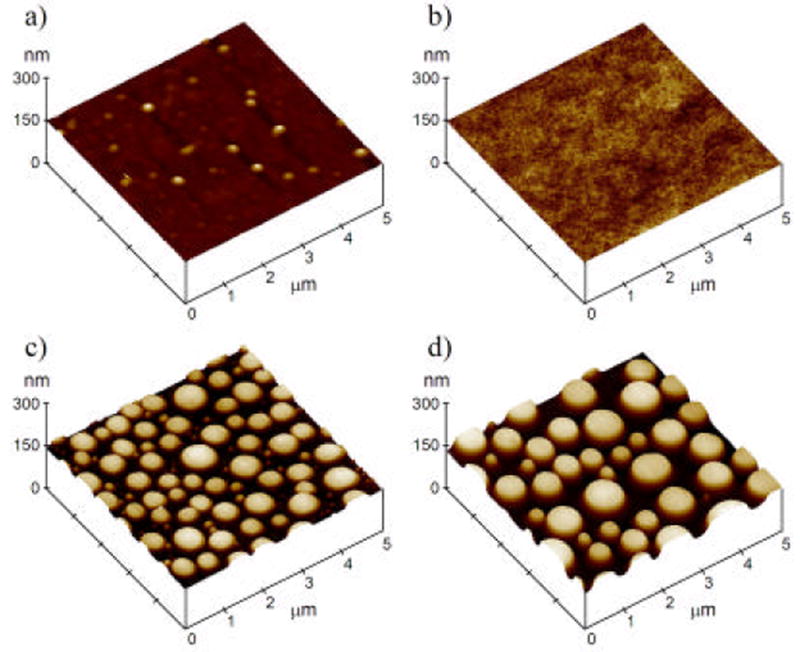
TappingMode® AFM height images of all four substrates. Plasma cleaned glass (a), flat polystyrene (b), 11 nm nanoislands (c) and 38 nm nanoislands (d) are shown. All images are 5μm × 5 μm with a height scale of 150 nm/div.
Examples of topographic images of cells cultured on test surfaces are shown in Figure 2. There was a mixture of areas of uncovered substrate as well as areas of cells visible in most images. No consistent trends in shape or size of cells could be observed in AFM height images obtained for the four different surfaces. Heights of cells were generally less than 2 μm, although this could be an artificially low value arising from compression of the cell under the probe during imaging. However, a cell height of 2 μm is consistent with other AFM imaging we have performed in which cells were prepared using standard electron microscopy fixation and dehydration protocols and then imaged by tapping mode AFM in ambient conditions (not shown).
Figure 2.
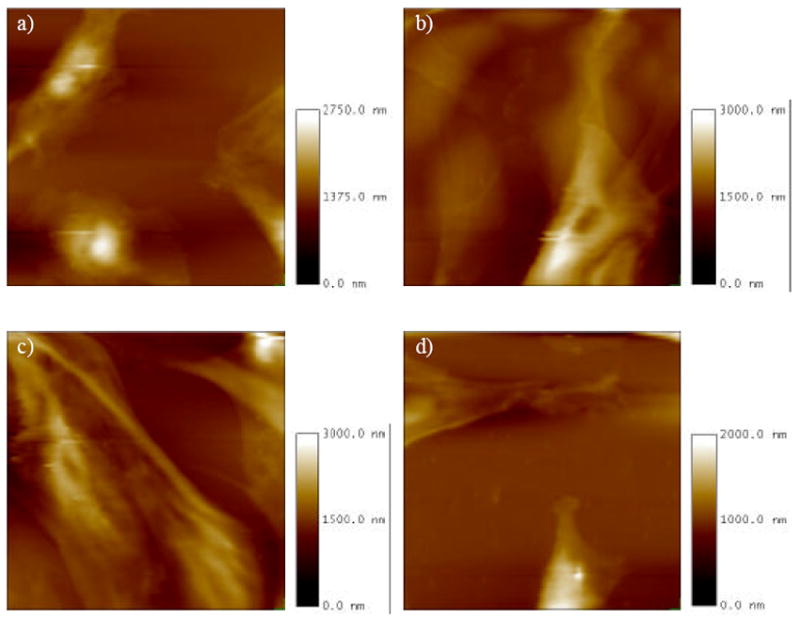
Height image portion of the force-volume image for MC3T3-E1 osteoblastic cells grown on plasma cleaned glass (a), flat polystyrene (b), 11 nm nanoislands (c) and 38 nm nanoislands (d). All images are 120 μm × 120 μm with different z axis maximum (see scale bars).
Figure 3 illustrates examples of modulus maps showing computed elastic modulus at each point on each cell-cultured surface. These maps are computed from data obtained simultaneously with the topographic images in Figure 2. Analysis of modulus values demonstrated that cells typically had values well below 30 kPa while the substrates invariably had modulus significantly above this value. In Figure 3, modulus values above the 30 kPa threshold were all set to a value equal to the threshold so that the substrate appears as one solid uniform modulus (the white background). Areas where the modulus was above the threshold were generally areas of substrate, though there were occasional points on the cell included, most likely due to noise in position-deflection curves. Edges of cells appear darker in modulus maps, indicating that they had a higher elastic modulus than the center of the cells.
Figure 3.
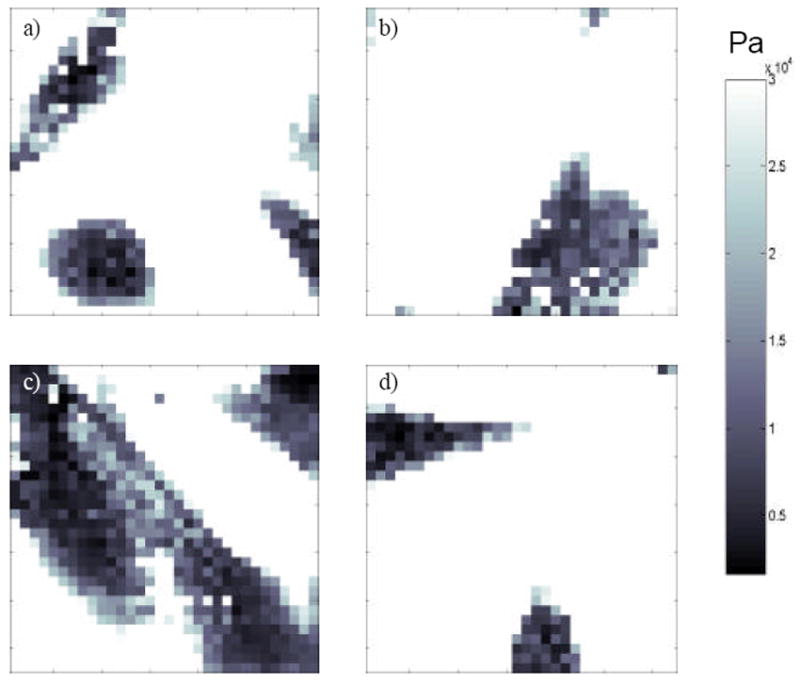
Quantitative elastic modulus map constructed from the same experiment as the height images shown in Figure 2, with plasma cleaned glass (a), flat polystyrene (b), 11 nm nanoislands (c) and 38 nm nanoislands (d). White pixels are those where the elastic modulus was over the threshold value of 30 kPa. Darker areas are regions with lower modulus values indicated by the scale bar that has a maximum value of 30 kPa.
A sampling of experimental compression curves for the cell regions were compared to theoretical force compression curves generated using the Hertz model (not shown). Data were found to fit quite well, showing R2 values greater than 0.97 for all of the substrates. It should also be noted that using only a small portion of the experimentally acquired curves corresponding to low amounts of compression (cell deformation less than 100 nm or ~5% of the cell height) did not show differences in modulus compared to modulus values obtained using the entire region of the compression curve (deformations of up to ~800 nm in some cases).
Figure 4 shows probability density functions of cell modulus obtained from each experiment (thin lines) and calculated overall density function (bold line, arithmetic mean). In calculating the overall density function, no weighting was used in the mean calculation because there was no priori reason to consider one experiment to be more representative of the substrate than any other experiment. On all of the nanotextured and flat surfaces, osteoblastic MC3T3-E1 cells displayed right-skewed modulus distribution functions. We note again that modulus values over 30 kPa mostly originated from the substrates.
Figure 4.
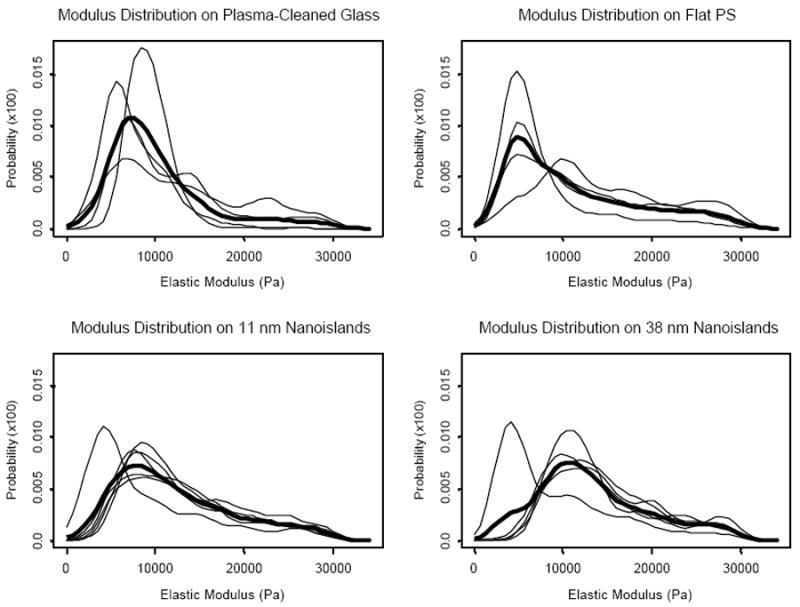
Probability density functions of MC3T3-E1 cell modulus for each indentation experiment (thin lines) and overall density function (bold line) calculated as an arithmetic mean of the densities at each distinct point (the x-axis of the plot).
The overall density functions for cells cultured on each substrate were plotted together in Figure 5. The mode modulus value was in the order of flat PS < plasma-cleaned glass ≈ 11 nm islands < 38 nm islands. Furthermore, while modulus values of cells cultured on flat surfaces are more heavily distributed towards the lower end of the distribution functions with lower elastic moduli, those on the two nanoisland surfaces are more heavily skewed towards the higher modulus ends. Cell modulus distribution between two flat controls also appeared to be different as surface chemistry was changed between polystyrene and glass.
Figure 5.
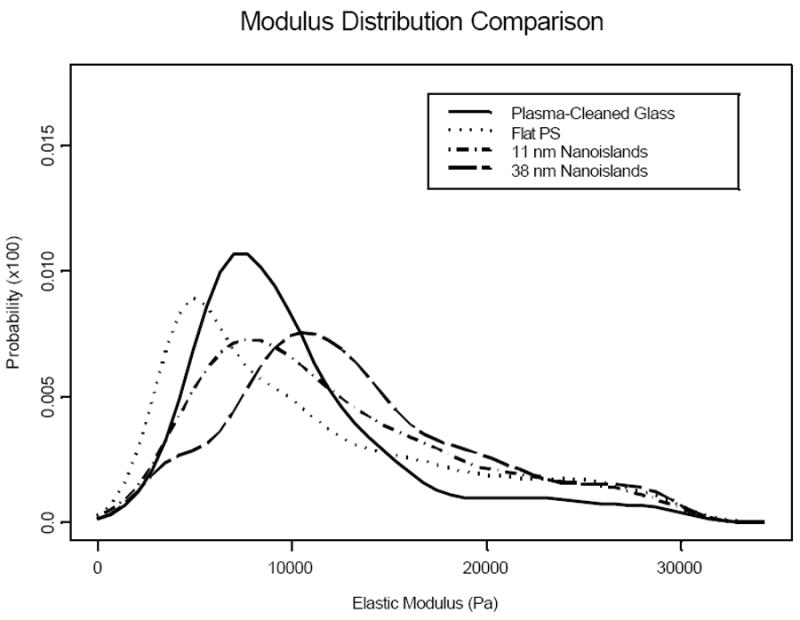
Overall cellular modulus distribution functions for MC3T3-E1 cells grown on each of the four surfaces. The cell modulus distributions on the two flat surfaces are shifted toward the lower values of the modulus, while those on the nanoisland surfaces are relatively more skewed towards the higher modulus values.
4. Discussion
Our results demonstrating differences in elastic modulus distribution in cells cultured on nanoisland surfaces compared to flat surfaces strongly suggest that nanoscale topography does have an effect on cell properties such that cells becoming stiffer as nanometer sized topography is added to the test substrates. The mode modulus values observed in this study, ranging from approximately 5000 Pa to 11000 Pa, were similar to those reported in previous studies using AFM. Takai et al. (Takai et al., 2005) reported modulus values ranging between 900-3500 Pa for MC3T3-E1 cells on various extracellular matrix proteins. Other published values include 2100 Pa for primary rat osteoblasts (Charras et al., 2001), 2100 to 8800 Pa for SAOS2 human osteosarcoma cells on Cobalt-Chromium, Titanium and Titanium-Vanadium substrates (Domke et al., 2000) and 200 to 300000 Pa for human bone marrow stromal cells on plastic surfaces or 3-aminopropyl-triethoxysilane grafted silica (Simon et al., 2003).
Our finding that the modulus distribution of osteoblastic cells on flat PS films is different from that on flat glass surfaces reveals that the surface chemistry may also affect the elastic modulus of cells cultured thereon, as was demonstrated in previous studies (Domke et al., 2000; Takai et al., 2005). The chemistry effect on cellular modulus distribution, however, appeared in this study not as great as the nanoscale topography effect.
The cellular mechanism involved in altered cell modulus on different surfaces is not known. One probable explanation is altered cytoskeletal structure in cells cultured on substrates with different surface characteristics. The concept of tensegrity has been used to model cytoskeletal structure (Ingber, 2003). In this model, microtubules and intermediate filaments form tensegrity structures as load bearing elements and tensile stiffeners, respectively. These units are anchored to the substrate by F-actin stress filaments acting as guy wires. Studies using cytoskeleton disruptors have demonstrated that various cytoskeletal components contribute differently to cell elasticity and mechanotransduction. For example, while the microtubular network plays an important role in the transduction of mechanical stimuli, F-actin appears not to be crucial in mechanotransduction (Charras and Horton, 2002). However, stressed F-actin fibers play a crucial role in modulating cell modulus, elasticity and maintenance of cell shape (Charras and Horton, 2002; Rotsch and Radmacher, 2000; Trickey et al., 2004). Observations that nanoscale topographies induce increased expression of actin stress fibers relative to flat surfaces (Ajubi et al., 1999; Dalby et al., 2006; Lim et al., 2005a) may thus explain the mechanism by which surface nanoscale roughness affects cellular modulus.
We observed increased modulus near the cell edges but the cause of this is unknown. Those differences could have a biological basis, such that the stiff actin filaments under the membrane contribute to the modulus to a greater extent (Rotsch et al., 1997) than the limited cytoplasm present at the thin edges. Alternatively, these measurements may be an artifact, with thin areas of the cell allowing the substrate to influence the modulus value.
We also considered the effect of cell confluence on elastic modulus. Since the edges of cells were generally stiffer than the center of the cells, if cell confluence was low there would be relatively more area of cell edge than if cell confluence was higher and cells were adjoining. The way in which the sample had to be placed into the AFM apparatus in this study limits available areas for measurement. This problem could potentially skew the elastic modulus distribution data, though it was not expected that this would affect the data interpretation to a large extent.
In summary, our results confirm the hypothesis that nanoscale topography affects the mechanical properties of individual cells and provides the basis for future examination of the relationship between cell mechanical properties and responsiveness to mechanical signals. Our findings suggest that nanoscale topography effects on bone cell behavior are at least partly the result of changes in cell compliance. Our data also suggest that altering nanoscale topography alters mechanical properties of osteoblastic cells, a result that may prove useful in developing novel biomaterials for bone tissue engineering protocols.
Acknowledgments
This work was supported by The Pennsylvania State Tobacco Settlement Formula Fund, The Pennsylvania State University Materials Research Institute and NIH AG13087-10.
Footnotes
Publisher's Disclaimer: This is a PDF file of an unedited manuscript that has been accepted for publication. As a service to our customers we are providing this early version of the manuscript. The manuscript will undergo copyediting, typesetting, and review of the resulting proof before it is published in its final citable form. Please note that during the production process errors maybe discovered which could affect the content, and all legal disclaimers that apply to the journal pertain.
References
- Affrossman S, Henn G, O’Neill SA, Pethrick RA, Stamm M. Surface topography and composition of deuterated polystyrene-poly(bromostyrene) blends. Macromolecules. 1996;29:5010–5016. [Google Scholar]
- Affrossman S, O’Neill SA, Stamm M. Topography and surface composition of thin films of blends of polystyrene with brominated polystyrenes: Effects of varying the degree of bromination and annealing. Macromolecules. 1998;31:6280–6288. [Google Scholar]
- Ajubi NE, Klein-Nulend J, Alblas MJ, Burger EH, Nijweide PJ. Signal transduction pathways involved in fluid flow-induced PGE2 production by cultured osteocytes. Am J Physiol. 1999;276:E171–178. doi: 10.1152/ajpendo.1999.276.1.E171. [DOI] [PubMed] [Google Scholar]
- Charras GT, Lehenkari PP, Horton MA. Atomic force microscopy can be used to mechanically stimulate osteoblasts and evaluate cellular strain distributions. Ultramicroscopy. 2001;86:85–95. doi: 10.1016/s0304-3991(00)00076-0. [DOI] [PubMed] [Google Scholar]
- Charras GT, Horton MA. Single cell mechanotransduction and its modulation analyzed by atomic force microscope indentation. Biophys J. 2002;82:2970–2981. doi: 10.1016/S0006-3495(02)75638-5. [DOI] [PMC free article] [PubMed] [Google Scholar]
- Chizhik SA, Huang Z, Gorbunov VV, Myshkin NK, Tsukruk VV. Micromechanical properties of elastic polymeric materials as probed by scanning force microscopy. Langmuir. 1998;14:2606–2609. [Google Scholar]
- Craig VSJ, Neto C. In situ calibration of colloid probe cantilevers in force microscopy: Hydrodynamic drag on a sphere approaching a wall. Langmuir. 2001;17:6018–6022. [Google Scholar]
- Dalby MJ, Yarwood SJ, Riehle MO, Johnstone HJ, Affrossman S, Curtis AS. Increasing fibroblast response to materials using nanotopography: morphological and genetic measurements of cell response to 13-nm-high polymer demixed islands. Exp Cell Res. 2002;276:1–9. doi: 10.1006/excr.2002.5498. [DOI] [PubMed] [Google Scholar]
- Dalby MJ, McCloy D, Robertson M, Agheli H, Sutherland D, Affrossman S, Oreffo RO. Osteoprogenitor response to semi-ordered and random nanotopographies. Biomaterials. 2006;27:2980–2987. doi: 10.1016/j.biomaterials.2006.01.010. [DOI] [PubMed] [Google Scholar]
- Domke J, Dannohl S, Parak WJ, Muller O, Aicher WK, Radmacher M. Substrate dependent differences in morphology and elasticity of living osteoblasts investigated by atomic force microscopy. Colloids Surf B Biointerfaces. 2000;19:367–379. doi: 10.1016/s0927-7765(00)00145-4. [DOI] [PubMed] [Google Scholar]
- Ingber DE. Tensegrity I. Cell structure and hierarchical systems biology. J Cell Sci. 2003;116:1157–1173. doi: 10.1242/jcs.00359. [DOI] [PubMed] [Google Scholar]
- Lim JY, Hansen JC, Siedlecki CA, Runt J, Donahue HJ. Human foetal osteoblastic cell response to polymer-demixed nanotopographic interfaces. J R Soc Interface. 2005a;2:97–108. doi: 10.1098/rsif.2004.0019. [DOI] [PMC free article] [PubMed] [Google Scholar]
- Lim JY, Hansen JC, Siedlecki CA, Hengstebeck RW, Cheng J, Winograd N, Donahue HJ. Osteoblast adhesion on poly(L-lactic acid)/polystyrene demixed thin film blends: effect of nanotopography, surface chemistry, and wettability. Biomacromolecules. 2005b;6:3319–3327. doi: 10.1021/bm0503423. [DOI] [PubMed] [Google Scholar]
- Lim JY, Dreiss AD, Zhou Z, Hansen JC, Siedlecki CA, Hengstebeck RW, Cheng J, Winograd N, Donahue HJ. The regulation of integrin mediated osteoblast focal adhesion and focal adhesion kinase expression by nanoscale topography. Biomaterials. 2007;28:1787–1797. doi: 10.1016/j.biomaterials.2006.12.020. [DOI] [PubMed] [Google Scholar]
- Palin E, Liu H, Webster TJ. Mimicking the nanofeatures of bone increases bone-forming cell adhesion and proliferation. Nanotechnology. 2005;16:1828–1835. [Google Scholar]
- Rotsch C, Braet F, Wisse E, Radmacher M. AFM imaging and elasticity measurements on living rat liver macrophages. Cell Biol Int. 1997;21:685–596. doi: 10.1006/cbir.1997.0213. [DOI] [PubMed] [Google Scholar]
- Rotsch C, Radmacher M. Drug-induced changes of cytoskeletal structure and mechanics in fibroblasts: an atomic force microscopy study. Biophys J. 2000;78:520–535. doi: 10.1016/S0006-3495(00)76614-8. [DOI] [PMC free article] [PubMed] [Google Scholar]
- Sato M, Theret DP, Wheeler LT, Ohshima N, Nerem RM. Application of the micropipette technique to the measurement of cultured porcine aortic endothelial cell viscoelastic properties. J Biomech Eng. 1990;112:263–268. doi: 10.1115/1.2891183. [DOI] [PubMed] [Google Scholar]
- Simon A, Cohen-Bouhacina T, Porte MC, Aime JP, Amedee J, Bareille R, Baquey C. Characterization of dynamic cellular adhesion of osteoblasts using atomic force microscopy. Cytometry A. 2003;54:36–47. doi: 10.1002/cyto.a.10052. [DOI] [PubMed] [Google Scholar]
- Takai E, Costa KD, Shaheen A, Hung CT, Guo XE. Osteoblast elastic modulus measured by atomic force microscopy is substrate dependent. Ann Biomed Eng. 2005;33:963–971. doi: 10.1007/s10439-005-3555-3. [DOI] [PubMed] [Google Scholar]
- Takai E, Landesberg R, Katz RW, Hung CT, Guo XE. Substrate modulation of osteoblast adhesion strength, focal adhesion kinase activation, and responsiveness to mechanical stimuli. Mol Cell Biomech. 2006;3:1–12. [PubMed] [Google Scholar]
- Trickey WR, Vail TP, Guilak F. The role of the cytoskeleton in the viscoelastic properties of human articular chondrocytes. J Orthop Res. 2004;22:131–139. doi: 10.1016/S0736-0266(03)00150-5. [DOI] [PubMed] [Google Scholar]


