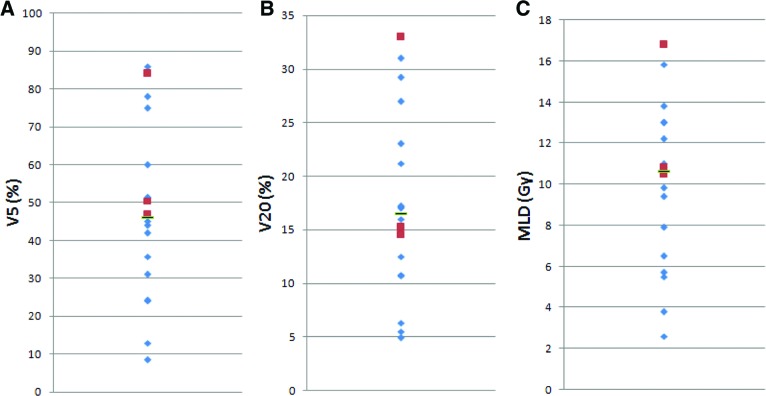
Figure 1.
Dose-volume histogram data for 18 patients, including percentage of irradiated volume >5 Gy (V5) (A), percentage of irradiated volume >20 Gy (V20) (B), and mean lung dose (MLD) (C). Indicated are the median (black bar), along with individual values for the 15 patients who did not have postoperative respiratory failure (blue diamonds) and the three patients who did have postoperative respiratory failure (red squares).

