Abstract
Magnetic resonance imaging (MRI) contrast agents represent a worldwide billion-dollar market annually. While T1 relaxivity enhancement contrast agents receive greater attention and a significantly larger market share, the commercial potential for T2 relaxivity enhancing contrast agents remains a viable diagnostic option due to their increased relaxivity at high field strengths. Improving the contrast and biocompatibility of T2 MRI probes may enable new diagnostic prospects for MRI. Paramagnetic lanthanides have the potential to decrease T1 and T2 proton relaxation times, but are not commercially used in MRI diagnostics as T2 agents. In this article, oxygen donor chelates (hydroxypyridinone, HOPO, and terephthalamide, TAM) of various lanthanides are demonstrated as biocompatible macromolecular dendrimer conjugates for the development of T2 MRI probes. These conjugates have relaxivities up to 374 mm−1s−1 per dendrimer, high bioavailability, and low in vitro toxicity.
Keywords: MRI Probes, Lanthanides, Dendrimers, T2 Contrast Agent, Conjugation
Introduction
Magnetic Resonance Imaging (MRI) is the leading soft tissue diagnostic imaging technique due to its unparalleled ability to generate high resolution three dimensional in vivo images.1, 2 In addition, MRI, considered a noninvasive technique, uses biologically benign1–4 radio frequencies rather than potentially harmful X-rays such as those employed for CAT (Computerized Axial Tomography) scans. Current GdIII contrast agents (CA) based on longitudinal spin-lattice relaxation time, T1, dominate use in the clinic.1, 2 Recently, more emphasis is being placed on the necessity of developing CAs with greater relaxivities to reduce the quantity of GdIII-CAs administered for MRI diagnostics, resulting from concerns that GdIII is not safe for all patients, the threat of limited access to large quantities of GdIII, and environmental accumulation of GdIII. CAs based on the transverse spin-spin relaxation time, T2, could allow for the development of targeted imaging and alternative diagnostic agents.1–4
All T1 commercial contrast agents suffer a decrease in efficiency at higher field strengths,2 which is a liability as clinical instruments increase in magnetic field strength to enhance inherent instrument contrast. Many MRI’s in the clinic have reached 60 to 125 MHz to increase resolution, but at the cost of diminishing the efficacy of the contrast agent injected.2, 3 To counteract the increase in field strength, increasing dosage is required to maintain current levels of contrast, however, gram quantities of T1 contrast agents must already be injected to overcome low sensitivity. Therefore, alternative options need to be explored and developed, both improving T1 relaxivity and providing an alternative such as an effective T2 CA.2
In contrast to T1 imaging agents, the T2 agents exhibit a direct correlation between increasing field strength and relaxivity,1 and as a result they improve contrast at the larger field strengths now seen in the clinic. This relationship, combined with increasingly powerful magnets used for MRIs, suggests that over time T2 agents may emerge as a more thoroughly studied and highly developed class of MRI-CAs. The development of T2 targeted imaging for MRI will require higher relaxivities than are currently attained if this approach is to be realized for diagnostic medicine.3 High relaxivity at physiological conditions and 60 – 100 MHz, combined with adequate synthetic functionality and versatility, would allow conjugation of various targeting molecules such as antibodies, proteins or targeting ligands and enable the development of a new generation of MRI agents capable of site selective delivery.1
Currently, T2 commercial contrast agents are primarily superparamagnetic iron oxide nanoparticles (SPION). Current SPION’s are unsuitable for targeted imaging and bioresponsive mechanisms. In addition, SPION’s have not responded to investigations into advanced applications such as tumor targeting and the tracking of stem cells.1
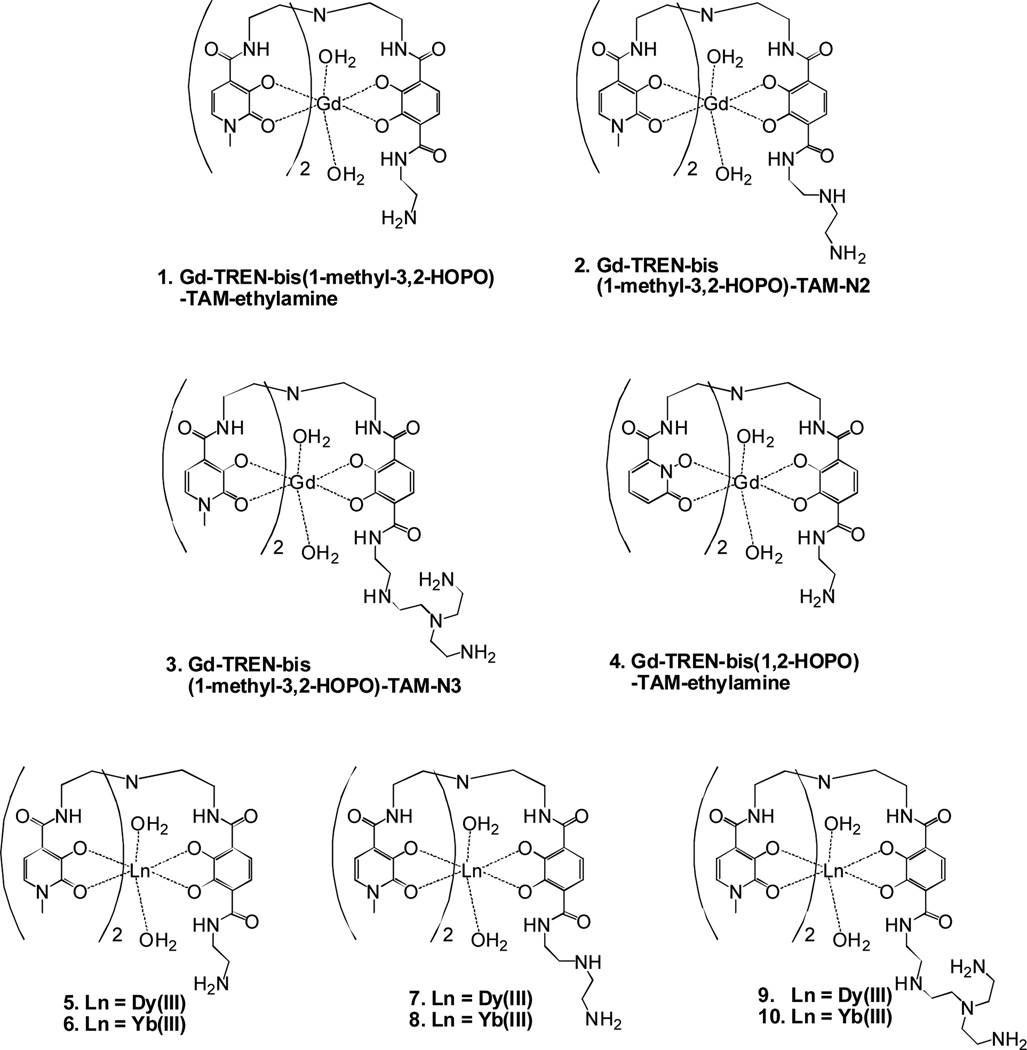
In this laboratory, GdIII complexes have been developed only for enhanced T1 relaxivities compared to current commercial agents.5, 6 These include Gd-TREN-bis(1-methyl-3,2-HOPO)-TAM-ethylamine (1), Gd-TREN-bis(1-methyl-3,2-HOPO)-TAM-N2 (2), Gd-TREN-bis(1-methyl-3,2-HOPO)-TAM-N3 (3), and Gd-TREN-bis(1,2-HOPO)-TAM-ethylamine (4) (Figure 1). Compared to commercial agents such as Gd-DOTA (Gd-1,4,7,10-tetraazacyclododecane-1,4,7,10-tetraacetic acid) and Gd-DTPA (Gd-diethylenetriaminepentaacetic acid), the Gd-HOPO (Gd-tris-hydroxypyridinone) hexadentate oxygen donor chelators used in our studies increase relaxivity through fast water exchange via an associative water exchange mechanism, large numbers of inner-sphere water molecules (q), and the ability to conjugate to a macromolecule to decrease molecular tumbling time.7–10 As these parameters increase both r2 and r1, this research provides LnIII complexes desirable T2 relativities as well. For r1(1-Me)-3,2-HOPO chelators have outperformed the corresponding (1,2)-HOPO chelators in every comparison study.5–10 To investigate the feasibility of using alternate lanthanides for T2 imaging, YbIII and DyIII based agents, Dy-TREN-bis(1-methyl-3,2-HOPO)-TAM-ethylamine (5), Yb-TREN-bis(1-methyl-3,2-HOPO)-TAM-ethylamine (6), Dy-TREN-bis(1-methyl-3,2-HOPO)-TAM-N2 (7), Yb-TREN-bis(1-methyl-3,2-HOPO)-TAM-N2 (8), Dy-TREN-bis(1-methyl-3,2-HOPO)-TAM-N3 (9), and Yb-TREN-bis(1-methyl-3,2-HOPO)-TAM-N3 (10), were also synthesized and evaluated as dendrimer conjugates. YbIII has potential as a bimodal imaging agent as a T2 MRI contrast agent and a near infrared probe in biological systems. DyIII has been shown to be a prospective cerebral perfusion agent, superior to GdIII and therefore should be explored as a specific MRI diagnostic analysis. In addition to varying the lanthanide used in these complexes, they were also varied by the amine linking appendage used to attach the complex to the dendrimer. These linkers vary in length and rigidity, as well as the potential coordinating environment surrounding the lanthanide.
Figure 1.
GdIII DyIII and YbIII contrast agents with fast water exchange, high q values, and high thermodynamic stability.
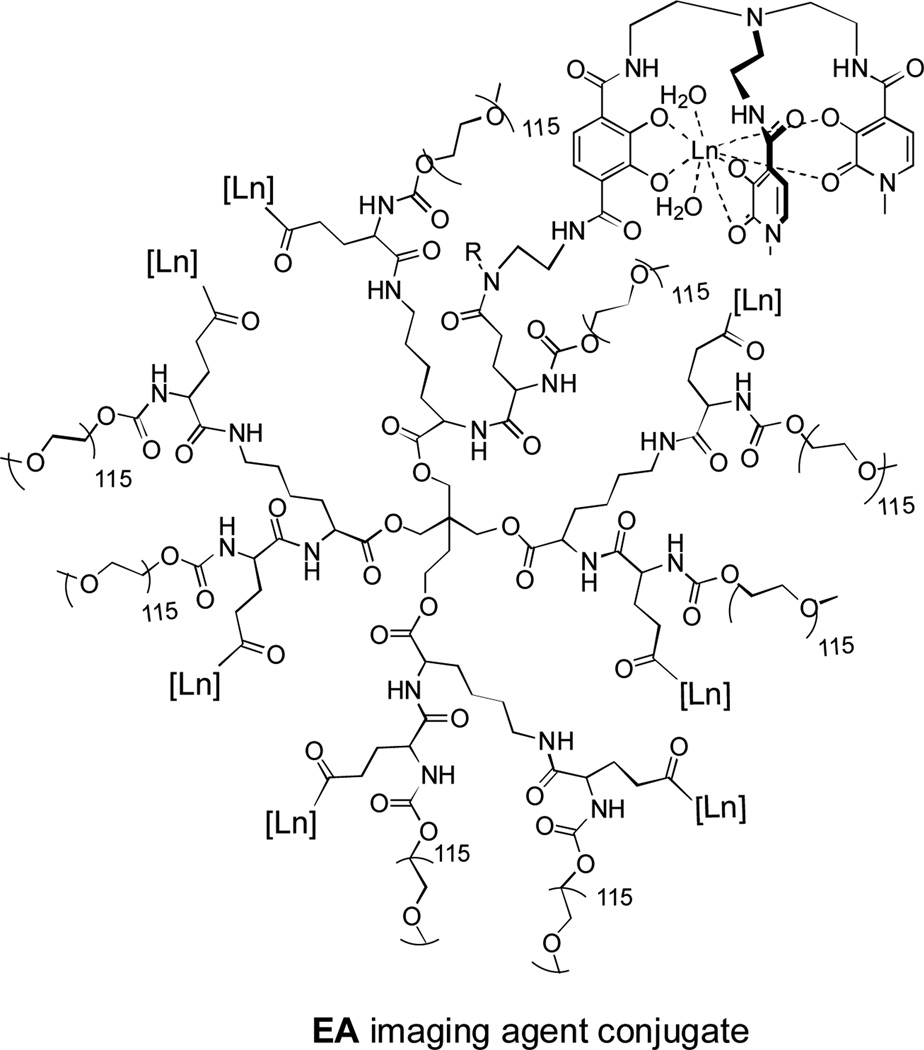
High T1 relaxivities have been previously achieved through conjugation to various macromolecular carriers such as dendrimers,11, 12 viral capsids,13 nanoparticles,14 and nanodiamonds.15 This conjugation can not only bring about improvements in solubility and biocompatibility for the selected CA, but can also reduce the molecular motion of the agent in solution. This, in turn, causes an enhancement in the agent’s relaxivity, which increases its performance producing contrast. Dendrimers developed in the Fréchet group (Figure 2) exhibit high biocompatibility and solubility, biodegradability, as well as a practical and scalable synthesis.16–17 These dendrimers consist of a branched core, from which multiple copies of an imaging agent and eight 5 kDa polyethylene glycol (PEG) chains radiate outwards. The poly-l-lysine (PLL) based dendrimer (Figure 2, bottom structure) contains a moderately branched hydrophilic amide core, and provides a highly resilient platform for agent delivery. The esteramide (EA) dendrimer (Figure 2, top structure) contains a highly compact core with both ester and amide bonds. The ester bonds are incorporated to allow for more rapid biodegradability and expedite the synthesis. Due to their diminished hydrogen bonding with water compared to amide bonds, this core is expected to be slightly less hydrophilic than the PLL dendrimer’s interior. The PEG chains radiating out from the core increase solubility of these conjugates in vivo and prevent the agent from interacting with the surrounding biological environment.18 Due to a phenomenon known as the enhanced permeation and retention (EPR) effect,19 which takes advantage of the increased permeability of the vasculature and decreased efficiency of the lymphatic system in well formed tumors, these macromolecules can also passively accumulate in tumors at levels up to 10–15% of the dose per gram of tumor tissue.20 This may enable these conjugates to outperform small (< 1000 Da) molecules in the imaging of tumors, and prove valuable in the imaging and diagnosis of some cancers. These macromolecules also remain in the blood at high levels for much longer than small molecules, enabling more time for MRI scans to be carried out.16–17 Since the performance of MRI contrast agents improves upon the slowing of molecular motion, the large size and imposing steric environments of these dendrimers are also observed to substantially increase agent relaxivities to several times that of the free complex. In this study, we present T2 MRI probes with no observed cultured cell toxicity, high biocompatibility, and high T2 relaxivity.
Figure 2.
The Poly-l-lysine based dendrimer (PLL) used for conjugation to 1. Like the EA dendrimer, this dendrimer is about 40 kDa in molecular weight and contains eight loading sites for covalent conjugation to GdIII - complexes. Both dendrimers have shown no toxicity and highly soluble in biological environments.16
Results and Discussion
Synthesis
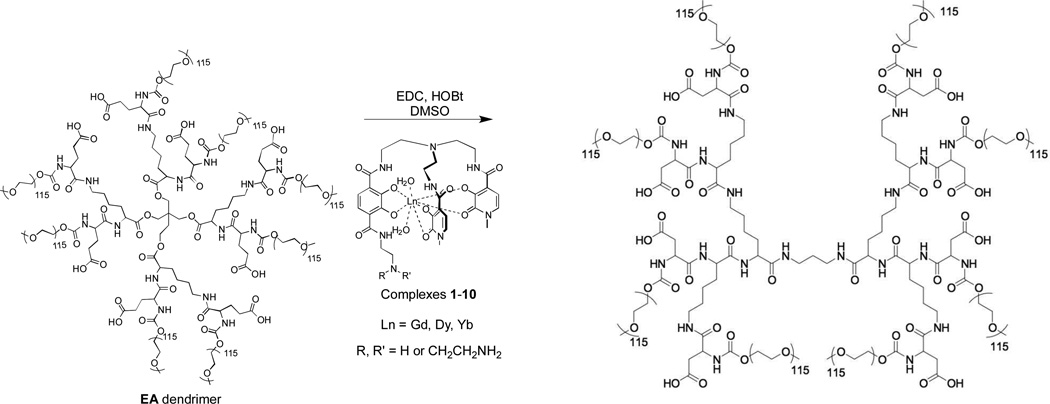
Ligands of complexes 5–10 (Figure 1) were synthesized according to preparation of previously reported ligands.5 The trichloride salts of the lanthanide metals were used for complexation (see Supporting Information for details). Metallated complexes were conjugated through their amine side chains to the acid functionalities of the dendrimers using carbodiimide coupling chemistry (Scheme 1). Due to differences in the amine side chains and solubilities of the complexes, coupling yields to the dendrimer (Table 1) vary substantially between the complexes. Fortunately, coupling yields for higher performing complexes tend to be closer to or at the theoretical maximum of eight complexes per dendrimer, although a strict correlation is not observed. Coupling yields also appear to be dependent on complex solubility, as some of these are sparingly soluble even in DMSO. It is also possible that some of these complexes possess metal-amine or other intermolecular bonding, which could attenuate the nucleophilicity of the side chain amines.
Scheme 1.
Metalated EA dendrimer conjugates were synthesized through carbodiimide coupling with the precomplexed ligand in DMSO. Coupling to the PLL dendrimer was carried out similarly.
Table 1.
Comparison of the per lanthanide T2 relaxivity (mm−1s−1) of the prototypes measured in this study at physiological conditions (37.0 °C, 60 MHz) with associated error (in parentheses), as well as the average complex loading per dendrimer and resulting total relaxivity per dendrimer.
| Conjugate |
T2 relaxivity/ ionic (mm−1s−1) |
Complexes/ Dendrimer |
T2 relaxivity/ dendrimer (mm−1s−1) |
|---|---|---|---|
| 1:EA | 42.4(16) | 6 | 254.4 |
| 2:EA | 35.1(4) | 2.9 | 101.79 |
| 3:EA | 23.4(4) | 3 | 70.2 |
| 4:EA | 46.8(8) | 8 | 374.4 |
| 5:EA | 14.1(4) | 6 | 84.6 |
| 6:EA | 23.0(2) | 2 | 46 |
| 7:EA | 5.5(4) | 5 | 27.5 |
| 8:EA | 12.2(12) | 7 | 85.4 |
| 9:EA | 2.2(1) | <1 | <2.2 |
| 10:EA | 5.6(8) | 6 | 33.6 |
| 1:PLL | 38.1(6) | 4.5 | 171.45 |
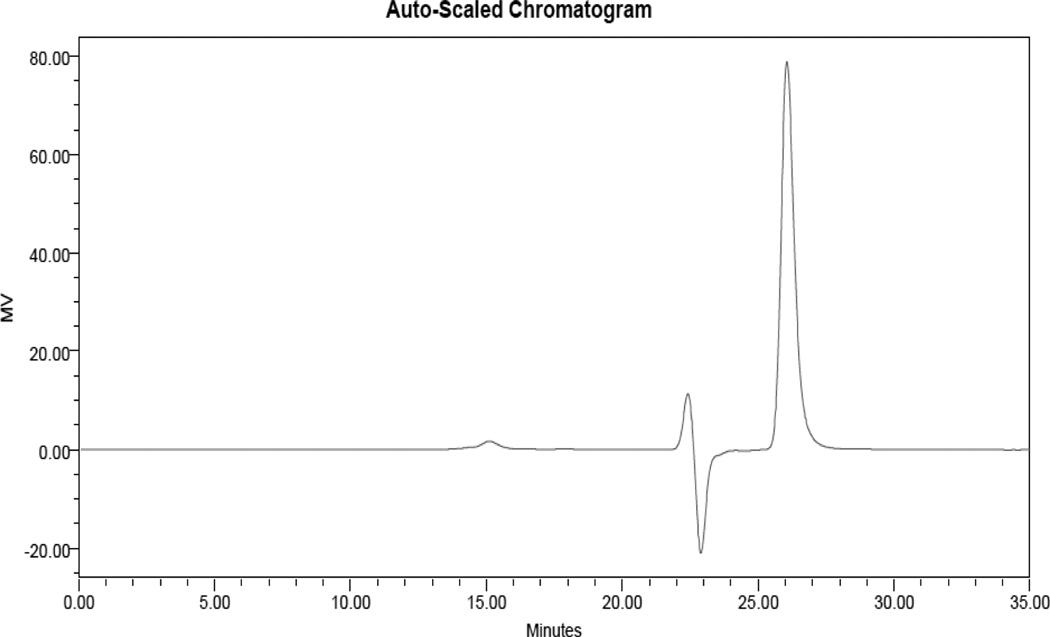
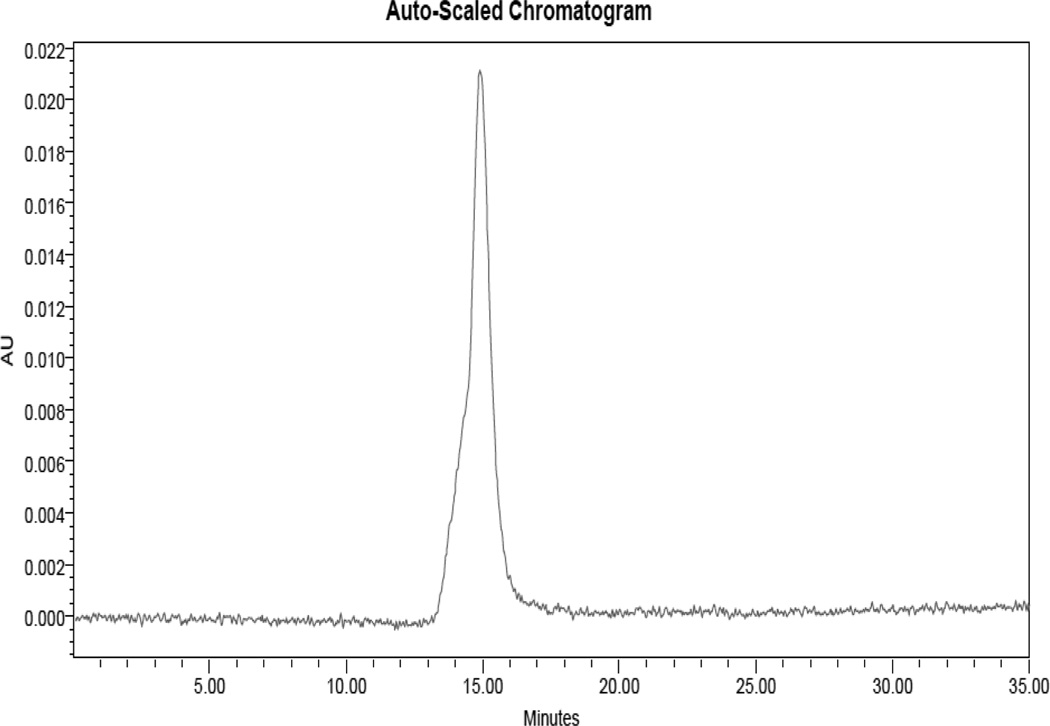
Conjugates were characterized by size exclusion chromatography (SEC), DLS, relaxivity measurements and inductively coupled plasma optical emission spectroscopy (ICP-OES), which are available for every conjugate in the Supporting Information. SEC showed that while the dendrimer itself has no UV activity, after conjugation to metal complexes UV peaks corresponding to a 40 kDa polymer are observed. The UV peaks of the complexes are also observed to migrate from the small molecule region (22–28 minutes, data not shown) to a region corresponding to a 40 kDa macromolecule (15 minutes) upon conjugation to the polymer, although an oscillating system peak (21–24 min) and toluene reference peak (26 minutes) are still observed. The UV-active polymer peak also corresponds to the refractive index (RI) trace of the polymer (Figures 4 and 5). A peak observed at 18 minutes corresponding to a 5 kDa polymer can also be observed in the RI traces, and this corresponds to a small amount of linear PEG remaining from dendrimer synthesis. The end groups of this PEG are capped (to render it inert) before introduction of the metal chelates, which prohibits the PEG from interfering with coupling reactions.
Figure 4.
RI Trace of 8:EA. The polymeric conjugate appears at 15 minutes. The toluene reference peak (26 minutes) and system peak oscillation (22–24 min.) are also visible.
Figure 5.
UV-Vis trace of 8:EA. A large molecular weight molecule (15 minutes, corresponding to 40 kDa) is UV active, indicating conjugation of the HOPO-TAM ligands to the non-UV active dendrimer. Given the binding affinity of the N2 ligand to YbIII, this serves as a strong indication that the multiple N1 complexes are bound to the dendrimer, which can be quantified by peak area and separately confirmed by ICP-OES.
Relaxivity
T2 relaxivity was evaluated in a 1.41 T (60 MHz) relaxometer at 37.0 °C to ensure clinically relevant conditions were used for analysis. Accounting for diamagnetic solvent character, per LnIII relaxivity was determined by the equation 1/Ti,obs = 1/Ti,d + ri [m] (i = 1, 2). From the relaxation time (T1 or T2) observed (s−1) via water relaxivity, the relaxation time of the solvent (s−1) was subtracted. The concentration of the metal (µmol) was determined precisely by inductively coupled plasma-optical emission spectroscopy (ICP-OES) on each sample. Relaxivity (r1 for T1 relaxivity; r2 for T2 relaxivity) is therefore reported in mm −1s−1.
While high relaxivities are reported for T2 (Table 1), trends for T2 relaxivity did not follow those for T1 relaxivity. The HOPO – esteramide dendrimer conjugates show remarkably short T2 relaxation times. The r2 of the Gd-TREN-bis-1,2-HOPO-TAM-ethylamine esteramide dendrimer complex (4:EA) was the largest reported in this study, with per dendrimer relaxivity of 374 mm −1s−1. In previous work, the 1,2-HOPO complexes have been inferior to the (1-Me)-3,2-HOPO for T1 imaging regardless of the chelator linking cap, other functionalizing, or solubilizing moieties attached.5–10 However, T2 is more dependent on the outer-sphere water molecule interactions than T1,1, 3 favoring the 1,2-HOPO complex. This is because due to changes in pKa values between the 1,2-HOPO and the (1-Me)-3,2-HOPO, outer-sphere water interactions are more favorable in the 1,2-HOPO as opposed to the (1-Me)-3,2-HOPO. This same phenomenon, the impact of pKa on outer-sphere interactions, has been observed by measuring entropic considerations of proline by infrared photodissociation (IRPD) spectroscopy and kinetics.18 The 1,2-HOPO conjugate has a further advantage for T2 imaging due to its having a lower T1 relaxivity (r1) and then a higher T2 relaxivity (r2), giving a large ratio of relaxivities, r2/r1. Given that tissues inherently have a shorter T1 than T2, T2 agents with significant r2/r1 ratio can be beneficial using certain pulse sequences in the clinic.
Due to their decreased paramagnetic character, DyIII and YbIII TREN-bis-(1-Methyl-3,2)-HOPO-TAM complexes (5:EA, 7:EA, 9:EA and 6:EA, 8:EA, 10:EA) conjugated to the EA dendrimer did not produce r2 values as high as those obtained from comparable GdIII complexes. The HOPO agents developed in this study are still of interest for alternative imaging properties as DyIII has potential as a cerebral perfusion imaging agent21, 22 and YbIII has potential as a bimodal T2 and near infrared imaging agent, allowing for the simultaneous imaging of tissue by two independent methods. DyIII has the ability to transiently influence lingering magnetic susceptibility of tissues as it travels through the body, which could provide an interesting alternative to using iron oxide nanoparticles as agents of magnetic susceptibility. Generally YbIII-HOPO agents preformed better than DyIII-HOPO MRI-CAs (Table 1). Due to its near IR imaging capabilities,23–24 YbIII has potential for imaging of tumors being surgically removed, as these are often close to the tissue surface during this process. Additionally, with low r1 values, these complexes have a much larger r2/r1 ratio, than that of GdIII complexes.
Cytotoxicity
Suitability of conjugates for further testing as potential contrast agents was determined by cultured cell cytotoxicity studies by MTT assay. Up to 5.0 mg/mL (0.2 mm GdIII), the highest concentration evaluated, cytotoxicity was not observed to HeLa cells over 72 h at 37.0 °C and 5 % CO2. he esteramide and polylysine dendrimers have exhibited low toxicity in mice22 and have excellent biocompatibility and high solubility. Biodistribution has been conducted on Gd-TREN-bis-3,2-HOPO-TAM moieties with similar functionalities25 and produces satisfactory results for suitability as an injectable MRI contrast agent.
Conclusions
T1 MRI is currently a more commonly employed imaging modality than T2 in the medical field. However, due to changes in field strength and toxicity concerns, T2 contrast agents have the potential and cause for further development. In this work we have described the synthesis of dendrimer based T2 lanthanide MRI probes with high biocompatibility and relaxivity values. Due to the high relaxivities obtained, these agents may be promising candidates for future investigation into lanthanide T2 imaging.
Experimental Section
General Considerations
Unless otherwise noted, starting materials were obtained from commercial suppliers and used without further purification. All organic solvents were stored over 4 Å molecular sieves. Water was distilled and further purified by a Millipore cartridge system. All organic extracts were dried over anhydrous MgSO4 and solvents removed in vacuo. Flash chromatography was performed on Merck Silica Gel (40-7 Mesh). Ion exchange chromatography was done on Phenomenex Strata X-C prepacked columns (pore size 85 Å, particle size 33 µm). 1H and 13C NMR spectra were recorded on a Bruker AVQ 400 at 400 MHz and 100 MHz, respectively or a DRX 500 at 500 MHz; the residual solvent peak was used as an internal reference. Elemental analysis and mass spectra (HR = high resolution; ESI-MS = electrospray ionization mass spectrometry) were performed by the Microanalytical Laboratory and Mass Spectrometry Laboratory, respectively, at the College of Chemistry at the University of California at Berkeley. Prep-HPLC was done on a Varian Prep HPLC system using a Varian super-prep C18 column (Dynamax C18, 41.4 × 250 mm, 10 µm particle size). All synthetic reactions were performed in an atmosphere of nitrogen, unless otherwise noted.
Esteramide (EA) and PLLG2(Asp(COOH)PEO)8 Polylysine (PLL) Dendrimer Synthesis
(Figure 2) Synthesized as was previously reported.16a
1–4. Gd-TREN Complex Synthesis
Gd-TREN-bis(1-Me-3,2-HOPO)-TAM-Ethylamine (N1), Gd-TREN-bis(1-Me-3,2-HOPO)-TAME-thylamine-ethylamine , (N2)Gd-TREN-bis(1-Me-3,2-HOPO)-TAME-thylamine-bisethylamine (N3) and Gd-TREN-bis(1,2)HOPO-TAM-Ethylamine (1,2HP) were synthesized as previously reported.5,6
5
10. mg of TREN-bis(1-Me)-3,2-HOPO-TAM-ethylamine (0.0615 mmol, 1 eq.) was dissolved in 0.308 mL of 0.05 m DyCl3 (1 eq.) in methanol and 1% TEA. This reaction was refluxed for three h, and was recrystallized three times in diethyl ether. Excess solvent was removed in vacuo. [DyC30H33N8O10]−. Charge −1. Neg. Mode MS-ESI m/z = 829.1613 (Calc. 829.1612).
6
10. mg of TREN-bis(1-Me)-3,2-HOPO-TAM-ethylamine (0.0578 mmol, 1 eq.) was dissolved in 0.290 mL of 0.05 m YbCl3 (1 eq.) in methanol and 1% triethylamine (TEA). This reaction was refluxed for three h, and was recrystallized three times in diethyl ether. Excess solvent was removed in vacuo. [C30H33N8O10Yb]−. Charge: −1. Neg. Mode ESI-MS m/z = 839.1716 (calc. 839.1711).
7
10. mg of TREN-bis(1-Me)-3,2-HOPO-TAM-ethylamine-ethylamine (0.0615 mmol, 1 eq.) was dissolved in 0.308 mL of 0.05 m DyCl3 (1 eq.) in methanol and 1% TEA. This reaction was refluxed for 3 h, and was recrystallized three times in diethyl ether. Excess solvent was removed in vacuo. [DyC32H38N9O10]−. Charge −1. Neg. Mode MS-ESI m/z = 872.2032 (Calc. 872.2033).
8
10. mg of TREN-bis(1-Me)-3,2-HOPO-TAM-ethylamine-ethylamine (0.0578 mmol, 1 eq.) was dissolved in 0.290 mL of 0.05 m YbCl3 (1 eq.) in methanol and 1% TEA. This reaction was refluxed for 3 h, and was recrystallized three times in diethyl ether. Excess solvent was removed in vacuo. [YbC32H39N9O10]−. Charge: −1. Neg. Mode MS-ESI m/z = 883.2193 (calc. 883.2208).
9
10. mg of TREN-bis(1-Me)-3,2-HOPO-TAM-ethylamine-bisethylamine (0.0615 mmol, 1 eq.) was dissolved in 0.308 mL of 0.05 m DyCl3 (1 eq.) in methanol and 1% TEA. This reaction was refluxed for 3 h, and was recrystallized three times in diethyl ether. Excess solvent was removed in vacuo. [DyC34H44N10O10]−. Charge −1. Neg. Mode MS-ESI m/z = 916.2544 (Calc. 916.2534).
10
10. mg of TREN-bis(1-Me)-3,2-HOPO-TAM-ethylamine-bisethylamine (0.0578 mmol, 1 eq.) was dissolved in 0.290 mL of 0.05 m YbCl3 (1 eq.) in methanol and 1% TEA. This reaction was refluxed for 3 h, and was recrystallized three times in diethyl ether. Excess solvent was removed in vacuo. [YbC34H44N10O10]−. Charge: −1. Neg. Mode MS-ESI m/z = 926.2605 (calc. 926.2630)
Dynamic light scattering (DLS)
DLS determined hydrodynamic size and was performed at 25 °C by dissolving samples in 1X PBS buffer to a concentration of approximately 1 mg/mL. After brief vortexing the samples were filtered over 0.45 µm PTFE filters to remove dust and added to a 0.45 µL quartz cuvette and analyzed using a Zetasizer Nanoseries ZS (Malvern Instruments, UK). Results were repeated in triplicate with averages reported.
Size Exclusion Chromatography (SEC)
The SEC system consisted of two SDV Linear S (5 µm) columns (Polymer Standards Service, 300 × 8 mm) using DMF with 0.2 % LiBr as the mobile phase (1 mL/min) in series with a Waters 515 pump, 717 autosampler, 996 Photodiode Array Detector (210–600 nm), and 2414 differential refractive index detector. Sample volumes were 100 µL and UV spectra were viewed at 350 nm. Molecular weight calibrations for RI spectra were made using linear polyethylene glycol standards with toluene as a reference peak. Complex loading was quantified by comparing polymer peak integrals in UV spectra with a calibration curve obtained from spectra of known quantities of ligand dissolved in DMF and run under identical conditions.
1:EA and 1:PLL, 2:EA and 4:EA
conjugates were synthesized as reported.12 Briefly, the dendrimer and Gd complex 1 (1.2 eq. per dendrimer carboxylic acid) were combined in a 25 mL reaction vial and dissolved in DMSO. HOBt, NHS and EDC were then added and the reaction was allowed to stir overnight. The polymeric conjugate was then isolated by precipitation in ether and purified by PD-10 size exclusion chromatography. After lyophilization the desired was obtained as an off-white solid.
Yb-TREN-Dendrimer Conjugation Synthesis
6:EA
To a 25 mL scintillation vial containing 1 mg (0.011 mmol, 1.1 eq.) of metal complex 6 was added 5 mg (0.001 mmol by carboxylic acid) of EA dendrimer. To this was added 1 mg (0.008 mmol, 9 eq.) each of N-hydroxysuccinimide (NHS) and hydroxybenzotriazole (HOBt). The solids were dissolved in 0.5 mL DMSO and 1 mg (0.005 mmol, 5 eq.) of EDC (EDAC or EDCI, 1-ethyl-3-(3-dimethylaminopropyl) carbodiimide) was added and the reaction was allowed to stir overnight at room temperature. After overnight stirring, the solvent was removed in vacuo and solids were taken into 5 mL DCM. After filtering solids through a 0.45 µm PTFE (polytetrafluoroethylene) filter the solution was precipitated by addition to 100 mL diethyl ether (anhydrous) to give a light yellow solid. The solids were isolated by centrifugation and residual impurities were removed using a PD-10 size exclusion column to give 3 mg (60 %) of conjugate 6:EA as a yellow solid.
8:EA
To a 25 mL scintillation vial containing 1.4 mg (0.0015 mmol, 1.4 eq.) of metal complex 8 was added 5.5 mg (0.0011 mmol by carboxylic acid) of EA dendrimer. To this was added 0.75 mg (0.0065 mmol, 6.5 eq.) each of NHS and HOBt. The solids were dissolved in 0.5 mL DMSO and 1.5 mg (0.0078 mmol, 7.8 eq.) of EDC was added and the reaction was allowed to stir overnight at room temperature. After overnight stirring, the solvent was removed in vacuo and solids were taken into 5 mL DCM. After filtering solids through a 0.45 µm PTFE filter the solution was precipitated by addition to 100 mL diethyl ether (anhydrous) to give a light yellow solid. The solids were isolated by centrifugation and residual impurities were removed using a PD-10 size exclusion column to give 5.2 mg (91 %) of conjugate 8:EA as a yellow solid.
10:EA
To a 25 mL scintillation vial containing 2.6 mg (0.0028 mmol, 1.2 eq.) of metal complex 10 was added 11.5 mg (0.0023 mmol by carboxylic acid) of EA dendrimer. To this was added 1.5 mg (0.005 mmol, 5 eq.) each of NHS and HOBt. The solids were dissolved in 0.5 mL DMSO and 2.4 mg (0.005 mmol, 5 eq.) of EDC was added and the reaction was allowed to stir overnight at room temperature. After overnight stirring, the solvent was removed in vacuo and solids were taken into 5 mL DCM. After filtering solids through a 0.45 µm PTFE filter the solution was precipitated by addition to 100 mL diethyl ether (anhydrous) to give a light yellow solid. The solids were isolated by centrifugation and residual impurities were removed using a PD-10 size exclusion column to give 3.9 mg (31 %) of conjugate 10 as a yellow solid.
Dy-TREN-Dendrimer Conjugation Synthesis
5:EA
To a 25 mL scintillation vial containing 3.2 mg (0.0039 mmol, 3.5 eq.) of metal complex 5 was added 5.5 mg (0.0011 mmol by carboxylic acid) of EA dendrimer. To this was added 0.75 mg (0.065 mmol, 5.9 eq.) each of NHS and HOBt. The solids were dissolved in 0.5 mL DMSO and 1.5 mg (0.0078 mmol, 7.1 eq.) of EDC was added and the reaction was allowed to stir overnight at room temperature. After overnight stirring, the solvent was removed in vacuo and solids were taken into 5 mL DCM. After filtering solids through a 0.45 µm PTFE filter the solution was precipitated by addition to 100 mL diethyl ether (anhydrous) to give a light yellow solid. The solids were isolated by centrifugation and residual impurities were removed using a PD-10 size exclusion column to give 4.2 mg (76 %) of conjugate 5:EA as a yellow solid.
7:EA
To a 25 mL scintillation vial containing 2.8 mg (0.003 mmol, 1.3 eq.) of metal complex 7 was added 12.5 mg (0.0025 mmol by carboxylic acid) of EA dendrimer. To this was added 1.5 mg (0.013 mmol, 5 eq.) each of NHS and HOBt. The solids were dissolved in 0.5 mL DMSO and 2.4 mg (0.0125 mmol, 5 eq.) of EDC was added and the reaction was allowed to stir overnight at room temperature. After overnight stirring, the solvent was removed in vacuo and solids were taken into 5 mL DCM. After filtering solids through a 0.45 µm PTFE filter the solution was precipitated by addition to 100 mL diethyl ether (anhydrous) to give a light yellow solid. The solids were isolated by centrifugation and residual impurities were removed using a PD-10 size exclusion column to give 6.1 mg (49 %) of conjugate 7:EA as a yellow solid.
9:EA
To a 25 mL scintillation vial containing 2.0 mg (0.002 mmol, 1.8 eq.) of metal complex 9 was added 5.5 mg (0.0011 mmol by carboxylic acid) of EA dendrimer. To this was added 0.75 mg (0.065 mmol, 5.9 eq.) each of NHS and HOBt. The solids were dissolved in 0.5 mL DMSO and 1.5 mg (0.0078 mmol, 7.1 eq.) of EDC was added and the reaction was allowed to stir overnight at room temperature. After overnight stirring, the solvent was removed in vacuo and solids were taken into 5 mL DCM. After filtering solids through a 0.45 µm PTFE filter the solution was precipitated by addition to 100 mL diethyl ether (anhydrous) to give a light yellow solid. The solids were isolated by centrifugation and residual impurities were removed using a PD-10 size exclusion column to give 4.6 mg (83 %) of conjugate 9. Although repeated many times conjugation higher than one complex per dendrimer was never achieved due to extensive solubility issues. This complex would not be suitable for clinical MRI.
Cell Culture for Dendrimer Conjugates
HeLa cells were purchased from American Type Culture Collection (ATTC) and plated by the Molecular and Cell Biology Cell Culture Facility at University of California, Berkeley, to 10,000 cells per well. Control samples used were the live and dead cells on each plate, the esteramide dendrimer, the polylysine dendrimer, and Gd-DTPA, a commercial MRI contrast agent. Lanthanide MRI samples tested with dendrimers were 5–10:EA. The GdIII conjugates were previously studied and determined to be nontoxic at similar concentrations. Solutions were made in the concentration of 1.0 mg/mL in Dulbecco’s modification of Eagle’s Media (DMEM, with glucose and 10% fetal bovine serum (FBS). Dilutions were made on one plate at the rate of two-fold per well, for eight total dilutions and a final concentration of 0.05 mg/mL of sample. These solutions were transferred in 100 µL dilutions onto HeLa cells, which were already in 100 µL of media. These samples were incubated for 72 h at 37 °C and 5% CO2. After 72 h, 40 µL of thiazolyl blue tetrazolium bromide (98% TLC) was added for a MTT assay at 2.9 mg/mL. These samples were incubated for 30 min at 37 °C and 5% CO2. After 30 min, the cells were aspirated and 200 µL of DMSO added, followed by 25 µL of pH 10.5 glycine buffer (100 mmol glycine and 100 mmol salt). Absorbance was measured at 570 nm on a Molecular Devices plate reader and cytotoxicity determined based on blank live cells and starved cells (terminated by denying media). All results were repeated in triplicate and the average reported.
Inductively Coupled Plasma-Optical Emission Spectroscopy (ICP-OES)
ICP-OES was performed on a Perkin Elmer Optima 7000 DV. Samples for analysis were diluted in 2% (v/v) nitric acid in Millipore water using plastic or EDTA washed glassware. GdIII, YbIII, and DyIII standards were prepared in 2% (v/v) nitric acid/Millipore water (in plastic or EDTA washed glassware) with concentrations between 0.01 µg/mL and 10 µg/mL.
Relaxivity Studies
T2 measurements were performed on a Bruker mq60 minispec relaxometer. T2 was determined at 60 MHz (1.41 T) using an inversion recovery pulse sequence. Temperature controlled at 37 °C using a Julabo F25 circulating water bath. Each sample was analyzed by ICP-OES for exact GdIII, YbIII, and DyIII concentration. The inverse of the transverse relaxation time of each sample (1/T2, s−1) was plotted against GdIII, YbIII, and DyIII concentration and fit by linear regression (R2 > 0.99). Relaxivity analyses were performed in triplicate. Samples were vortexed prior to analysis to break up potential aggregation of complexes. Instrument Parameters: 37.0 °C; Scans: 4; Recycle Delay: 18.5 s; Gain: 53; Dummy Shots: 0; Detection mode: real; Bandwidth: Broad, 20,000 kHz; Monoexponential Curve Fitting, Phase Cycling. First Pulse Separation: 5 ms; Number of data points for fitting: 200; Delay sample window: 0.05 ms; Sampling Window: 0.02 ms; Time for Saturation Curve Display: 6 s.
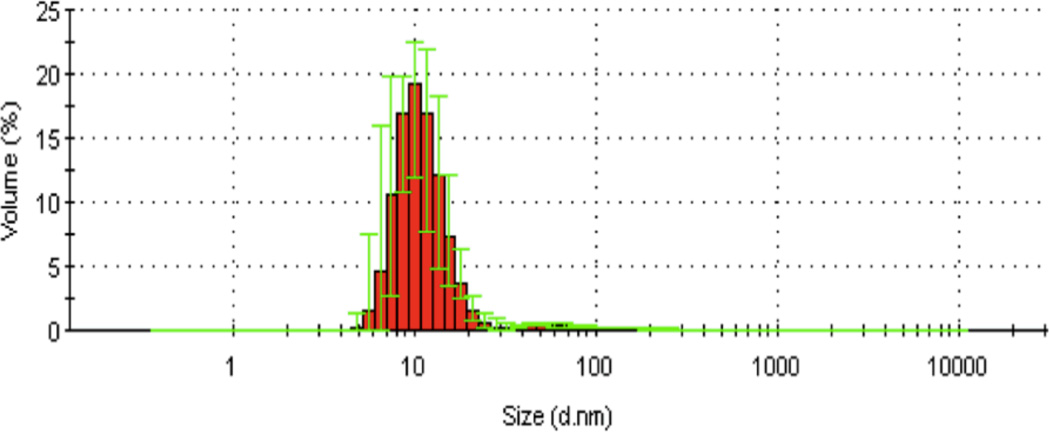
Figure 3.
DLS of 8:EA in PBS buffer, showing an average dendrimer diameter of 10 nm. Aggregation is low or not present.
Acknowledgments
The authors acknowledge NIH Grants R01 EB 002047 and HL069832. Work at LBNL is supported by the Director, Office of Science, Office of Basic Energy Sciences, the Division of Chemical Sciences, Geosciences, and Biosciences of the U.S. Department of Energy at LBNL under Contract No. DE-AC02-05CH11231. We thank Professor Christopher J. Chang for use of 60 MHz relaxometer, and Adam D. Hill for assistance.
Footnotes
Supporting information for this article is available on the WWW under http://www.eurjic.org/ or from the author
DLS, SEC-UV and RI traces for all conjugates, complex loading, and cytotoxicity are presented.
References
- 1.a) Laurent S, Forge D, Port M, Roch A, Robic C, Elst LV, Muller RN. Chem. Rev. 2008;108:2064–2110. doi: 10.1021/cr068445e. [DOI] [PubMed] [Google Scholar]; b) Norek M, Kampert E, Zeitler U, Peters JA. J. Am. Chem. Soc. 2008;130:5335–5340. doi: 10.1021/ja711492y. [DOI] [PubMed] [Google Scholar]
- 2.a) Port M, Idee J-M, Medina C, Robic C, Sabatou M, Corot C. Biometals. 2008;21:469–490. doi: 10.1007/s10534-008-9135-x. [DOI] [PubMed] [Google Scholar]; b) Caravan P, Ellison JJ, McMurry TJ, Lauffer RB. Chem. Rev. 1999;99:2293–2352. doi: 10.1021/cr980440x. [DOI] [PubMed] [Google Scholar]; c) Que EL, Chang CJ. Chem. Soc. Rev. 2010;39:51–60. doi: 10.1039/b914348n. [DOI] [PubMed] [Google Scholar]
- 3.a) Caravan P. Acc. Chem. Res. 2009;42:851–862. doi: 10.1021/ar800220p. [DOI] [PubMed] [Google Scholar]; b) Botta M. Eur. J. Inorg. Chem. 2000;3:399–407. [Google Scholar]
- 4.Bulte JWM, Kraitchman DL. NMR Biomed. 2004;17:484–499. doi: 10.1002/nbm.924. [DOI] [PubMed] [Google Scholar]
- 5.Pierre VC, Botta M, Aime S, Raymond KN. Inorg. Chem. 2006;45:8355–8364. doi: 10.1021/ic061262q. [DOI] [PMC free article] [PubMed] [Google Scholar]
- 6.Werner EJ, Kozhukh J, Botta M, Moore EG, Avedano S, Aime S, Raymond KN. Inorg. Chem. 2009;48:277–286. doi: 10.1021/ic801730u. [DOI] [PMC free article] [PubMed] [Google Scholar]
- 7.a) Werner EJ, Avedano S, Botta M, Hay BP, Moore EG, Aime S, Raymond KN. J. Am. Chem. Soc. 2007;129:1870–1871. doi: 10.1021/ja068026z. [DOI] [PMC free article] [PubMed] [Google Scholar]; b) Werner EJ, Botta M, Aime S, Raymond KN. Contrast Media Mol Imaging. 2009;4:220–229. doi: 10.1002/cmmi.281. [DOI] [PMC free article] [PubMed] [Google Scholar]
- 8.a) Hooker JM, Kovacs EW, Francis MB. J. Am. Chem. Soc. 2004;126:3718–3719. doi: 10.1021/ja031790q. [DOI] [PubMed] [Google Scholar]; b) Stephanopoulos N, Tong GJ, Hsiao SC, Francis MB. ACS Nano. 2010;26:6014–6020. doi: 10.1021/nn1014769. [DOI] [PubMed] [Google Scholar]
- 9.Xu J, Franklin SJ, Whisenhunt DW, Raymond KN. J. Am. Chem. Soc. 1995;117:7245–7246. [Google Scholar]
- 10.Werner EJ, Datta A, Jocher CJ, Raymond KN. Angew. Chem., Int. Ed. 2008;47:8568–8580. doi: 10.1002/anie.200800212. [DOI] [PubMed] [Google Scholar]
- 11.Ali M, Woods M, Caravan P, Opina ACL, Spiller M, Fettinger JC, Sherry AD. Chem.-Eur. J. 2008;14:7250–7258. doi: 10.1002/chem.200800402. [DOI] [PMC free article] [PubMed] [Google Scholar]
- 12.a) Floyd WC, III, Klemm PJ, Smiles DE, Kohlgruber AC, Pierre VC, Mynar JL, Fréchet JMJ, Raymond KN. J. Am. Chem. Soc. 2011;133:2390–2393. doi: 10.1021/ja110582e. [DOI] [PMC free article] [PubMed] [Google Scholar]; b) Klemm PJ, Floyd WC, III, Smiles DE, Fréchet JMJ, Raymond KN. Contrast Media Mol Imaging. doi: 10.1002/cmmi.483. In press. [DOI] [PMC free article] [PubMed] [Google Scholar]
- 13.a) Datta A, Hooker JM, Botta M, Francis MB, Aime S, Raymond KN. J. Am. Chem. Soc. 2008;130:2546–2552. doi: 10.1021/ja0765363. [DOI] [PubMed] [Google Scholar]; b) Garimella P, Datta A, Romanini DW, Raymond KN, Francis MB. J. Am. Chem. Soc. 2011;133:14704–14709. doi: 10.1021/ja204516p. [DOI] [PMC free article] [PubMed] [Google Scholar]; c) Datta A, Raymond KN. Acc. Chem. Res. 2009;42:938–947. doi: 10.1021/ar800250h. [DOI] [PMC free article] [PubMed] [Google Scholar]; d) Hooker JM, Datta A, Botta M, Raymond KN, Francis MB. Nano Lett, 2007;7:2207–2210. doi: 10.1021/nl070512c. [DOI] [PubMed] [Google Scholar]
- 14.a) Song Y, Xu X, MacRenaris KW, Zhang X-Q, Mirkin CA, Meade TJ. Angew. Chem. Intl. Ed. 2009;48:9143–9147. doi: 10.1002/anie.200904666. [DOI] [PMC free article] [PubMed] [Google Scholar]; b) Liu G, Tse NMK, Hill MR, Kennedy DF, Drummond CJ. Aust. J. Chem. 2011;64:617–624. [Google Scholar]
- 15.Manus LM, Mastarone DJ, Waters EA, Zhang X-Q, Schultz-Sikma EA, MacRenaris KW, Ho D, Meade TJ. Nano Lett. 2010;10:484–489. doi: 10.1021/nl903264h. [DOI] [PMC free article] [PubMed] [Google Scholar]
- 16.a) van der Poll DG, Kieler-Ferguson HM, Floyd WC, III, Guillaudeu SJ, Jerger K, Szoka FC, Fréchet JMJ. Bioconj. Chem. 2010;21:764–773. doi: 10.1021/bc900553n. [DOI] [PMC free article] [PubMed] [Google Scholar]; b) van der Poll DG, Jerger K, Floyd WC, III, Fréchet JMJ, Szoka FC. Bioconj. Chem. 2011;22:617–624. doi: 10.1021/bc100400u. [DOI] [PMC free article] [PubMed] [Google Scholar]
- 17.Fox ME, Szoka FC, Fréchet JMJ. Acc. Chem. Res. 2009;42:1141–1151. doi: 10.1021/ar900035f. [DOI] [PMC free article] [PubMed] [Google Scholar]
- 18.Greenwald RB, Conover CD, Choe YH. Crit. Rev. Ther. Drug. Carrier. Syst. 2000;17:101–161. [PubMed] [Google Scholar]
- 19.Matsumura Y, Maeda H. Cancer Res. 1986;46:6387–6392. [PubMed] [Google Scholar]
- 20.Lee CC, Yoshida M, Fréchet JMJ, Dy EE, Szoka FC. Bioconj. Chem. 2005;16:535–541. doi: 10.1021/bc0497665. [DOI] [PubMed] [Google Scholar]
- 21.Rocklage SM, Watson AD. J. Magn. Res. Imaging. 2005;3:167–178. doi: 10.1002/jmri.1880030129. [DOI] [PubMed] [Google Scholar]
- 22.Weissleder R, Ntziachristos V. Nat. Med. 2003;9:123–128. doi: 10.1038/nm0103-123. [DOI] [PubMed] [Google Scholar]
- 23.a) Faulkner S, Pope SJS, Burton-Pye BP. Appl. Spectrosc. Rev. 2005;40:1–31. [Google Scholar]; b) Frangioni JV. Curr. Opin. Chem. Biol. 2003;7:626– 634. doi: 10.1016/j.cbpa.2003.08.007. [DOI] [PubMed] [Google Scholar]; c) Tiwari AK, Sinha D, Datta A, Kakkar D, Mishra AK. Chem. Biol. Drug Des. 2011;77:388–392. doi: 10.1111/j.1747-0285.2011.01103.x. [DOI] [PubMed] [Google Scholar]
- 24.a) Moore EG, Xu J, Dodani SC, Jocher CJ, D’Aleo A, Seitz M, Raymond KN. Inorg Chem. 2010;49:4156–4166. doi: 10.1021/ic902219t. [DOI] [PMC free article] [PubMed] [Google Scholar]; b) Moore EG, D’Aleo A, Xu J, Raymond KN. Aust. J. Chem. 2009;62:1300–1307. doi: 10.1071/CH09314. [DOI] [PMC free article] [PubMed] [Google Scholar]; c) Petoud S, Muller G, Moore EG, Xu J, Sokolnicki J, Riehl JP, Le U, Cohen SM, Raymond KN. J. Am. Chem. Soc. 2007;46:351–353. doi: 10.1021/ja064902x. [DOI] [PMC free article] [PubMed] [Google Scholar]; d) Moore EG, Seitz M, Raymond KN. Inorg. Chem. 2008;47:8571–8573. doi: 10.1021/ic801060x. [DOI] [PMC free article] [PubMed] [Google Scholar]
- 25.Thompson MK, Misselwitz LS, Tso B, Doble DMJ, Schmitt-Willich H, Raymond KN. J. Med. Chem. 2005;48:3874–3877. doi: 10.1021/jm049041m. [DOI] [PubMed] [Google Scholar]


