

Abstract
Autism spectrum disorder (ASD) is a common, highly heritable neuro-developmental condition characterized by marked genetic heterogeneity1–3. Thus, a fundamental question is whether autism represents an etiologically heterogeneous disorder in which the myriad genetic or environmental risk factors perturb common underlying molecular pathways in the brain4. Here, we demonstrate consistent differences in transcriptome organization between autistic and normal brain by gene co-expression network analysis. Remarkably, regional patterns of gene expression that typically distinguish frontal and temporal cortex are significantly attenuated in the ASD brain, suggesting abnormalities in cortical patterning. We further identify discrete modules of co-expressed genes associated with autism: a neuronal module enriched for known autism susceptibility genes, including the neuronal specific splicing factor A2BP1/FOX1, and a module enriched for immune genes and glial markers. Using high-throughput RNA-sequencing we demonstrate dysregulated splicing of A2BP1-dependent alternative exons in ASD brain. Moreover, using a published autism GWAS dataset, we show that the neuronal module is enriched for genetically associated variants, providing independent support for the causal involvement of these genes in autism. In contrast, the immune-glial module showed no enrichment for autism GWAS signals, indicating a non-genetic etiology for this process. Collectively, our results provide strong evidence for convergent molecular abnormalities in ASD, and implicate transcriptional and splicing dysregulation as underlying mechanisms of neuronal dysfunction in this disorder.
We analyzed post-mortem brain tissue samples from 19 autism cases and 17 controls from the Autism Tissue Project and the Harvard brain bank (Supplementary Table1) using Illumina microarrays. For each individual, we profiled three regions previously implicated in autism5: superior temporal gyrus (STG /Brodmann’s area [BA] 41/42), prefrontal cortex (BA9) and cerebellar vermis. After filtering for high-quality array data (Methods), we retained 58 cortex samples (29 autism, 29 controls) and 21 cerebellum samples (11 autism, 10 controls) for further analysis (see Methods for detailed sample description). We identified 444 genes showing significant expression changes in autism cortex samples (DS1, Figure 1b), and only 2 genes differentially expressed (DE) between the autism and control groups in cerebellum (Methods), indicating that gene expression changes associated with autism were more pronounced in cerebral cortex, which became the focus of further analysis (Supplementary Table 2). There was no significant difference in age, post mortem interval (PMI), or RNA integrity numbers (RIN) between autism and control cortex samples (Supplementary Figure 1, Methods).
Figure 1. Gene expression changes in autism cerebral cortex.

A. Heatmap of top 200 genes differentially expressed between autism and control cortex samples. Scaled expression values are color-coded according to the legend on the left. The dendrogram depicts hierarchical clustering based on the top 200 DE genes. The top bar (A/C) indicates the disease status: red-autism, black-control. The bottom bars show additional variables for each sample: sex (grey-male, black-female), brain area (black-temporal, grey-frontal), co-morbidity of seizures (green-autism case with seizure disorder, red-autism case without seizure disorder, black-control), age, RNA integrity number (RIN) and post mortem interval (PMI). The corresponding scale for quantitative variables is shown on the left.
B. Top: Venn diagram depicting the overlap between genes DE in frontal and temporal cortex. Bottom: Venn diagram describing the overlap between genes DE in the initial cohort (DS1) and the replication cohort (DS2). Differential expression in the initial cohort was assessed at an FDR<0.05 and fold changes>1.3. The statistical criteria were relaxed to p<0.05 for the replication dataset since it involved fewer samples.
C. Expression fold changes for all genes DE in the initial cohort are plotted on the x-axis against the fold changes for the same genes in the replication cohort on the y-axis. Green-genes downregulated in the autism group in both datasets, red-genes upregulated in the autism group in both datasets, grey-genes with opposite direction of variation in the two datasets. Horizontal lines show fold change threshold for significance.
D. (left) Diagram depicting the number of genes showing significant expression differences between frontal and temporal cortex in control samples (top) and autism samples (bottom) at FDR<0.05. (right) Top 20 genes differentially expressed between frontal and temporal cortex in control samples. All of the genes shown are also differentially expressed between frontal and temporal cortex in fetal midgestation brain10, but show no significant expression differences between frontal and temporal cortex in autism. The horizontal bars depict p values for differential expression between frontal and temporal cortex in the autism and control groups.
Supervised hierarchical clustering based on the top 200 DE genes showed distinct clustering of the majority of autism cortex samples (Figure 1a), including one case that was simultaneously found to have a 15q duplication (Methods, Supplementary Table 1), which is known to cause 1% of ASD6. Cortex samples from ten of the cases coalesced in a single tight-clustering branch of the dendrogram. Clustering was independent of age, sex, RIN, PMI, co-morbidity of seizures, or medication (Figure 1a; Supplementary Figure 2c). It is interesting to note that the 2 ASD cases that cluster with controls (Figure 1a) are the least severe cases, as assessed by global functioning (Supplementary Table 12). We observed a highly significant overlap between DE genes in frontal and temporal cortex (p = 10E-44; Figure 1b), supporting the robustness of the data and indicating that the autism-specific expression changes are consistent across these cortical areas. We also validated a cross section of the DE genes by RT-PCR and confirmed microarray-predicted changes in 83% of the genes tested (Methods, Supplementary Figure 2b). Gene ontology (GO) enrichment analysis (Methods) revealed that the 209 genes downregulated in autistic cortex were enriched for GO categories related to synaptic function, whereas the upregulated genes (N=235) showed enrichment for GO categories implicated in immune and inflammatory response (Supplementary Table 3).
To test whether these findings were replicable, and to further validate the results in an independent dataset, we obtained tissue from an additional frontal cortex region (BA44/45) from nine ASD cases and five controls (DS2; Supplementary Table 4). Three of the cases and all of the controls used for validation were independent from our initial cohort. Ninety-seven genes were differentially expressed in BA44/45 in DS2, and 81 of these were also DE in our initial cohort (p=1.2E-93, hypergeometric test; Figure 1b, c). Remarkably, the direction of expression differences between autism and controls was the same as in the initial cohort for all but 2 of the 81 overlapping DE probes. Hierarchical clustering of DS2 samples based on either the top 200 genes DE in the initial cohort or the 81 overlapping genes showed distinct separation of cases from controls (Supplementary Figure 6). In addition, comparison of these DE results with another, smaller study of the STG in ASD7, revealed significant consistency at the level of DE genes, including down-regulation of DLX1 and AHI1 (Supplementary Table 5). Thus, DE analysis produced robust and highly reproducible results, warranting further refined analysis.
We next applied weighted-gene co-expression network analysis (WGCNA)8; 9 to integrate the expression differences observed between autistic and control cerebral cortex into a higher order, systems level context. We first asked whether there are global differences in the organization of the brain transcriptome between autistic and control brain by constructing separate co-expression networks for the autism and control groups (Methods). The control brain network showed high similarity with the previously described human brain co-expression networks (Supplementary Table 7), consistent with the existence of robust modules of co-expressed genes related to specific cell types and biological functions8. Similarly, the majority of the autism modules (87%) showed significant overlap with the previously described human brain modules (Supplementary Table 6), indicating that many features reflecting the general organization of the autism brain transcriptome are consistent with that of the normal human brain.
The expression levels of each module were summarized by the first principal component (the module eigengene), and were used to assess whether modules are related to clinical phenotypes or other experimental variables, such as brain region. Two of the control module eigengenes (cM6, cM13) showed significant differences (p<0.05) between the two cortical regions as expected, whereas none of the ASD modules showed any differences between frontal and temporal cortex. This led us to explore the hypothesis that the normal molecular distinctions between the two cortical regions tested were altered in ASD compared with controls. Remarkably, while 174 genes were DE between control BA9 and BA41 (FDR<1%), none of the genes were DE in the same regional comparison among the ASD cases. This was not simply an issue of statistical thresholds, as relaxing the statistical criteria for DE to an FDR of 5%, identified over 500 DE genes in controls, and only 8 in ASD brains, confirming the large difference observed in regional cortical differential gene expression between ASD cases and controls (Figure 1d, Methods). Analysis of DE from a data set10 of gene expression in developing fetal human brain showed a highly significant (p = 5.8E-9) overlap of DE genes with those found in controls in this study, independently confirming that these genes differentiate normal temporal and frontal lobes. We evaluated the homogeneity of gene expression variance across the autism and control groups using Bartlett’s test (Methods) which indicated that increased variance was not the major factor responsible for the striking difference in regional gene expression between ASD and controls (Supplementary Figure 7 and Supplementary Data).
These data suggest that typical regional differences, many of which are observed during fetal development10, are attenuated in frontal and temporal lobe in autism brain, pointing to abnormal developmental patterning as a potential pathophsyiological driver in ASD. This is especially interesting in light of a recent anatomical study of 5 cases with adult autism which demonstrated a reduction in typical ultrastructural differences between 3 frontal cortical regions in autism11. Together, these independent studies provide both molecular and structural evidence suggesting a relative diminution of cortical regional identity in autism.
To identify discrete groups of co-expressed genes showing transcriptional differences between autism and controls, we constructed a co-expression network using the entire dataset, composed of both autism and control samples (Methods). As previously shown for complex diseases12; 13 co-expression networks allow analysis of gene expression variation related to multiple disease-related and genetic traits. We assessed module eigengene relationship to autism disease status, age, gender, cause of death, co-morbidity of seizures, family history of psychiatric disease, and medication, providing a complementary assessment of these potential confounders to that performed in the standard DE analysis (Supplementary Table 9).
The comparison between autism and control groups revealed two network modules whose eigengenes were highly correlated with disease status, and not any of the potential confounding variables (Supplementary Table 9). We found that the top module (M12) showed highly significant enrichment for neuronal markers (Supplementary Table 9), and high overlap with two neuronal modules previously identified as part of the human brain transcriptional network8: a PVALB+ interneuron module and a module of genes involved in synaptic function. The M12 eigengene was under-expressed in autism cases, indicating that genes in this module were down-regulated in the autistic brain (Figure 2). Consistent with the pathways identified to be downregulated in autism by DE analysis (Supplementary Table 3), the functional enrichment of M12 included the GO categories involved in synaptic function, vesicular transport and neuronal projection.
Figure 2. Gene co-expression modules associated with autism.

A, D Top-heatmap of genes belonging to the co-expression module. Bottom-corresponding module eigengene values (y-axis) across samples (x-axis) . Red-autism, grey-controls.
B, E Visualization of the M12 and M16 modules respectively. The top 150 connections are shown for the each module. Genes with the highest correlation with the module eigengene value (i.e intramodular hubs) are shown in larger size.
C, F Relevant gene ontology categories enriched in the M12 and M16 modules
Remarkably, unlike DE genes, M12 showed significant overrepresentation of known autism susceptibility genes2 (Supplementary Table 10; p = 6.1E-4), including CADPS2, AHI1, CNTNAP2, and SLC25A12, supporting the increased power of the network-based approach to identify disease-relevant transcriptional changes. A further advantage of network analysis over standard analysis of DE is that it allows one to infer the functional relevance of genes based on their network position9. The hubs of M12, i.e. the genes with the highest rank of M12 membership8, were A2BP1, APBA2, SCAMP5, CNTNAP1, KLC2, CHRM1 (Supplementary Data). The first three of these genes have previously been implicated in autism14–16, while the fourth is a homologue of the autism susceptibility gene CNTNAP217. We highlight the group of genes most strongly connected to the known ASD genes (Supplementary Figure 5) and emphasize the down-regulation of several interneuron markers, such as DLX1 and PVALB, as candidates for future genetic and pathologic investigations.
The second module of co-expressed genes highly related to autism disease status, M16, was enriched for astrocyte markers and markers of activated microglia (Supplementary Table 9), as well as for genes belonging to immune and inflammatory GO categories (Figure 2). This module, which was upregulated in ASD brain, showed significant similarity to two modules identified in previous studies of normal human brain8: an astrocyte module and a microglial module. Consistent with this functional annotation, two of the hubs of the M16 module were known astrocyte markers (ADFP and IFITM2).
One of the hubs of the M12 module was A2BP1/FOX1, a neural- and muscle-specific alternative splicing regulator18 and the only splicing factor previously implicated in ASD16. Since A2BP1 was down-regulated in several ASD cases (Supplementary Figure 8), this observation provided a unique opportunity to identify potential disease relevant A2BP1 targets. While A2BP1-regulated alternative exons have been predicted genome-wide19, few genes have been experimentally validated as A2BP1 targets20. To identify potential A2BP1-dependent differential splicing (DS) events in ASD brain, we performed high-throughput RNA sequencing (RNA-Seq) on 3 autism samples with significant down-regulation of A2BP1 (average fold change by qRT-PCR: 5.9) and 3 control samples with average A2BP1 levels. We identified 212 significant alternative splicing events (Supplementary Data). Among these, 36 had been defined by Zhang et al.19 as predicted targets of A2BP1/2, which represents a highly significant overlap (p=2.2E-16). In addition, five previously validated A2BP1 targets showed evidence of alternative splicing, four of which (ATP5C1, ATP2B1, GRIN1 and MEF2C) were confirmed as having differential splicing between ASD samples with low A2BP1 expression and control samples, indicating that we were able to identify a high proportion of the expected A2BP1-dependent DS events. We also observe that alternative exons with increased skipping in ASD relative to control cases are significantly enriched for A2BP1 motifs in adjacent, downstream intronic sequences (p = 1.09E-7, Fisher exact test), consistent with previous data19.
The top GO categories enriched among ASD DS genes highly overlapped with the GO categories found to be enriched in the M12 module (Figure 3b). In addition, A2BP1 target genes showed enrichment for actin-binding proteins and genes involved in cytoskeleton re-organization (Figure 3b). Among top predicted A2BP1-dependent DS events (Figure 3a) are CAMK2G, which also belongs to the M12 module, as well as NRCAM and GRIN1. The latter are proteins involved in synaptogenesis, in which allelic variants have been associated with autism and schizophrenia respectively21; 22.
Figure 3. A2BP1-dependent differential splicing events.
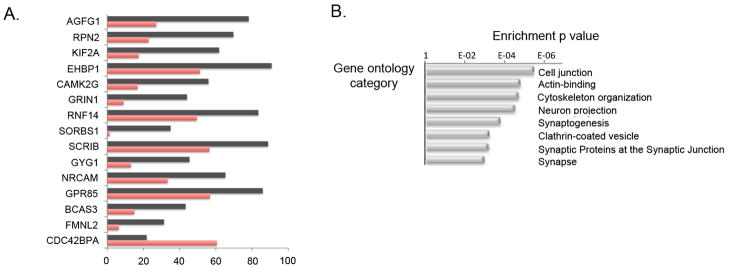
A. Top A2BP1-specific differential splicing events. DS events showing the most significant differences in alternative splicing between low-A2BP1 autism cases and controls as well as DS differences consistent with the A2BP1 binding site position. The horizontal axis depicts the percentage of transcripts including the alternative exon. Red-autism samples, black-control samples.
B. Relevant gene ontology categories enriched in the set of genes containing exons differentially spliced between low-A2BP1 autism cases and controls.
RT-PCR assays confirmed a high proportion (85%) of the tested DS changes involving predicted A2BP1 targets (Supplementary Figure 8). We further tested the DS events validated by RT-PCR in 3 independent ASD cases with decreased A2BP1 levels and confirmed the predicted changes in alternative splicing (Supplementary Figure 8), indicating that the observed DS events are indeed associated with reduced A2BP1 levels, rather than due to inter-individual variability. The RNA-Seq data thus provides validation of the functional groups of genes identified by co-expression analysis, and evidence for a convergence of transcriptional and alternative-splicing abnormalities in the synaptic and signaling pathogenesis of ASD.
To test whether our findings are more generalizable, and determine whether the autism-associated transcriptional differences observed are likely to be causal, versus collateral effects or environmentally-induced changes, we tested whether our co-expression modules or the DE genes show enrichment for autism genetic association signals. M12 showed highly significant enrichment for association signals (p = 5E-4), but neither M16 nor the list of DE genes showed such enrichment (Figure 4). As a negative control, we performed the same set-enrichment analysis using two GWAS studies for non-psychiatric disease performed on the same genotyping platform: a genome-wide association for hair color23, and a GWAS study of Warfarin maintenance dose24 finding no significant enrichment of the association signal (Figure 4b, Supplementary Figure 4). These results indicate that (a) M12 consists of a set of genes that are supported by independent lines of evidence to be causally involved in ASD pathophysiology, and (b) the upregulation of immune response genes in the autistic brain observed by us and others25 has no evidence of a common genetic component.
Figure 4. GWAS set enrichment analysis.
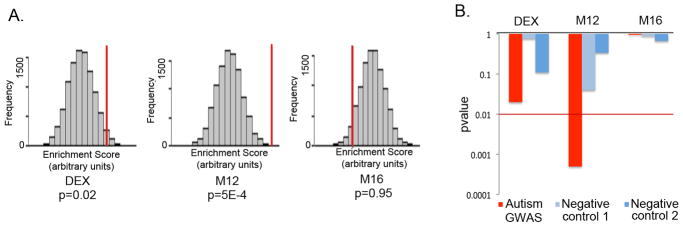
A. GWAS set enrichment analysis using the discovery AGRE cohort from Wang et al.27 For each gene set (DE genes, M12 and M16) the null distribution of the enrichment score generated by 10000 random permutations is shown (x-axis) and the enrichment score for the gene set is depicted by a red vertical line. A p value < 0.01 was considered significant to correct for multiple comparisons.
B. GWAS signal enrichment of DE genes and the autism-associated co-expression modules M12 and M16. Enrichment p values are shown for an autism GWAS dataset (Wang et al.27, AGRE discovery cohort) as well as two control datasets consisting of GWAS studies of non-psychiatric traits: Han et al.23 (Negative control 1) and Cooper et al.24 (Negative control 2). The red line marks the p value threshold for significance.
Our system-level analysis of the ASD brain transcriptome demonstrates the existence of convergent molecular abnormalities in ASD for the first time, providing a molecular neuropathological basis for the disease, whose genetic, epigenetic, or environmental etiologies can now be directly explored. The genome-wide analysis performed here significantly extends previous findings implicating synaptic dysfunction, as well as microglial and immune dysregulation in ASD6 by providing an unbiased systematic assessment of transcriptional alterations and their genetic basis. We show that the transcriptome changes observed in ASD brain converge with GWAS data in supporting the genetic basis of synaptic and neuronal signaling dysfunction in ASD, while immune changes have a less pronounced genetic component and thus are most likely either secondary phenomena or caused by environmental factors. Since immune molecules and cells such as microglia play a role in synaptic development and function26, we speculate that the observed immune up-regulation may be related to abnormal ongoing plasticity in ASD brain. The striking attenuation of gene expression differences observed here between frontal and temporal cortex in ASD likely represents a defect of developmental patterning and provides a strong rationale for further studies to assess the pervasiveness of transcriptional patterning abnormalities across the ASD brain. We also demonstrate for the first time alterations in differential splicing associated with A2BP1/FOX1 levels in ASD brain, and show that many of the affected exons belong to genes involved in synaptic function. Finally, given current evidence of genetic overlap between ASD and other neurodevelopmental disorders including schizophrenia and ADHD, our data provide a new pathway-based framework from which to assess the enrichment of genetic association signals in other psychiatric disorders.
METHODS SUMMARY
Brain Tissue
Postmortem brain tissue was obtained from the Autism Tissue Project and the Harvard Brain Bank as well as the MRC London Brain bank for Neurodegenerative Disease. Detailed information on the autism cases included in this study is available in Methods.
Microarrays and RNAseq
Total RNA was extracted from 100 mg of tissue using a Qiagen miRNA kit according to the manufacturer’s protocol. Expression profiles were obtained using Illumina Ref 8 v3 microarrays. RNAseq was performed on the Illumina GAIIx, as per the manufacturer’s instructions. Furthere detailed information on data analysis is available in Methods. All microarray and RNAseq data is deposited in GEO under accession numbers which are pending.
Full detailed Methods accompany this paper as supplemental material.
Supplementary Material
Acknowledgments
We are grateful for the efforts of the Autism Tissue Program (ATP) of Autism Speaks and the families that have enrolled in the ATP, which made this work possible. We would also like to thank Brett Abrahams for help in the initial stages of the project, Brent Fogel, Gena Konopka and Jamee Bomar for critically reading the manuscript, Maria Lazaro for help with tissue dissection, and Chandran Vijayendran and Kellen Winden for useful discussions. This work was funded by an Autism Center of Excellence Network Grant from NIMH 5R01MH081754-03 to D.H.G and by grants from the Canadian Institutes of Health Research and Genome Canada through the Ontario Genomics Institute to B.J.B.
Footnotes
AUTHOR CONTRIBUTIONS
I.V and D.H.G designed the study and wrote the manuscript. I.V performed experiments, analyzed the data and conducted the GWAS set enrichment analysis. X.W and B.B analyzed the RNA sequencing data. J.L contributed to the GWAS set enrichment analysis. Y.T performed some of the microarray qRT-PCR validation experiments. R.C supervised the GWAS set enrichment analysis. S.H supervised the WGCNA analysis. P.J and J.M provided dissected tissue for the replication experiment. All authors discussed the results and commented on the manuscript.
Supplementary Information is linked to the online version of the paper at www.nature.com/nature.
References
- 1.Durand CM, Betancur C, Boeckers TM, Bockmann J, Chaste P, Fauchereau F, Nygren G, Rastam M, Gillberg IC, Anckarsater H, et al. Mutations in the gene encoding the synaptic scaffolding protein SHANK3 are associated with autism spectrum disorders. Nat Genet. 2007;39:25–27. doi: 10.1038/ng1933. [DOI] [PMC free article] [PubMed] [Google Scholar]
- 2.Pinto D, Pagnamenta AT, Klei L, Anney R, Merico D, Regan R, Conroy J, Magalhaes TR, Correia C, Abrahams BS, et al. Functional impact of global rare copy number variation in autism spectrum disorders. Nature. 2010;466:368–372. doi: 10.1038/nature09146. [DOI] [PMC free article] [PubMed] [Google Scholar]
- 3.Sebat J, Lakshmi B, Malhotra D, Troge J, Lese-Martin C, Walsh T, Yamrom B, Yoon S, Krasnitz A, Kendall J, et al. Strong association of de novo copy number mutations with autism. Science. 2007;316:445–449. doi: 10.1126/science.1138659. [DOI] [PMC free article] [PubMed] [Google Scholar]
- 4.Geschwind DH. Autism: many genes, common pathways? Cell. 2008;135:391–395. doi: 10.1016/j.cell.2008.10.016. [DOI] [PMC free article] [PubMed] [Google Scholar]
- 5.Amaral DG, Schumann CM, Nordahl CW. Neuroanatomy of autism. Trends Neurosci. 2008;31:137–145. doi: 10.1016/j.tins.2007.12.005. [DOI] [PubMed] [Google Scholar]
- 6.Abrahams BS, Geschwind DH. Advances in autism genetics: on the threshold of a new neurobiology. Nat Rev Genet. 2008;9:341–355. doi: 10.1038/nrg2346. [DOI] [PMC free article] [PubMed] [Google Scholar]
- 7.Garbett K, Ebert PJ, Mitchell A, Lintas C, Manzi B, Mirnics K, Persico AM. Immune transcriptome alterations in the temporal cortex of subjects with autism. Neurobiol Dis. 2008;30:303–311. doi: 10.1016/j.nbd.2008.01.012. [DOI] [PMC free article] [PubMed] [Google Scholar]
- 8.Oldham MC, Konopka G, Iwamoto K, Langfelder P, Kato T, Horvath S, Geschwind DH. Functional organization of the transcriptome in human brain. Nat Neurosci. 2008;11:1271–1282. doi: 10.1038/nn.2207. [DOI] [PMC free article] [PubMed] [Google Scholar]
- 9.Zhang B, Horvath S. A general framework for weighted gene co-expression network analysis. Stat Appl Genet Mol Biol. 2005;4:Article 17. doi: 10.2202/1544-6115.1128. [DOI] [PubMed] [Google Scholar]
- 10.Johnson MB, Kawasawa YI, Mason CE, Krsnik Z, Coppola G, Bogdanovic D, Geschwind DH, Mane SM, State MW, Sestan N. Functional and evolutionary insights into human brain development through global transcriptome analysis. Neuron. 2009;62:494–509. doi: 10.1016/j.neuron.2009.03.027. [DOI] [PMC free article] [PubMed] [Google Scholar]
- 11.Zikopoulos B, Barbas H. Changes in prefrontal axons may disrupt the network in autism. J Neurosci. 2010;30:14595–14609. doi: 10.1523/JNEUROSCI.2257-10.2010. [DOI] [PMC free article] [PubMed] [Google Scholar]
- 12.Chen Y, Zhu J, Lum PY, Yang X, Pinto S, MacNeil DJ, Zhang C, Lamb J, Edwards S, Sieberts SK, et al. Variations in DNA elucidate molecular networks that cause disease. Nature. 2008;452:429–435. doi: 10.1038/nature06757. [DOI] [PMC free article] [PubMed] [Google Scholar]
- 13.Plaisier CL, Horvath S, Huertas-Vazquez A, Cruz-Bautista I, Herrera MF, Tusie-Luna T, Aguilar-Salinas C, Pajukanta P. A systems genetics approach implicates USF1, FADS3, and other causal candidate genes for familial combined hyperlipidemia. PLoS Genet. 2009;5:e1000642. doi: 10.1371/journal.pgen.1000642. [DOI] [PMC free article] [PubMed] [Google Scholar]
- 14.Babatz TD, Kumar RA, Sudi J, Dobyns WB, Christian SL. Copy number and sequence variants implicate APBA2 as an autism candidate gene. Autism Res. 2009;2:359–364. doi: 10.1002/aur.107. [DOI] [PubMed] [Google Scholar]
- 15.Castermans D, Volders K, Crepel A, Backx L, De Vos R, Freson K, Meulemans S, Vermeesch JR, Schrander-Stumpel CT, De Rijk P, et al. SCAMP5, NBEA and AMISYN: three candidate genes for autism involved in secretion of large dense-core vesicles. Hum Mol Genet. 2010;19:1368–1378. doi: 10.1093/hmg/ddq013. [DOI] [PubMed] [Google Scholar]
- 16.Martin CL, Duvall JA, Ilkin Y, Simon JS, Arreaza MG, Wilkes K, Alvarez-Retuerto A, Whichello A, Powell CM, Rao K, et al. Cytogenetic and molecular characterization of A2BP1/FOX1 as a candidate gene for autism. Am J Med Genet B Neuropsychiatr Genet. 2007;144B:869–876. doi: 10.1002/ajmg.b.30530. [DOI] [PubMed] [Google Scholar]
- 17.Alarcon M, Abrahams BS, Stone JL, Duvall JA, Perederiy JV, Bomar JM, Sebat J, Wigler M, Martin CL, Ledbetter DH, et al. Linkage, association, and gene-expression analyses identify CNTNAP2 as an autism-susceptibility gene. Am J Hum Genet. 2008;82:150–159. doi: 10.1016/j.ajhg.2007.09.005. [DOI] [PMC free article] [PubMed] [Google Scholar]
- 18.Underwood JG, Boutz PL, Dougherty JD, Stoilov P, Black DL. Homologues of the Caenorhabditis elegans Fox-1 protein are neuronal splicing regulators in mammals. Mol Cell Biol. 2005;25:10005–10016. doi: 10.1128/MCB.25.22.10005-10016.2005. [DOI] [PMC free article] [PubMed] [Google Scholar]
- 19.Zhang C, Zhang Z, Castle J, Sun S, Johnson J, Krainer AR, Zhang MQ. Defining the regulatory network of the tissue-specific splicing factors Fox-1 and Fox-2. Genes Dev. 2008;22:2550–2563. doi: 10.1101/gad.1703108. [DOI] [PMC free article] [PubMed] [Google Scholar]
- 20.Lee JA, Tang ZZ, Black DL. An inducible change in Fox-1/A2BP1 splicing modulates the alternative splicing of downstream neuronal target exons. Genes Dev. 2009;23:2284–2293. doi: 10.1101/gad.1837009. [DOI] [PMC free article] [PubMed] [Google Scholar]
- 21.Moy SS, Nonneman RJ, Young NB, Demyanenko GP, Maness PF. Impaired sociability and cognitive function in Nrcam-null mice. Behav Brain Res. 2009;205:123–131. doi: 10.1016/j.bbr.2009.06.021. [DOI] [PMC free article] [PubMed] [Google Scholar]
- 22.Zhao X, Li H, Shi Y, Tang R, Chen W, Liu J, Feng G, Shi J, Yan L, Liu H, et al. Significant association between the genetic variations in the 5' end of the N-methyl-D-aspartate receptor subunit gene GRIN1 and schizophrenia. Biol Psychiatry. 2006;59:747–753. doi: 10.1016/j.biopsych.2005.10.023. [DOI] [PubMed] [Google Scholar]
- 23.Han J, Kraft P, Nan H, Guo Q, Chen C, Qureshi A, Hankinson SE, Hu FB, Duffy DL, Zhao ZZ, et al. A genome-wide association study identifies novel alleles associated with hair color and skin pigmentation. PLoS Genet. 2008;4:e1000074. doi: 10.1371/journal.pgen.1000074. [DOI] [PMC free article] [PubMed] [Google Scholar]
- 24.Cooper GM, Johnson JA, Langaee TY, Feng H, Stanaway IB, Schwarz UI, Ritchie MD, Stein CM, Roden DM, Smith JD, et al. A genome-wide scan for common genetic variants with a large influence on warfarin maintenance dose. Blood. 2008;112:1022–1027. doi: 10.1182/blood-2008-01-134247. [DOI] [PMC free article] [PubMed] [Google Scholar]
- 25.Morgan JT, Chana G, Pardo CA, Achim C, Semendeferi K, Buckwalter J, Courchesne E, Everall IP. Microglial activation and increased microglial density observed in the dorsolateral prefrontal cortex in autism. Biol Psychiatry. 2010;68:368–376. doi: 10.1016/j.biopsych.2010.05.024. [DOI] [PubMed] [Google Scholar]
- 26.Boulanger LM. Immune proteins in brain development and synaptic plasticity. Neuron. 2009;64:93–109. doi: 10.1016/j.neuron.2009.09.001. [DOI] [PubMed] [Google Scholar]
- 27.Wang K, Zhang H, Ma D, Bucan M, Glessner JT, Abrahams BS, Salyakina D, Imielinski M, Bradfield JP, Sleiman PM, et al. Common genetic variants on 5p14.1 associate with autism spectrum disorders. Nature. 2009;459:528–533. doi: 10.1038/nature07999. [DOI] [PMC free article] [PubMed] [Google Scholar]
Associated Data
This section collects any data citations, data availability statements, or supplementary materials included in this article.