

Abstract
We performed a discovery genome-wide association study to identify genetic factors associated with variation in plasma estradiol (E2) concentrations using DNA from 772 postmenopausal women with estrogen receptor (ER)-positive breast cancer prior to the initiation of aromatase inhibitor therapy. Association analyses showed that the single nucleotide polymorphisms (SNP) (rs1864729) with the lowest P value (P = 3.49E-08), mapped to chromosome 8 near TSPYL5. We also identified 17 imputed SNPs in or near TSPYL5 with P values < 5E-08, one of which, rs2583506, created a functional estrogen response element. We then used a panel of lymphoblastoid cell lines (LCLs) stably transfected with ERα with known genome-wide SNP genotypes to demonstrate that TSPYL5 expression increased after E2 exposure of cells heterozygous for variant TSPYL5 SNP genotypes, but not in those homozygous for wild-type alleles. TSPYL5 knockdown decreased, and overexpression increased aromatase (CYP19A1) expression in MCF-7 cells, LCLs, and adipocytes through the skin/adipose (I.4) promoter. Chromatin immunoprecipitation assay showed that TSPYL5 bound to the CYP19A1 I.4 promoter. A putative TSPYL5 binding motif was identified in 43 genes, and TSPYL5 appeared to function as a transcription factor for most of those genes.
In summary, genome-wide significant SNPs in TSPYL5 were associated with elevated plasma E2 in postmenopausal breast cancer patients. SNP rs2583506 created a functional estrogen response element, and LCLs with variant SNP genotypes displayed increased E2-dependent TSPYL5 expression. TSPYL5 induced CYP19A1 expression and that of many other genes. These studies have revealed a novel mechanism for regulating aromatase expression and plasma E2 concentrations in postmenopausal women with ER(+) breast cancer.
Circulating estradiol (E2) concentrations decrease dramatically after menopause, but final postmenopausal hormone levels show large individual variation (1). This variation has many potential causes, but it may result, in part, from functionally significant sequence variation in genes encoding proteins involved in estrogen biosynthesis, transport, and metabolism (2). Variation in plasma E2 concentrations is associated with risk for diseases that range from breast cancer to osteoporosis (3). Before menopause, most circulating estrogen is produced in the ovary (4). However, after menopause, adipose tissue becomes the predominant source of estrogens (2). It is known that estrogens can influence the expression of the aromatase (CYP19A1) gene, which encodes the cytochrome P450 isoform that catalyzes the synthesis of estrone (E1) and E2 from androstenedione and testosterone, respectively (5). CYP19A1 maps to chromosome 15 q21.1 and contains multiple upstream promoters and exons that encode 5′-untranslated region (5′-UTR) sequences, which are differentially expressed in various tissues/cell types, including adipose tissue, skin, and bone (6). Single nucleotide polymorphisms (SNPs) in the CYP19A1 gene have been associated with variation in circulating estrogen concentrations and with breast cancer risk (7, 8).
The present study was performed in an attempt to identify novel genes that might influence circulating concentrations of E2 in postmenopausal women who recently underwent surgical resection for early stage estrogen receptor positive [ER(+)] breast cancer and who were candidates for adjuvant aromatase inhibitor therapy. Specifically, we obtained DNA and plasma before the initiation of aromatase inhibitor therapy to assay circulating E2 levels and to perform a discovery genome-wide association study (GWAS) for polymorphisms associated with plasma E2 concentrations. Of importance is the fact that we used a sensitive gas chromatography negative ionization tandem mass spectrometry (GC-MS/MS) E2 assay because our study population comprised postmenopausal women who already had decreased circulating E2 concentrations, and we planned to decrease those levels further by aromatase inhibitor therapy. The patients in this study were all breast cancer patients, but they were not receiving any treatment for breast cancer, although a small number had previously received tamoxifen well before blood samples were obtained for this study. The GWAS identified SNPs on chromosome 8 that mapped 3′ to the TSPYL5 gene and were associated with increased plasma E2 concentrations. TSPYL5 encodes “testis-specific Y-encoded-like protein 5”, a known breast cancer risk gene as well as a marker for poor outcomes in breast cancer patients (9). However, very little is known with regard to the biologic function of this protein, and there have been no previous reports of an association between TSPYL5 and circulating E2 concentrations.
During our pursuit of possible mechanisms that might explain this association, we observed that the variant allele for one of the E2-associated SNPs near TSPYL5 created a functional estrogen response element (ERE). We then took advantage of a genomic data-rich lymphoblastoid cell line (LCL)-based model system that has already proved to be a powerful tool both for generating pharmacogenomic hypothesis (8, 10) and for the functional pursuit of GWAS signals (11). Although, like all model systems, these LCLs have limitations, we cannot overemphasize the practical utility of this cell line model system for making it possible to link variation in genotype with variation in biochemical and molecular phenotypes. Specifically, we used the LCLs to show that variant chromosome 8 TSPYL5 SNP sequences were associated with increased TSPYL5 expression after exposure to E2 and, of direct relevance to the phenotype studied in the GWAS, that increased TSPYL5 expression was associated with increased expression of CYP19A1. We also demonstrated that TSPYL5 binds to a DNA sequence motif in the CYP19A1 I.4 “adipose tissue” promoter. When we scanned the genome with that DNA sequence motif, it was present 5′ of or within a number of genes, most of which were regulated in parallel with TSPYL5, as demonstrated by TSPYL5 knockdown or overexpression in adipocytes as well as MCF-7, IMR-90, and human embryonic kidney (HEK)293T cells. Furthermore, TSPYL5 bound to most these sequence motifs, as demonstrated by chromatin immunoprecipitation (ChIP) assay. Therefore, this series of experiments not only identified novel SNP biomarkers for plasma E2 levels in postmenopausal breast cancer patients but also a new transcription factor, TSPYL5, that appears to participant in the regulation of the expression of CYP19A1 as well as a number of other genes.
Materials and Methods
Source of patients
The study that was the source of our patients had enrolled postmenopausal women with resected early-stage breast cancer at the Mayo Clinic (Rochester, Minnesota, Jacksonville, Florida, and Scottsdale, Arizona), M.D. Anderson Cancer Center, and Memorial Sloan-Kettering Cancer Center. Eligibility criteria included postmenopausal status, stage I, II, or III breast cancer according to the American Joint Committee on Cancer (AJCC) Staging Manual (Sixth Edition), tumor that was ER and/or progesterone receptor (PgR) positive and planned treatment with the aromatase inhibitor anastrozole at the clinically approved dose of 1 mg per day. Patients could have already received tamoxifen, but prior exposure to other endocrine therapy was not permitted. None of the patients were receiving hormone replacement therapy at the time of the study. Two weeks or less before the initiation of anastrozole therapy, a blood sample was obtained for the isolation of DNA and for the assay of pretreatment plasma E2 concentrations. This study was reviewed and approved by local institutional review boards at all participating institutions. Written informed consent was obtained from each patient.
Hormone assays
A highly validated GC-MS/MS assay was used to measure E2 concentrations in 1.0 mL of human plasma (12). The lower limit of quantitation (LLQ) for E2 with this assay was 0.625 pg/mL. The standard used for the assay was > 98% pure E2 purchased from Steraloids (Newport, Rhode Island). For each batch of samples analyzed, two standard curves (“front” and “back”, with eight different E2 concentration levels in each standard curve) were prepared in water and quantified together with quality control (QC) samples (two replicates at low, mid, and high concentrations) prepared in charcoal-stripped plasma. Analytic runs were accepted when more than 75% of standards had back-calculated concentrations within ±15% of nominal. However, at the LLQ, ±20% of nominal concentrations was accepted. Quality control samples met accuracy requirements when they fell within ±15% of their nominal concentrations.
Specifically, E2 and its deuterated internal standard were extracted from 1 mL of plasma using Bond Elut Certify (Varian) solid-phase extraction cartridges. E2 was then eluted with ethyl acetate and was derivitized with pentafluorobenzoyl chloride and N-methyl-N-(trimethylsilyl)trifluoroacetamide. All solvents and reagents were purchased from EMD Product (Charlotte, North Carolina) or Sigma-Aldrich (St. Louis, Missouri). The derivatized analytes were separated on a Varian 3400 gas chromatograph (Block Scientific, Bohemia, New York) equipped with a DB-17-fused silica capillary column (15 m × 0.025 mm, J&W Scientific, Folsom, California) and were quantified using an interfaced Finnigan MAT TSQ-700 mass spectrometer (Finnigan MAT, Bremen, Germany) operating in single-ion monitoring tandem mass spectrometry-negative ion chemical ionization mode.
GWAS genotyping
Genotypes for DNA samples extracted from blood were determined at the RIKEN Center for Genomic Medicine in Yokahama, Japan, with Illumina Human610-Quad BeadChips. Illumina BeadStudio was used to call genotypes, and a series of QC parameters (see Supplemental Methods published on The Endocrine Society's Journals Online web site at http://mend.endojournals.org) was applied to exclude ambiguous calls.
Statistical analyses
GWAS genotype QC
Before analysis for associations between SNP genotypes and plasma E2 concentrations, extensive genotype QC was performed. Of the 835 samples initially genotyped, two had insufficient DNA; one sample failed genotyping; and one was removed because of questionable gender, leaving 831 samples. For the four duplicate samples studied, there were only 21 discordant SNP genotypes among the 2 368 944 comparisons made. For Centre d'Etude du Polymorphism Humain (CEPH) trios that were used as an additional control, there were 276 Mendelian errors out of the 592 236 genotypes evaluated. These results indicate excellent genotype quality. After removing the four subjects described previously, QC was completed for the 831 remaining subjects and the 592 236 SNPs that had been genotyped. SNPs were removed if they failed genotyping (12 849 SNPs), had a call rate less than 95% (0 SNPs), had minor allele frequencies (MAFs) less than 1% (15 282 SNPs), or had Hardy-Weinberg equilibrium (HWE) P value < 1E-06 (160 SNPs). This QC process resulted in a final total of 563 945 SNPs that were included in the association analysis.
Population stratification
Rather than relying on self-reported race, we used the genome-wide SNP data to determine three major racial groups, Caucasian, African American, and Han Chinese, based on the program STRUCTURE (13). This SNP data were obtained by genome-wide genotyping of Coriell Institute “Human Variation Panel” lymphoblastoid cell lines (LCLs), as described previously (14). These SNP data were used to “anchor” the STRUCTURE analysis. Patients were assigned to a racial group if their probability of falling into that group was more than 50%. One subject of ambiguous race was removed from the analysis (ie, the probability was < 0.50 for all three racial groups). To avoid bias that might arise from genetic substructure within racial groups, an eigen analysis was performed within each racial group using EIGENSTRAT (15). Eigenvectors corresponding to eigenvalues determined to be statistically different from zero based on the Tracy-Widom test were included as covariates in the analysis (16). This resulted in the inclusion of six eigenvectors in the model to adjust for substructure and population stratification.
Association analysis
Association analysis for plasma E2 concentrations was performed with each SNP genotype using an additive genetic model (ie, trend test in terms of number of minor alleles) for the 772 women who had plasma E2 and genotypic data that passed QC. In addition to the inclusion of race and eigenvectors in the model, we also included body mass index (BMI), age at enrollment, study site, prior chemotherapy, and ER/PgR status. BMI is known to be highly associated with level of E2 (17). If the value for the E2 concentration fell below the LLQ, the E2 concentration was set to zero. Because of skewness in the distribution of E2 concentrations and a large number of zero values, a quasi-likelihood model was used, in which the relationship between the mean and variance was modeled as Variance (X) = Expectation (X) (2) (ie, an overdispersed model) (18, 19). Additional information on model diagnostics is included in Results. Unless otherwise stated, all statistical analyses were conducted using the R statistical computing package SAS or PLINK (20).
Imputation and fine mapping
SNPs that had not been genotyped were imputed within 200 kb of the top associated SNP on chromosome 8, rs1864729, with BEAGLE v3.3.1 (21). Imputation was completed for all subjects using the entire set of haplotypes from the 1000 Genomes Project (22) from the 11/23/2010 release (N = 1094 subjects). Imputed markers with a quality score R2 < 0.30 or MAF < 0.01 were removed from the analyses. Association analysis for plasma E2 concentrations was then performed using the expected minor allele count or “dosage” with the same quasi-likelihood model used to analyze the genotyped SNP markers.
Forty-five imputed SNPs from the region in and near TSPYL5 as well as two SNPs in CYP19A1 were then genotyped at the RIKEN Center for Genomic Medicine using Invader technology. Six of these SNPs had also been genotyped on the Illumina array, providing an additional level of QC. Quality control and association analysis for these “fine-mapped” SNPs was performed using the approach that was used for the SNPs on the Illumina BeadChip array. Fourteen subjects with call rates less than 98% were removed from the fine-mapping analysis. Call rates for the fine mapped SNPs were greater than 99%, with only four discrepant calls (for rs2116422) between Illumina and Invader genotypes. These four discrepant genotype calls were treated as “missing” during the association analysis.
LCL transfection and culture
Three LCLs heterozygous for variant genotypes for the rs2583506 and rs1864729 SNPs, as well as three LCLs homozygous for WT sequences at these SNPs, were stably transfected with a pcDNA4.1-ERα construct provided by Dr. Thomas Spelsberg (Mayo Clinic, Rochester, Minnesota). Genotypes for the rs2583506 SNP in these six cell lines were confirmed by the amplification of genomic DNA using the following primers: forward, 5′-CATCACAACCTCACCCACAT-3′; reverse, 5′-CTGTCAGCTCTAGC CCCTTG-3′. These amplicons were sequenced using Sanger DNA sequencing as described previously (23). Genotypes for the rs1864729 SNP in these cells had been determined previously during GWAS genotyping. These six LCLs were then cultured in RPMI media containing 15% (vol/vol) fetal bovine serum (FBS) with 200 μg/mL Zeocin (Invitrogen, Grand Island, New York). Before E2 treatment, 2 × 10⁷ cells for each cell line were cultured for 24 hours in RPMI containing 5% (vol/vol) charcoal-stripped FBS with 200 μg/ml G418 (Invitrogen), followed by culture in the same medium without FBS for an additional 24 hours. All cells were then cultured for 24 hours in 12-well plates with RPMI 1640 medium that contained 0, 0.00001, 0.0001, 0.001, and 0.01 nM E2, and total RNA was isolated from the cells with the RNeasy mini kit (QIAGEN, Valencia, California). Total RNA (200 ng) was then used to perform quantitative RT-PCR (qRT-PCR) with TSPYL5, CYP19A1, and ERα primers (QIAGEN). TSPYL5 and CYP19A1 expression levels were “normalized” in each of the cell lines studied on the basis of ERα expression. Primers used to perform the CYP19A1 promoter amplifications are listed in Supplemental Table 1.
ChIP
ChIP assays were performed using the Imprint Ultra Chromatin Immunoprecipitation Kit (Sigma, St. Louis, Missouri). Both quantitative PCR and standard agarose gel-based PCR were used to monitor the ChIP results. PCRs contained 1.25 U of Taq polymerase enzyme (Promega Corp., Madison, Wisconsin), 1× reaction buffer, 1.5 mM MgCl2, 0.5 mM deoxynucleotide triphosphate (Invitrogen), 357 nM primers, and 2 μL of DNA from the ChIP assay in a final volume of 50 μL. PCR products (20 μl) were loaded on 1.2% agarose gels, and electrophoresis was performed at 100 V for 1.5 hours in 1× TAE buffer.
TSPYL5 knockdown and overexpression
HO3sD-96Wa differentiated adipocytes were obtained from Cell Applications, Inc. (San Diego, California). MCF-7, IMR-90, and HEK293T cells were obtained from American Type Culture Collection (ATCC, Manassas, Virginia), and all four cell lines were transfected with a TSPYL5 small interfering RNA (siRNA) smart pool (Dharmacon, Lafayette, Colorado) and FuGENE 6 (Roche, Indianapolis, Indianapolis) using lipofectamine iMAX (Invitrogen) for “knock down” studies or with 2 μg of pCMV6-XL4-TSPYL5 or pCMV6-XL4 as a control for TSPYL5 overexpression. Total RNA was isolated from the transfected HO3sD-96Wa, MCF-7, IMR-90, and HEK293T cells using the Quick RNA mini-prep kit (Zymo Research, Irvine, California), and 100 ng of total RNA was used to perform qRT-PCR with primers (IDT, Coralville, Iowa) for all 43 genes that were found to contain the TSPYL5 DNA-binding motif as were primers (QIAGEN) for TSPYL5 and β-actin. Proteins from transfected MCF-7 cells were extracted using CelLytic M Cell Lysis buffer (Sigma-Aldrich), were separated by electrophoresis on 4%–20% SDS-PAGE gels, and were transferred to polyvinylidene difluoride membranes (Bio-Rad Laboratories, Inc., Hercules, California). The polyvinylidene difluoride membranes were probed with anti-TSPYL5 antibody (Santa Cruz Biotechnology, Inc., Santa Cruz, California) diluted 1:1500 in 1% condensed milk blocking buffer or with anti-CYP19A1 antibody (Santa Cruz Biotechnology) diluted 1:1000 in blocking buffer. Protein bands were visualized using enhanced chemiluminescence (Thermo Scientific, Rockford, IL). An antiactin monoclonal antibody (Sigma) at a dilution of 1:5000 was used to detect actin.
Results
GWAS for plasma E2 concentrations
Our GWAS involved 772 women with early-stage breast cancer from whom blood samples for plasma hormone assay and DNA isolation had been obtained. Demographic and clinic data for these patients are listed in Table 1. After genome-wide SNP genotyping and QC, a total of 563 945 SNPs were included in the analysis. Figure 1A is a Manhattan plot showing the associations for these 563 945 SNPs with plasma E2 concentrations.
Table 1.
Patient Characteristics (n = 772)
| Source | Tumor ER/PgR Status | ||
| MCR | 182 (23.6%) | Negative/positive | 7 (0.9%) |
| MCF | 32 (4.1%) | Positive/negative | 152 (19.7%) |
| MCA | 78 (10.1%) | Positive/positive | 612 (79.3%) |
| MDA | 348 (45.1%) | Positive/unknowna | 1 (0.1%) |
| MSK | 132 (17.1%) | Tumor HER2 Status | |
| Age at time of study (years) | Negative | 667 (86.4%) | |
| Mean (sd) | 67.2 (9.5) | Positive | 91 (11.8%) |
| Median | 66.8 | Unknown | 14 (1.8%) |
| Range | (39.1–95.4) | Smoking Status | |
| Self-defined race | No | 718 (93%) | |
| European | 700 (90.7%) | Yes | 43 (5.6%) |
| African | 50 (6.4%) | Unknown | 11 (1.4%) |
| Asian | 17 (2.2%) | Prior Chemotherapy | |
| Native American | 5 (0.6%) | No | 461 (59.7%) |
| Self-defined ethnicity | Yes | 311 (40.3%) | |
| Hispanic | 65 (8.4%) | Prior Tamoxifen | |
| Non-Hispanic | 699 (90.5%) | No | 690 (89.4%) |
| Unknown | 8 (1.0%) | Yes | 82 (10.6%) |
| BMI | |||
| Mean (SD) | 27.9 (6.20) | ||
| Median | 27.0 | ||
| Range | (16.0–57.2) |
The table lists demographic data for the 772 breast cancer patients included in this study. MCR, Mayo Clinic Rochester; MCF, Mayo Clinic Florida; MCA, Mayo Clinic Arizona; MDA, MD Anderson Cancer Center; MSK, Memorial Sloan Kettering Cancer Center.
The Positive/Unknown sample was grouped with the Positive/Positive tumors for the statistical analysis.
Figure 1.

A, Manhattan Plot of GWAS for plasma E2 Concentrations. The figure shows the results of conditional regression analysis adjusted for eight eigenvectors. B, The chromosome 8 region surrounding the TSPYL5 gene from the Manhattan plot showing a plot of −log10 (P value) for observed (circles), imputed (diamonds), as well as imputed and then genotyped (red circles) SNPs. The location of the TSPYL5 gene is also indicated. C, A Q-Q plot is shown of observed vs expected results under the null hypothesis of no SNP association with plasma E2 concentrations.
The lowest P value observed was 3.49E-08, achieving the nominal value of 5E-08 required for genome-wide significance (24). A QQ plot of observed vs expected results under the null hypothesis of no association is shown in Figure 1C. The inflation factor was λ = 1.028 where an estimate of 1.0 indicates no inflation in the distribution of the test statistics. Acceptable levels of λ tend to be less than 1.05. Even though an inflation factor of 1.028 would be considered acceptable, we observed a slight inflation at the extreme tail of the QQ plot. Further investigation demonstrated that this was due to the top 1% of associated SNPs (see Supplemental Statistical Analysis Material for additional details), indicating a possible polygenic inheritance model (25).
The top 25 SNPs most highly associated with plasma E2 concentrations that were genotyped using the Illumina platform are listed in Table 2. Three of the top 10 genotyped SNPs, including the two SNPs with the lowest P values, 3.49E-08 and 6.49E-08, mapped to chromosome 8 near the TSPYL5 gene. Subsequent imputation across this area of chromosome 8 revealed a total of 17 additional SNPs with P values < 5E-08 (Table 3 and Figure 1B). All imputed chromosome 8 SNPs with low P values were then also genotyped, and the data shown in Figure 1B and listed in Table 3 for those SNPs are based on the genotyped data. All of the TSPYL5 SNPs with P values < 1E-08 were in high linkage disequilibrium or correlation (r2 > 0.9), and all had a MAF of approximately 0.10 (Table 2 and Table 3).
Table 2.
Top 25 Genotyped SNPs Most Highly Associated with Plasma E2 Concentrations
| SNP | Chr | bp Positiona | Effectb | Lower 95% CI | Upper 95% CI | P Value | MAF |
|---|---|---|---|---|---|---|---|
| rs1864729 | 8 | 98 351 365 | 1.589 | 1.350 | 1.871 | 3.49E-08 | 0.098 |
| rs2567769 | 8 | 98 367 024 | 1.581 | 1.341 | 1.864 | 6.49E-08 | 0.087 |
| rs11688246 | 2 | 85 559 188 | 1.832 | 1.469 | 2.285 | 1.04E-07 | 0.052 |
| rs4902141 | 14 | 62 038 148 | 2.161 | 1.629 | 2.867 | 1.23E-07 | 0.026 |
| rs12565140 | 1 | 33 701 345 | 1.425 | 1.247 | 1.629 | 2.52E-07 | 0.136 |
| rs2567768 | 8 | 98 372 327 | 1.532 | 1.305 | 1.800 | 2.61E-07 | 0.098 |
| rs12118390 | 1 | 80 683 702 | 2.253 | 1.658 | 3.060 | 2.62E-07 | 0.022 |
| rs4699587 | 4 | 95 834 792 | 1.763 | 1.416 | 2.194 | 4.79E-07 | 0.048 |
| rs16906958 | 8 | 80 683 200 | 1.857 | 1.461 | 2.361 | 5.38E-07 | 0.043 |
| rs7072122 | 10 | 44 354 678 | 1.730 | 1.397 | 2.141 | 6.03E-07 | 0.051 |
| rs4761470 | 12 | 93 207 335 | 1.375 | 1.214 | 1.556 | 6.14E-07 | 0.177 |
| rs10515260 | 5 | 97 102 304 | 1.913 | 1.485 | 2.463 | 6.34E-07 | 0.035 |
| rs11107531 | 12 | 93 325 452 | 1.328 | 1.187 | 1.485 | 8.31E-07 | 0.243 |
| rs17339671 | 4 | 95 832 198 | 1.467 | 1.259 | 1.709 | 1.14E-06 | 0.107 |
| rs16832889 | 3 | 183 333 978 | 3.085 | 1.965 | 4.844 | 1.20E-06 | 0.011 |
| rs17042688 | 2 | 52 365 298 | 1.911 | 1.474 | 2.476 | 1.20E-06 | 0.038 |
| rs10501858 | 11 | 125 535 825 | 1.539 | 1.295 | 1.829 | 1.24E-06 | 0.091 |
| rs1953248 | 14 | 62 192 760 | 1.613 | 1.331 | 1.953 | 1.25E-06 | 0.073 |
| rs12620464 | 2 | 101 396 078 | 1.397 | 1.221 | 1.597 | 1.29E-06 | 0.143 |
| rs12475021 | 2 | 52 388 911 | 1.917 | 1.476 | 2.492 | 1.36E-06 | 0.037 |
| rs6077414 | 20 | 8 652 552 | 1.466 | 1.257 | 1.711 | 1.41E-06 | 0.092 |
| rs478665 | 1 | 65 288 121 | 1.772 | 1.407 | 2.233 | 1.45E-06 | 0.050 |
| rs727333 | 21 | 40 624 817 | 1.542 | 1.295 | 1.837 | 1.47E-06 | 0.081 |
| rs724767 | 3 | 195 205 024 | 1.436 | 1.241 | 1.663 | 1.52E-06 | 0.115 |
| rs11548323 | 1 | 27 604 238 | 1.396 | 1.219 | 1.598 | 1.70E-06 | 0.170 |
Bold face, are the three SNPs in or near the TSPYL5 gene.
Table 3.
Imputed (I) and subsequently genotyped chromosome 8 SNPs surrounding TSPYL5 (all with P < 5E-08). O, observed during GWAS genotyping
| SNP | Chr | bp Positiona | Effectb | Lower 95% CI | Upper 95% CI | P Value | MAF | Imputed (I) or Observed (O) |
|---|---|---|---|---|---|---|---|---|
| rs2451114 | 8 | 98273762 | 1.64441 | 1.402311 | 1.928305 | 1.50E-09 | 0.100361 | I |
| rs2451113 | 8 | 98273448 | 1.63402 | 1.389243 | 1.921925 | 4.62E-09 | 0.093637 | I |
| rs2439702 | 8 | 98272647 | 1.631933 | 1.385699 | 1.921922 | 6.60E-09 | 0.093863 | I |
| rs2053480 | 8 | 98278951 | 1.627991 | 1.383235 | 1.916056 | 6.84E-09 | 0.093149 | I |
| rs2567773 | 8 | 98279182 | 1.627991 | 1.383235 | 1.916056 | 6.84E-09 | 0.092659 | I |
| rs2853312 | 8 | 98281319 | 1.619799 | 1.377337 | 1.904943 | 8.27E-09 | 0.094952 | I |
| rs2635162 | 8 | 98283629 | 1.621225 | 1.374058 | 1.912853 | 1.50E-08 | 0.098439 | I |
| rs2583506 | 8 | 98281847 | 1.614156 | 1.369888 | 1.90198 | 1.55E-08 | 0.101205 | I |
| rs1348184 | 8 | 98276912 | 1.615936 | 1.37075 | 1.90498 | 1.58E-08 | 0.098558 | I |
| rs2053481 | 8 | 98278923 | 1.615936 | 1.37075 | 1.90498 | 1.58E-08 | 0.098439 | I |
| rs2439700 | 8 | 98277168 | 1.615936 | 1.37075 | 1.90498 | 1.58E-08 | 0.098193 | I |
| rs2853318 | 8 | 98283509 | 1.611976 | 1.367697 | 1.899885 | 1.78E-08 | 0.097839 | I |
| rs2853320 | 8 | 98283523 | 1.611976 | 1.367697 | 1.899885 | 1.78E-08 | 0.097839 | I |
| rs2583504 | 8 | 98283404 | 1.612618 | 1.367138 | 1.902177 | 2.03E-08 | 0.098676 | I |
| rs1431891 | 8 | 98282716 | 1.606092 | 1.362664 | 1.893006 | 2.29E-08 | 0.099159 | I |
| rs1835743 | 8 | 98282643 | 1.606092 | 1.362664 | 1.893006 | 2.29E-08 | 0.09904 | I |
| rs2635161 | 8 | 98282907 | 1.606092 | 1.362664 | 1.893006 | 2.29E-08 | 0.098676 | I |
| rs1864729 | 8 | 98282189 | 1.589376 | 1.350376 | 1.870676 | 3.49E-08 | 0.09807 | O |
Genome Build 37.
Multiplicative effect from quasi-likelihood model.
Plasma E2 concentrations
Plasma E2 concentrations in patients enrolled in this study displayed substantial individual variation (mean = 5.6 pg/mL, SD = 6.9, median = 4.0, 25th percentile = 2.5, 75th percentile = 6.6, max = 111.0). Plasma E2 concentrations in patients homozygous for the variant rs1864729 SNP observed during GWAS genotyping had average plasma E2 concentrations more than 2-fold higher (11.15 pg/mL) than those in subjects homozygous for the wild-type (WT) allele (5.00 pg/mL) (Figure 2A). Even though plasma E2 concentrations for some of the patients were more than 10 pg/mL, all of these women had been considered clinically postmenopausal by their referring oncologist. BMI values for these women also varied greatly, ranging from 16.0 to 57.2, with mean and SD values of 27.9 and 6.20, respectively. The median age at the time of enrollment in the study was 66.8 years, with a range from 39.1 to 95.4 years. 40.3% of patients had received prior chemotherapy, whereas 10.6% had prior tamoxifen treatment. In a previous preliminary study of E2 concentrations in the initial 200 patients enrolled in this study, we reported that two SNPs in the CYP19A1 “placental promoter”, I.1, were associated with elevated plasma E2 concentrations (8). When we genotyped those SNPs and examined their association with plasma E2 concentration in the present group of 772 women, we confirmed a strong association between these two SNPs and plasma E2 concentrations (P values of 1E-04 for rs6493497 and 5.69E-05 for rs7176605).
Figure 2.
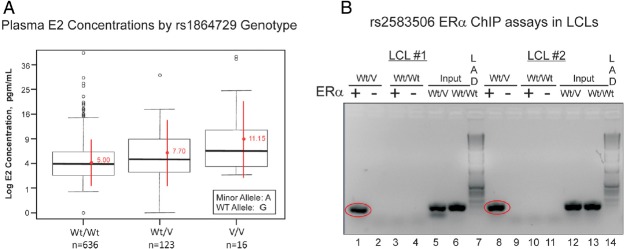
A, Box Plots Of Log Plasma E2 Concentrations Expressed as Picograms per mL by rs1864729 SNP Genotype. The horizontal lines within each box show median values, whereas the red points are mean values for homozygous wild type (Wt/Wt), heterozygous (Wt/V), and homozygous variant SNP (V/V) SNP genotypes. Extreme values are also shown. The number of subjects in the study with each genotype is also listed. B, ChIP assay using ERα stably transfected LCLs with known genotypes for the rs2583506 SNP. Lanes 1–4 and 8–11 are PCR products for DNA that was immunoprecipitated with human ERα antibody. The “input” material for the variant and WT heterozygous (Wt/V) and WT homozygous (Wt/Wt) samples were PCR amplification products from pools of sheared DNA for the entire genome. Lanes 1–6 are ChIP assays for one Wt/Wt and Wt/V LCL pair, and lanes 8–13 are ChIP assays for another pair of LCLs. Lanes 7 and 14 are Invitrogen (Carlsbad, CA) 1-kb DNA ladders.
TSPYL5 SNPs and function
We next asked whether any of the chromosome 8 SNPs with P values < 5E-08 might create or disrupt a DNA sequence motif that might participate in the regulation of transcription. The TRANSFAC database predicted that the variant allele for the rs2583506 SNP (see Figure 1B) created an estrogen response element (ERE). To test that possibility experimentally, we performed a ChIP assay with two sets of LCLs stably transfected with ERα that were either homozygous for the WT allele or were heterozygous for rs2583506. Because of the low MAF of rs2583506 (0.10), even though we had 40 LCLs that were stably transfected with ERα, we had no cell lines that were homozygous for the variant allele. ChIP assay after incubation with E2 showed that DNA surrounding the rs2583506 SNP that was isolated from LCLs with heterozygous genotypes did bind ERα, but DNA from homozygous WT LCLs did not (Figure 2B), thus functionally confirming the database prediction and demonstrating that the rs2583506 SNP created a functional ERE.
TSPYL5 and CYP19A1 expression
Because the SNPs in TSPYL5 that are shown graphically in Figure 1B had been identified on the basis of their association with plasma E2 concentrations, we next determined whether TSPYL5 might influence the expression of CYP19A1, the gene encoding the cytochrome P450 isoform that catalyzes estradiol synthesis, ie, “aromatase” (26). Specifically, we performed qRT-PCR for both TSPYL5 and CYP19A1 mRNA expression after either knocking down TSPYL5 mRNA expression using siRNA, or overexpressing TSPYL5 in three different types of cells, beginning with MCF-7 cells because all of our patients suffered from breast cancer. Because CYP19A1 has 10 different promoters that drive expression in a tissue-specific fashion (27) (Figure 3A), we performed qRT-PCR for all 10 upstream exons that encode 5′-UTR sequences for this gene. It should be emphasized that the tissue specificities listed in the diagram in Figure 3A are only generalizations, and many of these promoters are active in several different tissues. Specifically, we used separate primers for each of the 5′-UTR sequences (see Figure 3A), in each case paired with a single 3′-primer that hybridized within the open reading frame of the CYP19A1 gene (see Supplemental Table 1 for primer sequences). The goal of these experiments was to assay CYP19A1 mRNA expression that was driven by different promoters. In the MCF-7 cells, only the I.4 promoter that primarily drives aromatase expression in adipose tissue and skin was detected. That observation was of interest because most circulating E2 in postmenopausal women originates from adipose tissue (28), another cell type that we studied, as described in subsequent paragraphs. When TSPYL5 was overexpressed 48-fold in MCF-7 cells as determined by qRT-PCR, expression of the CYP19A1 I.4 promoter increased approximately 4-fold (Figure 3B, left panel). Obviously, data obtained using overexpression must always be interpreted with caution. Therefore, we also tested the effect of TSPYL5 knockdown. When TSPYL5 was knocked down to 24% of baseline by using a siRNA pool, expression of the I.4 CYP19A1 promoter was decreased to 50% of the basal value (Figure 3B, right panel). Western blot analyses showed that protein levels for both TSPYL5 and CYP19A1 in MCF-7 cells (Figure 3C) paralleled the results of assays of mRNA expression (Figure 3B). It should be pointed out that basal levels of CYP19A1 mRNA expression in the MCF-7 cells were relatively low, as reported previously by Zhou, Pampon, and Shen in 1990 (29).
Figure 3.

A, Schematic diagrams of promoters for the CYP19A1 gene. The relative tissue specificity for each promoter is listed. The skin/adipose I.4 promoter is highlighted in red. B, TSPYL5 and CYP19A1 skin/adipose tissue promoter mRNA expression levels after TSPYL5 overexpression (OE) and knockdown (KD) in MCF-7 cells. *. P < .05; **, P < .01; and ***, P < .001 when compared with baseline. C, Western blot analyses of TSPYL5 and CYP19A1 protein levels after TSPYL5 was knocked down (KD) or overexpressed (OE) in MCF-7 cells. CON, control.
Having demonstrated that TSPYL5 expression was associated with the expression of CYP19A1 in MCF-7 cells, we next wanted to determine the possible effect of different TSPYL5 SNP genotypes on the expression of the TSPYL5 gene and whether exposure to estrogens might influence TSPYL5 expression because one of the variant SNPs, rs2583506, created a functional ERE. We then wanted to determine the possible relationship of TSPYL5 SNP-dependent expression with the expression of CYP19A1. As mentioned previously, we had stably transfected a series of Human Variation Panel LCLs with known genotypes for rs1864729, rs2567769, and rs2583506 with ERα. We should emphasize once again the importance of the availability of this genomic data-rich human cell line model system for testing the relationship of variant genotypes to biochemical phenotypes. Specifically, we exposed three LCLs that were homozygous WT for these SNPs and three LCLs that were heterozygous to increasing concentrations of E2 for 24 hours. Cell lines with heterozygous genotypes, ie, those that included the functional ERE created by the rs2583506 SNP variant allele, showed significantly greater E2 dose-dependent TSPYL5 induction after exposure to increasing concentrations of E2 than did homozygous WT LCLs (Figure 4, upper left). Of equal interest, transcripts encoded by three different CYP19A1 promoters (see Figure 3A) were also induced in parallel with the TSPYL5 induction and also showed greater induction in cell lines that carried the rs2583506 variant genotype and, as a result, that had an additional functional ERE near the TSPYL5 gene. Specifically, the I.4 skin/adipose promoter (Figure 4, upper right), the I.3 adipose tissue/breast cancer promoter (Figure 4, lower left), and the I.1 placenta promoter of CYP19A1 (Figure 4, lower right) were all significantly induced after E2 exposure of LCLs heterozygous for variant TSPYL5 rs2583506 genotypes, but not in cell lines homozygous for the WT allele. These results suggested that TSPYL5, either directly or indirectly, increased the expression of CYP19A1. Because most estrogen in postmenopausal women is derived from adipose tissue, the next series of experiments was designed to test the possible relationship of TSPYL5 expression to that of CYP19A1 in human adipocytes.
Figure 4.
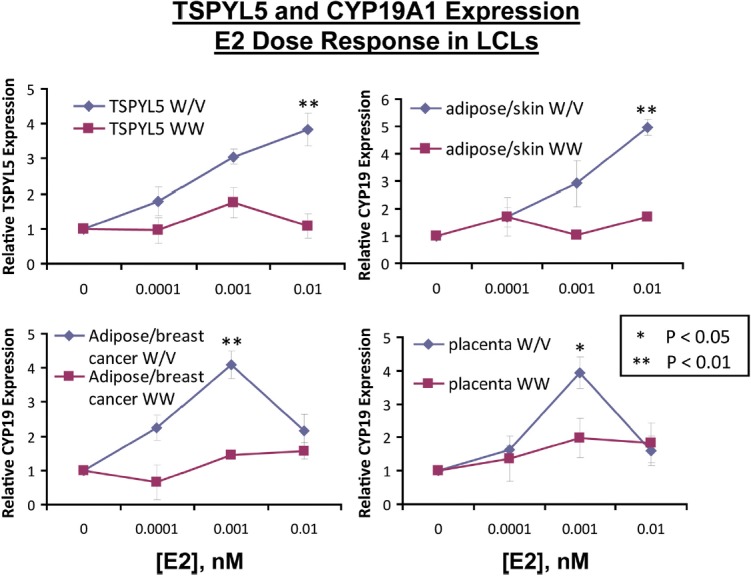
SNP-Dependent Differences in TSPYL5 Expression in Response to Increasing Concentrations of E2 for Three LCLs Heterozygous (Wt/V, blue lines) for TSPYL5 SNPs, and Three LCLs Homozygous for Wt SNP Alleles (Wt/Wt, red lines). All LCLs were stably transfected with ERα. The upper left panel shows relative TSPYL5 mRNA expression, the upper right panel shows relative mRNA expression level for CYP19A1 due to the skin/adipose promoter, the lower left panel shows relative mRNA expression level for CYP19A1 due to the adipose/breast cancer promoter, and the lower right panel shows relative mRNA expression level for CYP19A1 due to the placental promoter. *. P < .05; **, P < .01 when compared with the alternative genotype at the same E2 concentration.
Specifically, we both knocked down and overexpressed TSPYL5 in HO3sD-96Wa human adipocytes in experiments similar to those performed with MCF-7 cells that are shown graphically in Figure 3, B and C. Because the LCL studies had shown a TSPYL5 SNP-dependent difference in the expression of CYP19A1 that was driven by the I.4 (skin adipose), I.3 (breast cancer-adipose), and I.1 (placenta) promoters, we tested in adipocytes the expression of CYP19A1 mRNA that was driven by all three of those promoters. As shown in Figure 5A, overexpression of TSPYL5 resulted in significant increases in CYP19A1 expression associated with all three promoters, whereas knockdown resulted in significant decreases for all except the I.1 promoter. Just as in the case of the MCF-7 cells (Figure 3C), Western blot analyses confirmed the qRT-PCR results (Figure 5B). The next series of experiments was performed to test the hypothesis that TSPYL5 might bind DNA sequences in the CYP191A I.4 promoter.
Figure 5.

A, TSPYL5 and CYP19A1 mRNA expression levels after TSPYL5 overexpression (OE) (red bars) and knockdown (KD) (blue bars) in HO3sD-96Wa human adipocytes. B, Western blot analysis of TSPYL5 and CYP19A1 protein levels after TSPYL5 OE or KD in HO3sD-96Wa human adipocytes. *, P < .05; **, P < .01. Neg, negative.
TSPYL5 binds to the CYP19A1 I.4 promoter
We had demonstrated that TSPYL5 appeared to influence CYP19A1 expression in MCF-7 cells, LCLs, and adipocytes by acting through the CYP19A1 I.4 promoter (Figure 3, B and C, Figure 4, and Figure 5A). To determine whether TSPYL5 might be capable of binding directly to the CYP19A1 I.4 promoter, we designed a series of qPCR primers to amplify overlapping sequences (50–90 bp in length) across the length of the I.4 promoter and used ChIP assays to determine whether any portion of the promoter might include DNA sequence motifs to which TSPYL5 might bind. Both qPCR and DNA-agarose gel-based ChIP assays performed with TSPYL5 antibody indicated that an approximately 120-bp region of DNA in the I.4 promoter, a region that was amplified by the F2R3 and F2R5 primer pairs, appeared to bind TSPYL5 (Figure 6). The sequence of the approximately 120-bp DNA region to which TSPYL5 bound in the CYP19A1 skin/adipose I.4 promoter was 5′-GCCCTCTGGAATCTGTGAAATCTAGAAACTAGATTGGGAAAA CTCTGACACCCCTGCCCCATGACCAACCAAGACTAAGAGTCCCAGGAAGATTGAGGTCACAGAAGGCAGAGGCCTG-3′. We then performed a BLAST (Basic Local Alignment Search Tool) homology search across the genome with this 120-bp sequence and identified a large number of genes that contained a portion of the 120-bp region, either within the gene or up to 1000 bp 5′- of the gene. We next aligned all of those sequences and identified a 5′-TCANNGAAGGCAG-3′ motif that was present in 43 of the genes that we had identified during the BLAST search. Those 43 genes are listed in Table 4.
Figure 6.
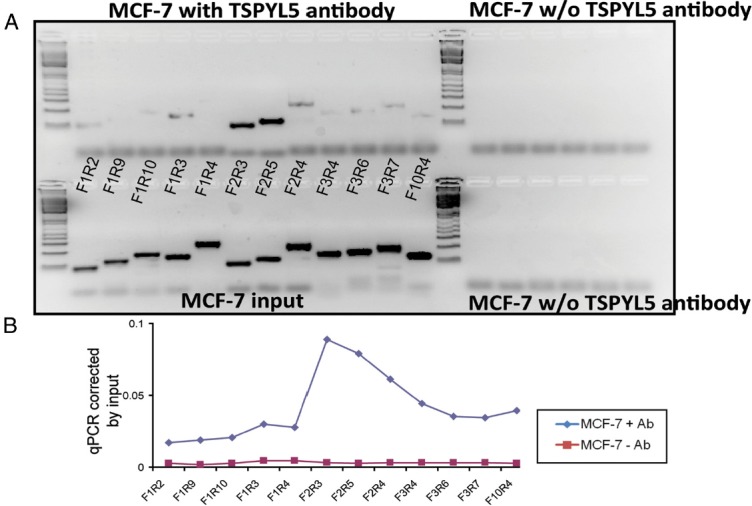
ChIP Assays in MCF-7 Cells Using TSPYL5 Antibody. A, The upper panel shows PCR amplification after ChIP assay using different primer pairs within the skin/adipose promoter region of the CYP19A1 gene in MCF-7 cells. B, The lower panel shows qPCR quantification of the same ChIP assay shown in panel A. Ab, Antibody; w/o, without.
Table 4.
(A) Forty-three genes containing a putative TSPYL5 DNA binding motif 5′-TCANNGAAGGCAG-3′. (B) The 21 genes containing this motif 5′ to the site of transcription initiation with expression that correlated with TSPYL5 expression in at least 2 cell lines. (C) The 7 genes containing this motif 5′ to the site of transcription initiation with expression that was correlated with TSPYL5 expression in all 3 cell lines tested
| A. Genes with the putative binding motif | |||
| CAST | CRYBA4 | DCLK2 | MRPL39 |
| TASP1 | MN1 | SPATA16 | PLCL1 |
| FBXW7 | SEC14L3 | NLGN1 | GABRD |
| AZIN1 | SEC14L4 | CYP11B1 | NRXN1 |
| FBXW72 | CNTNAP2 | NCAM2 | NR3C1 |
| CAST | DTD1 | MRPS30 | RWDD3 |
| ATP13A5 | ASB3 | ESF1 | F11R |
| GPHN | PTBP2 | CYP19A | FUT8 |
| CRYBA4 | DCLK2 | XRXN1 | GLDN |
| SEC14L3 | CNTNAP2 | PET112L | HDAC4 |
| USP24 | WRXN | DYDC1 | |
| B. Genes with the putative binding motif and expression that correlated with TSPYL5 expression in two of the cell lines tested | |||
| FBXW7 | CAST | F11R | PTBP2 |
| FUT8 | ASB3 | MN1 | DCLK2 |
| SPATA16 | GABRD | ESF1 | PET112L |
| TASP | HDAC4 | USP24 | MRPL39 |
| GDHN | NCAM2 | MRPS30 | AZIN1 |
| DCLK2 | |||
| C. Genes with the putative binding motif and expression that correlated with TSPYL5 expression in all three cell lines tested | |||
| FBXW7 | CAST | F11R | PRBP2 |
| FUT8 | ASB3 | MN1 |
The next step involved an attempt to determine whether TSPYL5 might regulate the expression of the genes listed in Table 4. To do that, we both knocked down TSPYL5 mRNA expression with a siRNA pool and overexpressed TSPYL5 in MCF-7, IMR-90, and HEK293T cells, all of which display high basal expression of TSPYL5 mRNA. That made it possible to use qRT-PCR to test the effect of TSPYL5 knockdown or overexpression on expression levels of the genes listed in Table 4A. After the removal of 16 genes that were not expressed in all three of the cell lines, we found that when TSPYL5 was knocked down to less than 7% of baseline in MCF-7 cells, the expression of 26 of the 27 genes of interest expressed in that cell line also decreased (Figure 7A, blue bars). Conversely, when TSPYL5 was overexpressed 5.7-fold, the expression of 16 of the 27 genes increased (Figure 7A, red bars). In a similar fashion, after TSPYL5 was knocked down to 5% of the basal level in IMR-90 cells, the expression of 24 of 25 genes expressed in that cell line also decreased, and when TSPYL5 was overexpressed 347-fold, the expression of 9 of the 25 expressed genes increased (Figure 7B). In HEK293T cells, when TSPYL5 expression was knocked down to 19% of baseline, the expression of 24 of the 27 genes listed in Table 4A expressed in that cell line decreased and, when TSPYL5 was overexpressed 7843-fold, the expression of 22 of the 27 genes increased (Figure 7C).
Figure 7.
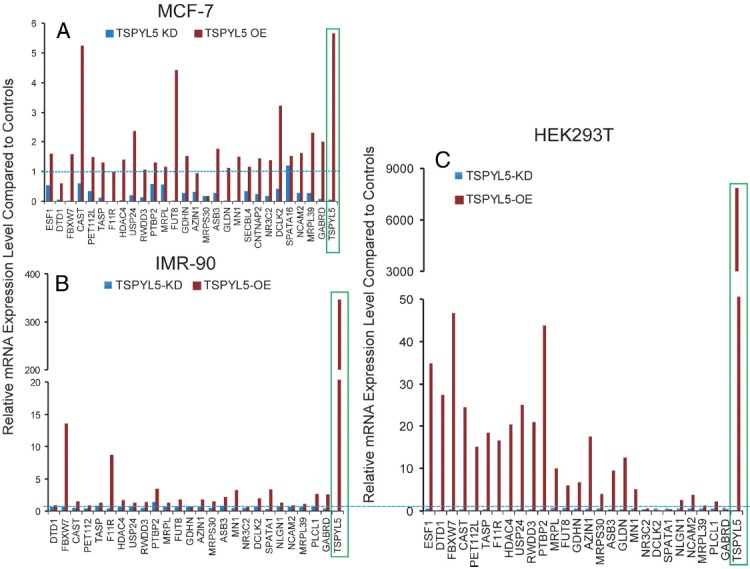
Effect of TSPYL5A Overexpression (OE) and Knockdown (KD)on the Relative mRNA Expression of Genes That Contain the Putative TSPYL5 DNA Binding Motif in (A) MCF-7, (B) IMR-90, and (C) HEK293T Cells. Red bars represent data for TSPYL5 overexpression and blue bars represent data for TSPYL5 knockdown. The blue dash lines represent control levels of expression.
When we combined the results for all three cell lines, we found that seven of the 45 genes showed the same directional expression changes in all three cell lines (Table 4C), and 21 of the 45 genes showed the same pattern of regulation in at least two of the three cell lines (Table 4B). Finally, to determine whether TSPYL5 might physically bind to the hypothetical “TSPYL5” binding motifs present in these genes, we performed ChIP assays in MCF-7 cells using TSPYL5 antibody and detected binding to the area surrounding the predicted motif by using primers designed to detect TSPYL5 binding to or near the target sequence motif. The sequences of the primers used to perform these ChIP assays are listed in Supplemental Table 2. In some genes there was more than one of these putative TSPYL5 DNA binding motifs, so we performed ChIP assays to test all of the potential TSPYL5 binding sites (Figure 8). We found that 21 of the 43 genes listed in Table 4A displayed TSPYL5 binding to or near the sequence motif that we had identified during our BLAST analyses (Figure 8).
Figure 8.
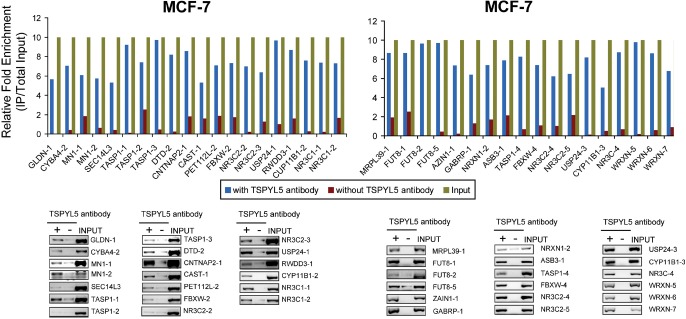
ChIP Assays That Demonstrate the Binding of TSPYL5 to Areas of Genes That Contained the Putative TSPYL5 DNA Binding Motif. ChIP was performed in MCF-7 cells with anti-TSPYL5 antibody. In each case the top panel shows the results of qRT-PCR demonstrating the relative enrichment of TSPYL5 DNA motif sequences after immunoprecipitation with anti-TSPYL5 antibody (blue) as compared with no antibody (IgG only) (orange). Sequences of primers utilized to perform these assays are listed in Supplemental Table 2. At the bottom of each figure are ChIP results after PCR amplification shown relative to input on a 1.0% agarose gel. Some genes contained more than one TSPYL5 DNA binding motif, so they were labeled as “-1”, “-2”, “-3” etc.
Discussion
Plasma E2 concentrations decrease approximately 50-fold after menopause, but these decreased levels of E2 continue to show large individual variation (30). That variation may play a role in disease pathophysiology or risk (31). Therefore, we performed a discovery GWAS in an attempt to identify novel genetic factors that might play a role in variation in postmenopausal plasma E2 concentrations. It should be emphasized that all of our subjects were women with early stage ER(+) breast cancer who were candidates for 5 years of aromatase inhibitor therapy to help prevent recurrence. Therefore, we are unable to conclude that our observations would also apply to women who do not suffer from breast cancer. In future studies, the possible contribution of TSPYL5 SNPs to variation in plasma E2 concentrations in women without breast cancer will have to be determined. Because our study was designed to test the hypothesis that inheritance might alter response to aromatase inhibitors, and because aromatase inhibitor therapy lowers the already low postmenopausal E2 concentrations studied here, we used a sensitive GC-MS/MS method to assay plasma E2 levels. We observed a series of genome-wide significant SNPs in and near the TSPYL5 gene that were associated with plasma E2 concentrations in these patients (Figure 1, A and B).
The most significant of the TSPYL5 SNPs on the GWAS genotyping platform had association P values of less than 5E-08, ie., it was genome-wide significant (Figure 1B). Furthermore, one of the imputed SNPs, rs2583506, created a functional ERE based on the results of ChIP assay (Figure 2B), and the expression of TSPYL5 in LCLs heterozygous for the variant allele showed E2-dependent induction of TSPYL5 mRNA expression, whereas little change was seen in cell lines homozygous for the WT allele (Figure 4)—all observations compatible with the creation of a functional ERE by the variant allele. These observations represent the first demonstration of a relationship between circulating E2 concentrations and the expression of TSPYL5. That could be important because circulating estrogen concentrations represent a risk factor for breast cancer (32) and because TSPYL5 expression has been reported to be associated with increased risk for breast cancer (9). Therefore, the observations included in the present report may help to explain why TSPYL5 is a risk factor for poor outcomes in patients with breast cancer. Because plasma E2 in postmenopausal women is derived mainly from adipose tissue, it is also relevant that we found that expression driven by the skin/adipose I.4 CYP19A1 promoter was correlated with TSPYL5 expression in MCF-7 cells, with increased CYP19A1 expression both at the RNA and protein levels (Figure 3, B and C). Furthermore, in LCLs with known genotypes for the TSPYL5 SNPs, expression of TSPYL5 paralleled not only that of the CYP19A1 I.4 (skin/adipose), but also the I.3 (adipose/breast cancer) and I.1 (placenta) promoters after exposure to increasing concentrations of E2 (Figure 4). These same three CYP19A1 promoters also appeared to be associated with the TSPYL5-dependent induction of aromatase mRNA and protein in human adipocytes (Figure 5). The present results also supported our earlier report based on DNA samples from the initial 200 participants in this study that two SNPs in the CYP19A1 I.1 promoter were associated with increased aromatase activity and increased plasma E2 concentration (8). Finally, we demonstrated that TSPYL5 bound directly to the I.4 skin/adipose promoter of CYP19A1, as shown by ChIP assay (Figure 6), as well to a putative TSPYL5 binding motif in a number of other genes with mRNA expression that was influenced by TSPYL5 overexpression or knockdown (Table 4 and Figures 7 and 8).
In summary, the effect of the variant SNP genotypes that we observed in or near TSPYL5 in postmenopausal women is to increase the level of TSPYL5 expression in response to E2, as well as downstream, CYP19A1 expression, resulting in increased biosynthesis of E2 and increased circulating levels of E2, ie., a positive feedback loop. These results not only provide insight into a novel genomic mechanism for the regulation of aromatase gene expression and, thus, plasma E2 concentrations in postmenopausal women with ER(+) breast cancer, but they also raise the possibility of a novel role for TSPYL5 as a transcription factor that can influence the expression of many genes (see Table 4) other than CYP19A1.
Acknowledgments
This work was supported, in part, by National Institutes of Health Grants U19 GM61388 (The Pharmacogenomics Research Network-The RIKEN Center for Genomic Medicine (CGM) Global Alliance, R01 GM28157, U01 HG005137, R01 CA138461, R01 CA133049, P50 CA166201 (Mayo Clinic Breast Cancer Specialized Program of Research Excellence), a PhRMA Foundation Center of Excellence in Clinical Pharmacology Award, and a generous gift from the Atwater Foundation, ClinicalTrials.gov study number NCT00283608.
Current address for B.L.F.: Department of Biostatistics, University of Kansas Medical Center, Kansas City, Kansas 66160.
Disclosure Summary: The authors have no conflict of interest.
Footnotes
- BMI
- body mass index
- ChIP
- chromatin immunoprecipitation
- E2
- estradiol
- ER
- estrogen receptor
- ERE
- estrogen response element
- FBS
- fetal bovine serum
- GC-MS/MS
- gas chromatography negative ionization tandem mass spectrometry
- GWAS
- genome-wide association study
- HEK
- human embryonic kidney
- LCL
- lymphoblastoid cell line
- LLQ
- lower limit of quantitation
- MAF
- minor allele frequency
- PgR
- progesterone receptor
- QC
- quality control
- qRT-PCR
- quantitative RT-PCR
- siRNA
- small interfering RNA
- SNP
- single nucleotide polymorphism
- UTR
- untranslated region
- WT
- wild type.
References
- 1. Ingle JN, Buzdar AU, Schaid DJ, et al. Variation in anastrozole metabolism and pharmacodynamics in women with early breast cancer. Cancer Res. 2010;70:3278–3286 [DOI] [PMC free article] [PubMed] [Google Scholar]
- 2. Neven P. The origin of postmenopausal oestrogens. Eur J Cancer. 2002;38(suppl 6):S29–S30 [DOI] [PubMed] [Google Scholar]
- 3. Schuit SC, de Jong FH, Stolk L, et al. Estrogen receptor alpha gene polymorphisms are associated with estradiol levels in postmenopausal women. Eur J Endocrinol. 2005;153:327–334 [DOI] [PubMed] [Google Scholar]
- 4. Lucisano A, Acampora MG, Russo N, Maniccia E, Montemurro A, Dell'Acqua S. Ovarian and peripheral plasma levels of progestogens, androgens and oestrogens in post-menopausal women. Maturitas. 1984;6:45–53 [DOI] [PubMed] [Google Scholar]
- 5. Kinoshita Y, Chen S. Induction of aromatase (CYP19) expression in breast cancer cells through a nongenomic action of estrogen receptor alpha. Cancer Res. 2003;63:3546–3555 [PubMed] [Google Scholar]
- 6. Simpson ER, Mahendroo MS, Means GD, et al. Aromatase cytochrome P450, the enzyme responsible for estrogen biosynthesis. Endocr Rev. 1994;15:342–355 [DOI] [PubMed] [Google Scholar]
- 7. Shozu M, Akasofu K, Harada T, Kubota Y. A new cause of female pseudohermaphroditism: placental aromatase deficiency. J Clin Endocrinol Metab. 1991;72:560–566 [DOI] [PubMed] [Google Scholar]
- 8. Wang L, Ellsworth KA, Moon I, et al. Functional genetic polymorphisms in the aromatase gene CYP19 vary the response of breast cancer patients to neoadjuvant therapy with aromatase inhibitors. Cancer Res. 2010;70:319–328 [DOI] [PMC free article] [PubMed] [Google Scholar]
- 9. Epping MT, Meijer LA, Krijgsman O, Bos JL, Pandolfi PP, Bernards R. TSPYL5 suppresses p53 levels and function by physical interaction with USP7. Nat Cell Biol. 2011;13:102–108 [DOI] [PubMed] [Google Scholar]
- 10. Li L, Fridley B, Kalari K, et al. Gemcitabine and cytosine arabinoside cytotoxicity: association with lymphoblastoid cell expression. Cancer Res. 2008;68:7050–7058 [DOI] [PMC free article] [PubMed] [Google Scholar]
- 11. Ingle JN, Schaid DJ, Goss PE, et al. Genome-wide associations and functional genomic studies of musculoskeletal adverse events in women receiving aromatase inhibitors. J Clin Oncol. 2010;28:4674–4682 [DOI] [PMC free article] [PubMed] [Google Scholar]
- 12. Prokai-Tatrai K, Bonds D, Prokai L. Simultaneous measurement of 17β-estradiol, 17α-estradiol and estrone by GC-isotope dilution MS/MS. Chromatographia. 2010;71:311–315 [DOI] [PMC free article] [PubMed] [Google Scholar]
- 13. Pritchard JK, Stephens M, Donnelly P. Inference of population structure using multilocus genotype data. Genetics. 2000;155:945–959 [DOI] [PMC free article] [PubMed] [Google Scholar]
- 14. Niu N, Qin Y, Fridley BL, et al. Radiation pharmacogenomics: a genome-wide association approach to identify radiation response biomarkers using human lymphoblastoid cell lines. Genome Res. 2010;20:1482–1492 [DOI] [PMC free article] [PubMed] [Google Scholar]
- 15. Price AL, Patterson NJ, Plenge RM, Weinblatt ME, Shadick NA, Reich D. Principal components analysis corrects for stratification in genome-wide association studies. Nat Genet. 2006;38:904–909 [DOI] [PubMed] [Google Scholar]
- 16. Patterson N, Price AL, Reich D. Population structure and eigenanalysis. PLoS Genet. 2006;2:e190. [DOI] [PMC free article] [PubMed] [Google Scholar]
- 17. Endogenous Hormones Breast Cancer Collaborative Group Body mass index, serum sex hormones, and breast cancer risk in postmenopausal women. J Natl Cancer Inst. 2003;95:1218–1226 [DOI] [PubMed] [Google Scholar]
- 18. Wedderburn RWM. Quasi-likelihood functions, generalized linear models, and the Gauss-Newton method. Biometrika. 1974;61:439–447 [Google Scholar]
- 19. Agresti A. 2002. Categorical Data Analysis. Hoboken, NJ: John Wiley, Sons, Inc [Google Scholar]
- 20. Purcell S, Neale B, Todd-Brown K, et al. PLINK: A tool set for whole-genome association and population-based linkage analyses. Am J Hum Genet. 2007;81:559–575 [DOI] [PMC free article] [PubMed] [Google Scholar]
- 21. Browning BL, Browning SR. A unified approach to genotype imputation and haplotype-phase inference for large data sets of trios and unrelated individuals. Am J Hum Genet. 2009;84:210–223 [DOI] [PMC free article] [PubMed] [Google Scholar]
- 22. Durbin RM, Abecasis GR, Altshuler DL, et al. A map of human genome variation from population-scale sequencing. Nature. 2010;467:1061–1073 [DOI] [PMC free article] [PubMed] [Google Scholar]
- 23. Hui J, Gu YF, Wu XM, et al. Defibrillation efficacy of a newly developed automated external defibrillator in a swine ventricular tachycardia/fibrillation model. Zhonghua Xin Xue Guan Bing Za Zhi. 2009;37:845–848 [PubMed] [Google Scholar]
- 24. Hoppenbrouwers IA, Aulchenko YS, Janssens AC, et al. Replication of CD58 and CLEC16A as genome-wide significant risk genes for multiple sclerosis. J Hum Genet. 2009;54:676–680 [DOI] [PubMed] [Google Scholar]
- 25. Yang J, Weedon MN, Purcell S, et al. Genomic inflation factors under polygenic inheritance. Eur J Hum Genet. 2011;19:807–812 [DOI] [PMC free article] [PubMed] [Google Scholar]
- 26. Montserrat N, Gonzalez A, Mendez E, Piferrer F, Planas JV. Effects of follicle stimulating hormone on estradiol-17 β production and P-450 aromatase (CYP19) activity and mRNA expression in brown trout vitellogenic ovarian follicles in vitro. Gen Comp Endocrinol. 2004;137:123–131 [DOI] [PubMed] [Google Scholar]
- 27. Bulun SE, Sebastian S, Takayama K, Suzuki T, Sasano H, Shozu M. The human CYP19 (aromatase P450) gene: update on physiologic roles and genomic organization of promoters. J Steroid Biochem Mol Biol. 2003;86:219–224 [DOI] [PubMed] [Google Scholar]
- 28. Cheong YH, Moon BC, Kim JK, et al. BWMK1, a rice mitogen-activated protein kinase, locates in the nucleus and mediates pathogenesis-related gene expression by activation of a transcription factor. Plant Physiol. 2003;132:1961–1972 [DOI] [PMC free article] [PubMed] [Google Scholar]
- 29. Zhou DJ, Pompon D, Chen SA. Stable expression of human aromatase complementary DNA in mammalian cells: a useful system for aromatase inhibitor screening. Cancer Res. 1990;50:6949–6954 [PubMed] [Google Scholar]
- 30. Nakata T, Takashima S, Shiotsu Y, et al. Role of steroid sulfatase in local formation of estrogen in post-menopausal breast cancer patients. J Steroid Biochem Mol Biol. 2003;86:455–460 [DOI] [PubMed] [Google Scholar]
- 31. Kublickiene K, Fu XD, Svedas E, Landgren BM, Genazzani AR, Simoncini T. Effects in postmenopausal women of estradiol and medroxyprogesterone alone and combined on resistance artery function and endothelial morphology and movement. J Clin Endocrinol Metab. 2008;93:1874–1883 [DOI] [PubMed] [Google Scholar]
- 32. Toniolo PG, Levitz M, Zeleniuch-Jacquotte A, et al. A prospective study of endogenous estrogens and breast cancer in postmenopausal women. J Natl Cancer Inst. 1995;87:190–197 [DOI] [PubMed] [Google Scholar]