Abstract
The human ether-á-go-go–related gene (hERG) K+ channel encodes the pore-forming α subunit of the rapid delayed rectifier current, IKr, and has unique activation gating kinetics, in that the α subunit of the channel activates and deactivates very slowly, which focuses the role of IKr current to a critical period during action potential repolarization in the heart. Despite its physiological importance, fundamental mechanistic properties of hERG channel activation gating remain unclear, including how voltage-sensor movement rate limits pore opening. Here, we study this directly by recording voltage-sensor domain currents in mammalian cells for the first time and measuring the rates of voltage-sensor modification by [2-(trimethylammonium)ethyl] methanethiosulfonate chloride (MTSET). Gating currents recorded from hERG channels expressed in mammalian tsA201 cells using low resistance pipettes show two charge systems, defined as Q1 and Q2, with V1/2’s of −55.7 (equivalent charge, z = 1.60) and −54.2 mV (z = 1.30), respectively, with the Q2 charge system carrying approximately two thirds of the overall gating charge. The time constants for charge movement at 0 mV were 2.5 and 36.2 ms for Q1 and Q2, decreasing to 4.3 ms for Q2 at +60 mV, an order of magnitude faster than the time constants of ionic current appearance at these potentials. The voltage and time dependence of Q2 movement closely correlated with the rate of MTSET modification of I521C in the outermost region of the S4 segment, which had a V1/2 of −64 mV and time constants of 36 ± 8.5 ms and 11.6 ± 6.3 ms at 0 and +60 mV, respectively. Modeling of Q1 and Q2 charge systems showed that a minimal scheme of three transitions is sufficient to account for the experimental findings. These data point to activation steps further downstream of voltage-sensor movement that provide the major delays to pore opening in hERG channels.
INTRODUCTION
The human ether-á-go-go–related gene (hERG) K+ channel (KCNH2, or Kv11.1) is present in many excitable and nonexcitable cells, where it subserves a range of different functions (Warmke and Ganetzky, 1994). It encodes the pore-forming α subunit of the rapid delayed rectifier potassium channel, IKr (Sanguinetti et al., 1995; Trudeau et al., 1995), which is a major K+ current active in cardiac action potential repolarization and therefore in the termination of cardiac systole. This is highlighted in cases where suppression of hERG function, caused by inherited mutation or adverse drug effects, is linked to congenital or acquired long QT syndrome (Sanguinetti and Tristani-Firouzi, 2006), a prolongation of the QT interval of the electrocardiogram associated with ventricular arrhythmias.
Activation of hERG ionic current is very slow compared with most other channels that pass inward and outward currents in the heart, and usually requires hundreds of milliseconds to reach completion. Current activation can be fully revealed using an envelope of tails experiment and has time constants of >200 ms at 0 mV and ∼50 ms at +60 mV at room temperature in oocytes (Es-Salah-Lamoureux et al., 2010), one to two orders of magnitude slower than Kv1 channels. The slow activation is not usually visible at depolarized potentials, as extremely rapid inactivation supervenes early after channel activation and modifies the current time course. Thus, at first sight, slow activation may not seem of great physiological significance. However, although channel activation gating in hERG has been extensively investigated over the past 15 years—involving the study and mutation of multiple residues within the S1–S4 voltage-sensor domains of the channel—our understanding of the mechanisms underlying slow activation remains incomplete.
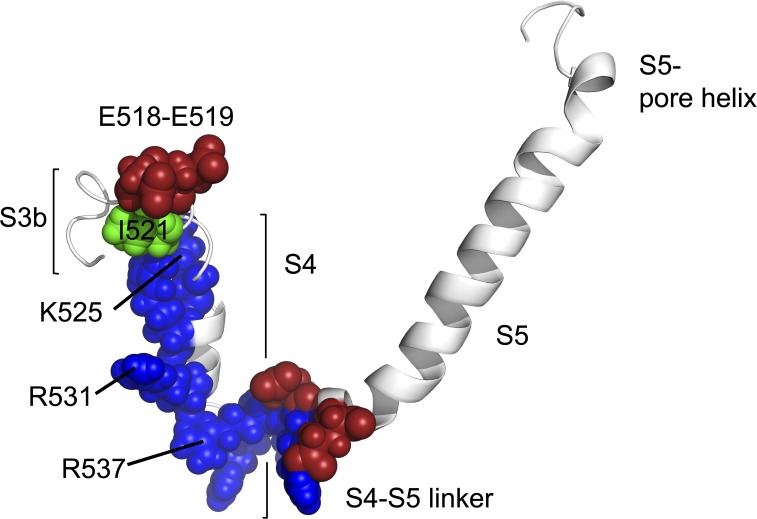
It is generally accepted that the structure and location of the charge-carrying residues in hERG channels are similar to those in Shaker and Kv1.2 channels (Fig. 1), although the primary sequence homology of hERG channels with Kv1.2 is considerably poorer than for Shaker channels. One notable difference is the extremely short putative S3–S4 linker in hERG channels, which likely consists of only three residues (Fig. 1, E518–L520; Lee et al., 2009). Cysteine substitution of the hERG S4 positive charges has shown that the outer three transfer most of the charge during activation (Zhang et al., 2004), and this is consistent with recent molecular dynamics simulation using a hERG structural model (Subbotina et al., 2010). It appears, from MTS data, that the extent of S4 translocation across the membrane is much the same in hERG and other Kv channels, so to understand the delayed activation of hERG channels we must examine the rate of S4 movement in response to changes in membrane potential, and the constraints on this movement.
Figure 1.
Homology model of hERG from S3b to the S5 pore helix, based on rKv1.2. The model illustrates one subunit between residues S510 and H577. Charged residues are shown in the hERG S3–S4 linker (E518 and E519), the S4 (K525, R528, R531, R534, R537, and K538), and the S4–S5 linker (D540, R541, and E544). Positively charged residues are shown in blue, and negatively charged residues are shown in red. I521, at the extracellular end of S4, is shown in green. Figure was generated using an energy-minimized model (Wynia-Smith et al., 2008) based on the crystal structure of rKv1.2 in the open state.
Channel activation gating has been directly examined by following the dynamic voltage-sensor movement in hERG channels in two ways: either by measuring gating currents using the cut-open oocyte technique (Piper et al., 2003, 2005; Ferrer et al., 2006), or by monitoring the environmental changes experienced by the amino acids in the S3–S4 linker using voltage-clamp fluorimetry (Smith and Yellen, 2002; Es-Salah-Lamoureux et al., 2010). Gating currents from WT hERG channels expressed in oocytes show fast and slow components that differ >100-fold in their kinetics. They show an initial rapid spike of gating current that has a very positive charge–voltage (Q-V) dependence with a V1/2 of +28 mV. It is followed by a slower component of hERG gating charge, Qon, which is thought more likely to underlie S4 voltage-sensor movement. This second component shows an activation time constant of ∼50 ms at +10 mV, which is somewhat faster than the time constant of ionic current activation and has a V1/2 that is ∼20 mV hyperpolarized compared with the G-V relationship in both WT and S631A inactivation-removed channels (Piper et al., 2003). The fast transient component of gating current is of unknown origin. Its rapid appearance suggests a temporal relationship to inactivation, but it is still present in inactivation-removed mutants. The slower component of gating current moves an order of magnitude more slowly than charge movement recorded in other Kv channels (Hesketh and Fedida, 1999; Bezanilla, 2000) and in EAG channels (Bannister et al., 2005), which is thought to make it rate limiting for pore opening and ionic current flow (Piper et al., 2003). It is one of the aims of the present study to build upon the existing oocyte studies by using a mammalian expression system to study hERG gating currents and to investigate the time course of charge movement versus pore opening.
Direct placement of fluorophores at the extracellular end of the S4 voltage sensor and in the S3–S4 linker is the second way to detect the movement kinetics of S4 during activation. Typically, fluorophores at this site in many channels detect S4 translocation as a rapid quenching of tetramethylrhodamine fluorescence, including our data from Shaker, Kv1.5, Kv1.4, and Kv1.2 (Claydon and Fedida, 2007; Claydon et al., 2007; Vaid et al., 2008). However, in hERG, fluorophores attached in the S3–S4 linker and at the outer end of S4 (E518, E519, and L520; Fig. 1) show complex emission profiles with fast and slow components that are more difficult to definitively correlate with expected charge movement (Smith and Yellen, 2002). The emission from L520C is unlike the gating current recordings in that the fluorescence emission shows a V1/2 that overlaps the half-activation voltage of the G-V (Smith and Yellen, 2002; Es-Salah-Lamoureux et al., 2010; Van Slyke et al., 2010). Our more recent experiments with E519C:C445V:C449V have revealed that after removal of the endogenous cysteines from the S1–S2 linker, separate components of the fluorescence signal give reports of hERG voltage-sensor operation and pore coupling to ionic current activation. These results were extended using fluorescence recordings from the L520C:C445V:C449V and the inactivation-removed S620T:E519C:C445V:C449V mutants to demonstrate that hERG channel activation gating is accompanied by a rapid displacement of S4, which is detectable at E519C as a rapid voltage-dependent fluorescence quenching that is hyperpolarized to the G-V relationship and much faster than pore opening.
The data from these two experimental methodologies present us with some issues. Why do the gating currents from oocytes suggest that the activation charge movement is slow, when the direct fluorescence measurements suggest that there is a rapid environmental change at the outer end of S4 induced during depolarizations? Also, what is the nature of the very rapid, transient charge movement seen in oocytes at very depolarized potentials with a V1/2 of +28 mV (Piper et al., 2003). Apart from the fundamental question of whether the S4 domains move quickly or slowly, it is also uncertain whether the voltage dependence of S4 movement as monitored by gating charge (the Q-V), or fluorescence (the F-V), is the same or hyperpolarized with respect to the G-V. We have attempted to answer some of these questions by making the first direct measurements of hERG gating current in mammalian cells, in which there are no other currents under the ionic conditions used, and where it is possible to ensure a fast voltage clamp. We have also used a third methodology to track the time course of voltage-sensor displacement, drawing on the experiments of Rocheleau and Kobertz (2008) in KCNQ1. We have discovered a hERG S4 cysteine mutant, I521C, which is modified by [2-(trimethylammonium)ethyl] MTS chloride (MTSET) only when hERG is depolarized and have used the modification rate of this mutant to track the equilibration rate of the voltage sensors. The location of I521 is shown in green in the model in Fig. 1.
In mammalian cells, we find two rapid components of gating charge movement with time constants of 2.5 and 36.2 ms at 0 mV, respectively. Both components have voltage dependencies of 45–50 mV hyperpolarized compared with the G-V, and this movement is much faster than the onset of ionic conductance activation. These charge movement data are supported by measurements of the equilibration rates of the S4 voltage-sensor MTSET modification, which has a time constant of 36 ms at 0 mV.
MATERIALS AND METHODS
For gating currents, expression of hERG channels was optimized by subcloning of hERG channel cDNA into a pGW1H expression vector and transfection into tsA201 cells. Cells were grown in MEM with 10% fetal bovine serum at 37°C in an air/5% CO2 incubator. Cells were plated at 20–30% confluence on sterile glass coverslips in 25-mm Petri dishes and incubated overnight. Standard methods were used to transfect and identify cells for recording, as well as for electrophysiology (Wang et al., 2007).
TsA201 electrophysiology
A “−P/6” protocol was used for the online subtraction of the leakage and capacitive currents. The potential used for delivery of leak subtraction pulses was −90 to −110 mV. Data were filtered using a four-pole Bessel filter with an fc of 10 kHz and sampled at 10–100 kHz. Membrane potentials have not been corrected for small junction potentials that arose between bath and pipette solutions. All charge measurements (Qon and Qoff) were obtained by integrating the on- and off-gating current over sufficient time to allow gating currents to return to the baseline. The time course of the decaying tail currents was fit with single- or double-exponential functions as necessary: a*exp(−t/τ1) + b*exp(−t/τ2) + c, where a and b are the initial current amplitudes, τ1,2 are the time constants, and c represents an offset.
For recordings of gating currents, unless otherwise stated, patch pipettes contained (mM): 140 N-methyl d-glucamine chloride (NMGCl), 1 MgCl2, 10 EGTA, and 10 HEPES, adjusted to pH 7.2 with HCl. The bath solution contained (mM): 140 TEACl, 10 HEPES, 10 dextrose, 1 MgCl2, 1 CaCl2, and 0.01 terfenadine, adjusted to pH 7.4 with HCl. In some preliminary experiments, NMG chloride was used instead of TEA chloride in the bath solution. For ionic current recordings, the bath solution contained (in mmol/L): 135 NaCl, 5 KCl, 1 MgCl2, 2.8 sodium acetate, 10 HEPES, and 1 CaCl2, adjusted to pH 7.4 using NaOH. The whole-cell pipette filling solution contained (in mmol/L): 130 KCl, 5 EGTA, 1 MgCl2, 10 HEPES, 4 Na2ATP, and 0.1 GTP, adjusted to pH 7.2 with KOH. Throughout the text, the subscripts i or o denote intracellular or extracellular ion concentrations, respectively. MTS compounds were purchased from Toronto Research Chemicals. MTSET was aliquoted from the powder and stored at −20°C. On the experimental day, MTSET was dissolved in bath solution and stored on liquid nitrogen before diluting to 1 mM just before application. All other chemicals were from Sigma-Aldrich.
Data analysis
G-V relationships were derived by plotting peak tail currents as a function of the preceding depolarizing pulse. Q-V curves were derived as stated in the figure legends. G-V and Q-V curves were fit with a single Boltzmann function:
or a sum of two Boltzmann functions:
where y is the charge or the conductance normalized with respect to the maximal charge or conductance, V1/2 is the half-activation potential, V is the test voltage, and k is the slope factor. A refers to the amplitude of the fit component, and 1 and 2 refer to the separate components of the fit. Unless otherwise indicated, data reported throughout the text and figures are presented as mean ± SEM.
Gating current simulations
Simulations were performed using the differential equation solving program Berkeley Madonna. The transitions between states i and j were governed by rate constants exponentially dependent on membrane voltage of the form: ki–j = ki–j(0mV)exp(zFV/RT), where ki–j is the rate constant for transitions between states i and j; ki–j(0mV) is the voltage-independent rate; z is the equivalent electronic charge for the transition; V is the voltage; and F, R, and T have their normal thermodynamic meanings. For simplicity, z was assumed to be equivalent in forward and backward transitions. Gating currents resulting from transitions between closed states Ci and Cj were calculated as Ii–j = zije0(Cikij−Cjkji), with total gating current Ig being represented by the sum of the contributions of all transitions between all states Ig = ∑ij(Ii–j).
Online supplemental material
Fig. S1 demonstrates the measurement of hERG gating currents from mammalian tsA201 cells, before and after leak and capacity correction. It is available at http://www.jgp.org/cgi/content/full/jgp.201210942/DC1.
RESULTS
Gating currents recorded from tsA201 cells expressing hERG channels
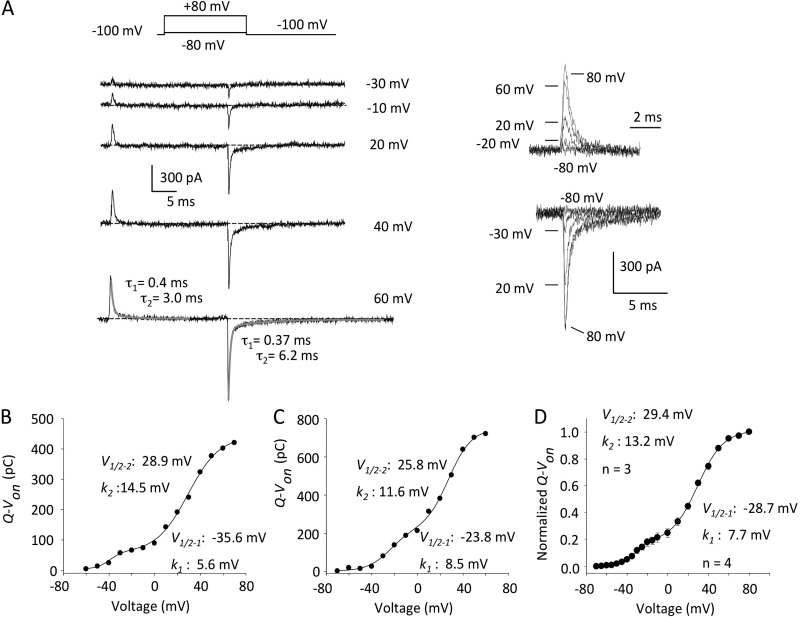
Gating currents are usually much smaller than ionic currents, and to visualize them clearly, without contamination by ions passing through the pore, permeant ions are usually omitted. Using whole-cell recording and symmetrical 140 mM NMG+ or NMG+/TEA+ as substitutes for K+ and Na+ in the solutions, ionic conditions often used in Kv channel gating current studies (Heinemann et al., 1992; Perozo et al., 1992; Chen et al., 1997; Wang et al., 1999; Melishchuk and Armstrong, 2001), 24-ms depolarizations failed to elicit any current in untransfected tsA201 cells, confirming the abolition of any cationic conductance through endogenous K+ channels (Fig. S1 A). When the same experiment was repeated with the tsA cells transiently expressing hERG channels (Fig. 2 A), outward transient current deflections were observed, as well as currents on repolarization. The on-gating currents originate from the displacement of the charged residues in voltage-sensing domains, mostly in S4 segments (Papazian et al., 1991; Perozo et al., 1994). When the membrane was repolarized to −100 mV from positive potentials, robust off-gating currents were seen that appear biphasic during decay. At +40 and +60 mV, two components of both on- and off-gating currents can clearly be seen in the records in Fig. 2 A and are fit with two time constants of current relaxation to the baseline at +60 mV (gray lines), and upon repolarization to −100 mV. The inset families of on- and off-gating currents also clearly illustrate two prominent phases of current decay to the zero current line.
Figure 2.
hERG gating currents and voltage dependence of Q-Von. (A; left) Representative gating currents evoked by 24-ms depolarizing pulses (pulse protocol is shown). At +60 mV, both Igon and Igoff decays were fit with a double exponential (fits are shown in gray). (Right) Expanded Igon and Igoff. For Igoff, gating current was recorded at −100 mV after depolarization to −80, −30, +20, and +80 mV. Same current scale was used for Igon and Igoff. (B and C) Gating current traces were integrated and charge was plotted as a function of voltage. The Q-Von plots were best fit with a double Boltzmann function. (B) On-gating current: V1/2–1 = −35.6 mV, k1 = 5.6 mV, V1/2–2 = 28.9 mV, k2 = 14.5 mV, and r2 = 0.99. (C) Off-gating current: V1/2–1 = −23.8 mV, k1 = 8.5 mV, V1/2–2 = 25.8 mV, k2 = 11.6 mV, and r2 = 0.99. (D) Mean data for the two components of Q-Von: V1/2–1 = −28.7 ± 2.3 mV, k1 = 7.7 ± 1.0 mV, V1/2–2 = 29.4 ± 2.0 mV, and k2 = 13.2 ± 1.7 mV; n = 3 or 4 at each potential. Between −80 and 0 mV, data were collected in 5-mV steps.
Because these currents were obtained during or after depolarizing steps from the holding potential to move the gating charge, integrating these data allows us to plot Q-Von relationships for gating currents obtained during the depolarizations (Fig. 2 B) or off-gating currents upon repolarization (Fig. 2 C), which are both fit with double Boltzmann functions. Mean Q-Von data from off-gating currents are shown in Fig. 2 D. The data suggest a first Boltzmann component (V1/2 of approximately −30 mV) that correlates closely with charge moving quite rapidly at more negative potentials, up to ∼0 mV. This appears to be complete within a few milliseconds even for small depolarizations. It is followed by a second, slower component of gating charge movement (V1/2 of approximately +25–30 mV) that cannot be seen during or after small depolarizations of this duration, but only with large depolarizations, and so corresponds to charge moved at more positive potentials over the 24-ms step. The double Boltzmann fit to the charge return from hERG channels is reminiscent of the Q1 and Q2 charge systems reported from both Shaker and Kv1.5 channels (Bezanilla et al., 1994; Hesketh and Fedida, 1999), and provides a framework for further experiments to separate the two charge systems.
Time course of charge movement at 0 and +60 mV, measured from charge return upon repolarization
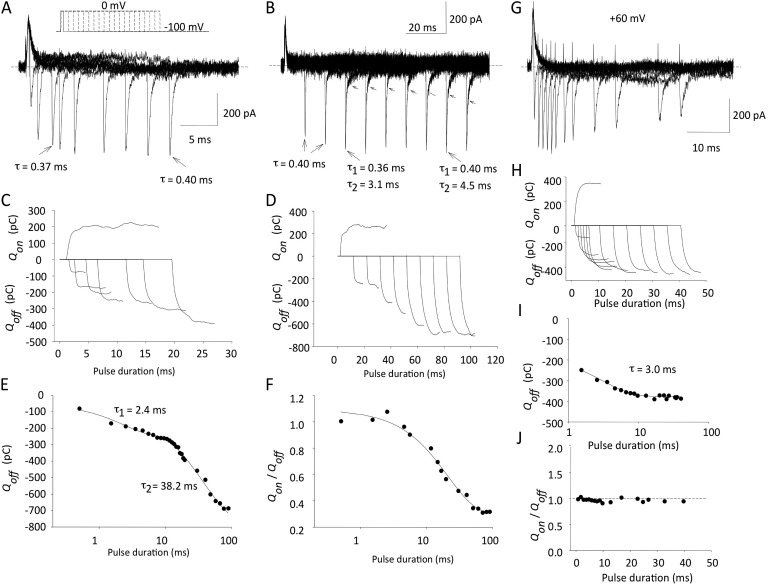
Envelopes of tail currents are a much more sensitive way to measure charge that moves slowly on depolarization. This charge may not be detected during long depolarizing clamp pulses, but it returns more rapidly upon repolarization as channel voltage sensors return, and can be measured at that time. From our earlier experiments we noted that 24-ms pulses to 0 mV do not generally show currents with a slow component of charge movement, whereas depolarizations to +60 mV usually do. We therefore chose these two potentials to study charge components. The experiment was divided into two halves, as exemplified by the original data in Fig. 3 (A and B). After an initial 0.5-ms duration depolarizing pulse to 0 mV, pulse duration was increased in 1-ms increments for the first 10 ms (Fig. 3 A) and then in 10-ms increments for the ensuing 100 ms (Fig. 3 B). The off-gating currents were fit with single-exponential decays of ∼0.4-ms time constants for pulses up to ∼20-ms duration, and for longer durations, two exponentials were required to fit the current decays as shown.
Figure 3.
Repolarization envelopes separate two components of charge moved at 0 mV, but not at +60 mV. (A and B) Illustrative currents obtained using an envelope of tails protocol. Membrane potential was stepped to 0 mV from −100 mV for varying durations of time (A, 1-ms intervals; B, 10-ms intervals) and repolarized back to −100 mV. Note that for shorter pulses, Igoff decay was best fitted with a single exponential, whereas longer pulses led to the appearance of a second, slower component (highlighted with arrows; time constants obtained using single or double exponentials are shown). (C and D) Qon and Qoff for pulses to 0 mV from integration of current tracings in A and B. Note Qoff increase after depolarizing pulses longer than ∼20 ms. (E) Time constants for saturation of fast and slow phases of Qoff after pulses to 0 mV. (F) Change in Qon/Qoff ratio for pulses to 0 mV of increasing duration. (G–J) Same experiments as in A–F, but depolarizing pulses were to +60 mV.
The Qon at 0 mV and Qoff returned for these two protocols are shown below (Fig. 3, C and D). They were obtained by integration of the current measurements and show several interesting features. For short depolarizations of 15 ms or less, the charge returning matches the charge moved, Qon/Qoff of ∼1.0 (Fig. 3, C and F), and has a time constant of ∼2.4 ms (Fig. 3 E). With longer depolarizations to 0 mV, out to 100 ms where charge return saturates, a larger second component of charge return is seen, which was not measurable from the on-gating current or observed during the shorter 24-ms depolarizations used in Fig. 2. This comprises ∼70% of the total charge return (Fig. 3, D and F) and has a time constant of 38 ms at 0 mV in this cell (Fig. 3 E). The mean fast and slow time constants were 2.5 ± 1.7 ms and 36.2 ± 8.1 ms, respectively (n = 3).
When the step potential was increased to +60 mV, the two components of charge movement merged and could not be so easily separated upon repolarization (Fig. 3, G–J). The off-gating currents slowed after longer depolarizations, and the peak amplitude was reduced as also seen in the gating currents from other mammalian Kv channels (Fig. 3 G). The charge moved was conserved upon repolarization with no increase of Qoff/Qon (Fig. 3, H and J), and the overall charge movement had a time constant of 3.0 ms in this cell (Fig. 3 I). The mean time constant was 4.3 ± 0.6 ms (n = 4 cells).
Time course of on-gating charge movement in hERG channels
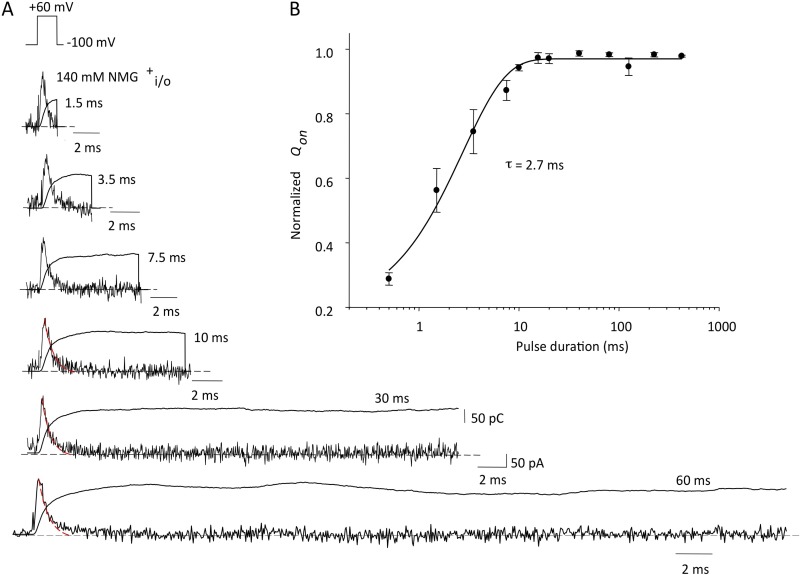
We performed further experiments to investigate the extent and time course of on-gating charge movement using variable duration depolarizations of up to 500 ms (Fig. 4). At +60 mV, very short depolarizations elicited transient currents like those described in Fig. 3. After longer pulses, currents decayed back to the baseline in two phases, the second of which is clearly seen in depolarizations of 10 ms and longer. Essentially, almost all of the measurable on-gating charge moved during 15-ms depolarizations to +60 mV, with a time constant of 2.7 ms (Fig. 4 B), as predicted from data shown in Fig. 3 I, with no evidence for more than two phases of charge movement. Unfortunately, this kind of simple protocol does not allow us to resolve slowly moving components of gating charge at more negative pulse potentials, like 0 mV. Although we know that they are there, from the off-gating currents (Fig. 3), it is difficult to detect such components within the baseline noise of on-gating current.
Figure 4.
Time courses of on-gating current and charge for depolarizations of increasing duration. (A) Original data illustrating Igon (noisy traces) and the integrals, Q, for depolarizations to +60 mV from −100 mV. Pulses were from 0.5- to 500-ms duration (1.5–60 ms illustrated); all tracings are on the same time base. Current and charge scaling bars apply to all records. Igon decays for 10-, 30-, and 60-ms pulses were overlain with a single-exponential decay function (red dashed lines) to show second, slower component of current decay. (B) Normalized charge versus pulse duration. Data were fit with a single-exponential function: τ = 2.7 ± 0.3 ms; n = 4.
Separation of the two charge systems underlying hERG gating currents
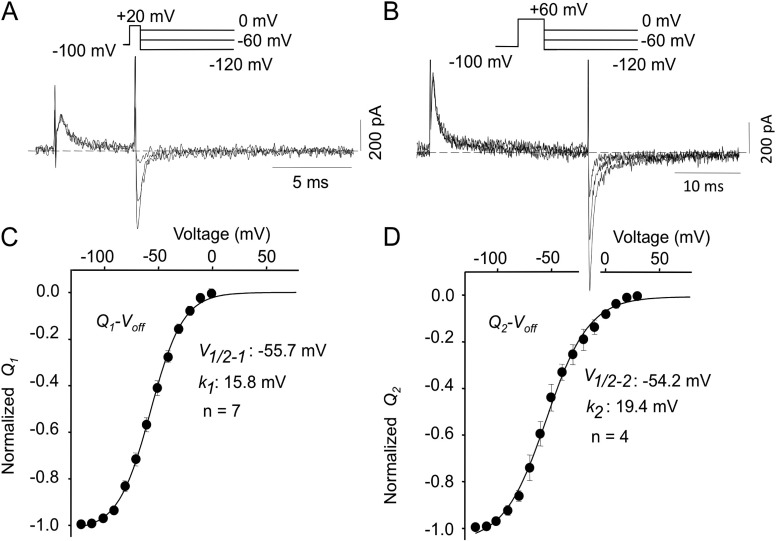
Data in Figs. 1–4 using Q-Von protocols have revealed a relatively rapidly moving charge system that appears at approximately −80 mV and saturates near 0 mV, and a second system with uncertain voltage dependence, as it moves too slowly at negative potentials to be accurately recorded, and is only clearly described at positive potentials. To overcome this problem, and separate the two charge components to get a clearer view of their voltage dependencies, we used Q-Voff protocols that involved first moving all the charge and then examining its voltage dependence on repolarization. For the rapid charge system (Q1), brief 5-ms pulses to +20 mV were used, followed by repolarizations to between 0 and −120 mV, as illustrated by the protocol and original data shown in Fig. 5 A. We know that the initial rapid charge movement (Q1) saturates at 0 mV, whereas Q2 moves with a mean time constant of 18.9 ± 2.5 ms (n = 2 ± SD) at +20 mV, and much slower at more negative potentials (Fig. 3). The Q1-Voff obtained using this method had a mean V1/2 of −55.7 mV and a slope factor of 15.8 mV (Fig. 5 C). In the same cells, all of the gating charge (Q1 + Q2) was moved by pulsing to +60 mV for 24 ms before repolarizing to a range of potentials (Fig. 5 B), and the Q2-Voff was obtained by subtraction of the Q1 data from the total charge (Fig. 5 D). The Q2 charge component had a V1/2 of −54.2 mV and a similar Boltzmann slope to that of Q1.
Figure 5.
Isolation of Q1 and Q2 Q-V relations. (A) Cells were pulsed from −100 to +20 mV for 5 ms before repolarizing to a range of potentials between 0 and −120 mV. Q1 charge was obtained by integrating off-gating currents after the 5-ms prepulse. (B) Measurement of total gating charge movement. Cells were pulsed from −100 to +60 mV for 24 ms before repolarizing to a range of potentials between +30 and −120 mV. (C) Q1 component of Q-Voff: V1/2–1 = −55.7 ± 2.4 mV and k1 = 15.8 ± 0.7 mV; n = 7. (D) Q2 charge was obtained by subtracting Q1 from total off-gating charge after 24-ms pulses to +60 mV; V1/2–2 = −54.2 ± 3.8 mV and k2 = 19.4 ± 1.8 mV; n = 4.
Summary relationships comparing the hERG G-V to the Q-V relations
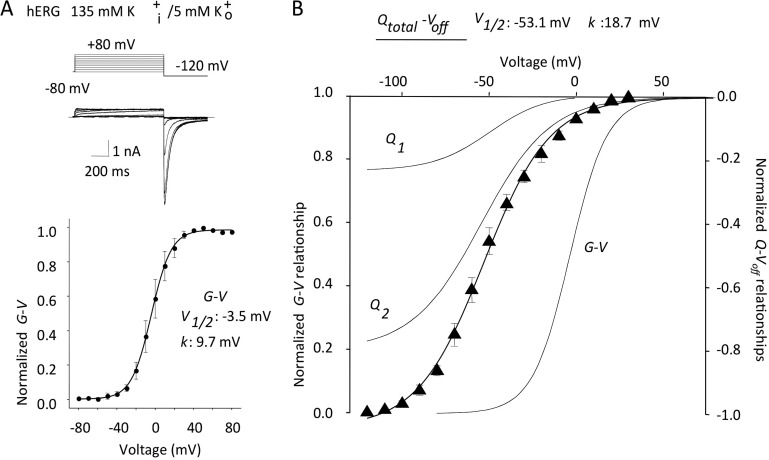
To summarize our findings for the two components of hERG gating current, we have plotted Q1 and Q2 Q-V relations with the ionic conductance (G-V) in Fig. 6. The hERG ionic G-V relation was measured from tail currents obtained after voltage pulses, as illustrated (Fig. 6 A). The Qtotal-Voff was obtained from the 24-ms repolarization protocol shown in Fig. 5 B. The Q1 and Q2 have been plotted normalized to the mean total Q-Voff and the G-V in Fig. 6 B. It can be seen that Q1 and Q2 comprise about one third and two thirds of the total charge, respectively, and are both negatively displaced with respect to the G-V by ∼50 mV.
Figure 6.
Relationship of the G-V relation to the components of charge movement. (A; top) Ion currents recorded from tsA201 cells in response to 1-s voltage steps from −80 mV to between −80 and +80 mV, repolarizing to −120 mV as indicated in the protocol. (Bottom) G-V relationship: mean G-V1/2 = −3.5 ± 6.9 mV and k = 9.7 ± 0.8 mV; n = 5. (B) Qtotal-Voff from the experiment shown in Fig. 5 B, fit with a single Boltzmann relation: V1/2 = −53.1 ± 2.6 mV and k = 18.7 ± 0.6 mV; n = 4. Q1, Q2, and G-V curves are shown in gray, superimposed for comparison.
So far, we have demonstrated two components of gating charge movement in hERG channels expressed in tsA201 mammalian cells. There is a rapid, smaller symmetrical component of charge that moves at negative potentials with a V1/2 of −55.7 mV and a time constant of 2.5 ms at 0 mV. This is followed by a greater, slower movement of charge that is hard to discern during depolarizations but which moves at a rate determined by potential with a V1/2 of −54.2 mV and a time constant of 36.2 ms at 0 mV and 4.3 ms at +60 mV.
MTSET accessibility of the voltage sensor
Our measurements suggest that in mammalian cells, the gating charge movement has both rapid and slower components, and the rate of the major component of charge movement, Q2, is very voltage dependent in the range of 0 to +60 mV. A second method to track voltage-sensor movement is residue exposure and ion current modification by MTS reagents. To directly test this in hERG, we identified S4 residues whose rate of modification increased upon depolarization in cysteine accessibility experiments, and then used the state dependence to examine the equilibrium time constants of S4 movement.
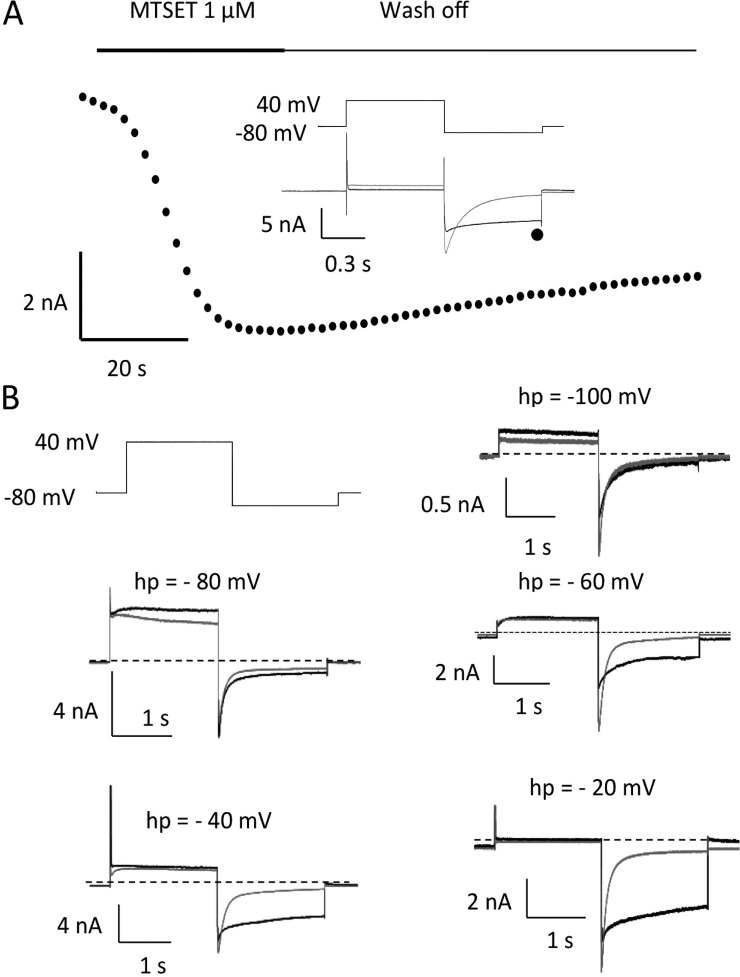
We mutated residues to cysteine in the extracellular part of the S4 helix and labeled them with MTSET to locate a residue that was protected from modification at rest, but that was modified upon depolarization. I521C, close to the top of S4 (Fig. 1), clearly exhibits state-dependent modification, as data shown in Fig. 7 illustrate. 500-ms pulses from −80 to +40 mV evoke hERG currents and large, rapidly deactivating tail currents on repolarization to −110 mV. Exposure to MTSET irreversibly slows deactivation of tail currents within a few seconds of exposure during constant pulsing (Fig. 7 A). Modification is voltage dependent, as shown in Fig. 7 B. Cells were held at the indicated potentials (Fig. 7 B, hp) and exposed to MTSET for 10 min before it was washed off. Subsequently, 2-s pulses to +40 mV to activate hERG and repolarization to −110 mV revealed which channels had been modified. There was little effect on currents from cells held at −100 and maximum slowing of deactivation occurring with holding potentials of −40 and −20 mV. The V1/2 for tail current modification in five cells was −64.4 ± 3.4 mV.
Figure 7.
MTSET modification of I521C is voltage dependent. (A) Currents measured from I521C over time during perfusion with 1 mM MTSET. Cell was held at −80 mV and pulsed to +40 mV for 500 ms every 10 s. Tail currents at −110 mV were measured at the point indicated by the symbol on the current trace, in control (gray) and during exposure to MTSET (black). Note increase in sustained inward currents at −110 mV and slowed tail decay in MTSET. (B) Cells were held at the indicated holding potential (hp) in each panel. They were exposed to MTSET for 10 min, which was then washed off. Cells were held at −80 mV and pulsed to +40 mV for 2 s, followed by a 2-s hyperpolarization to −110 mV to record currents before (gray) and after MTSET (black).
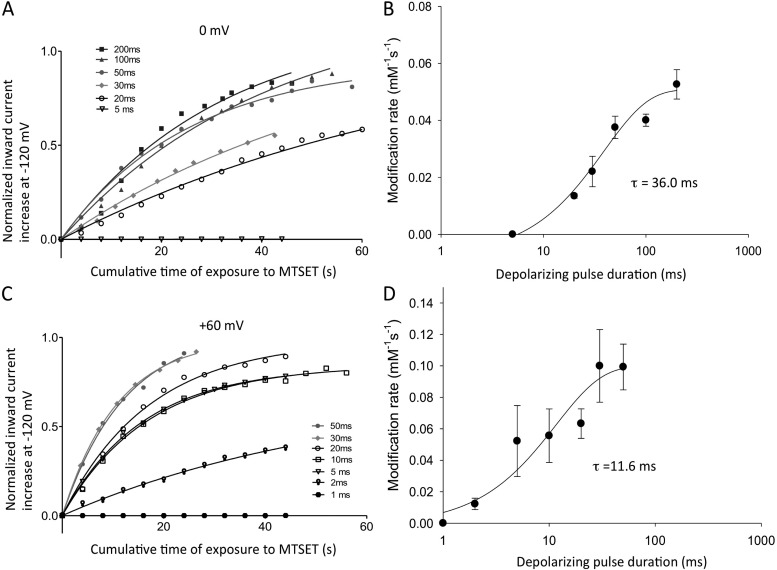
Modification of I521C requires a change in the position of the voltage sensor during activation that exposes the cysteine to extracellular MTSET. To track the time course of sensor movement from rest to equilibrium at 0 or +60 mV, we held cells at −120 mV to prevent modification at rest and gave depolarizing pulses of differing duration for 10% of the time (10% duty cycle) to 0 mV (Fig. 8 A) and +60 mV (Fig. 8 C). Cells were continuously exposed to MTSET to observe the time course of modification of tail currents. Tail current amplitudes were normalized to the maximum modification obtained and plotted in the graphs. At 0 mV, the maximum modification rate was observed for pulses of 50–200-ms duration, with intermediate modification rates seen for 30- and 20-ms pulses (Fig. 8 A). Little or no modification was seen with 5-ms pulses. This result suggests that the time taken for voltage-sensor movement limits the ability of MTSET to modify the S4 I521C residues at 0 mV for depolarizations that were shorter than 50 ms. At +60 mV (Fig. 8 B), exposures as short as 30 ms gave the maximum modification rate, which supports the idea of more rapid S4 movement at positive potentials. Single-exponential fits to the modification rates at 0 and +60 mV (Fig. 8, B and D) gave time constants for S4 equilibration of 36.0 ms (0 mV) and 11.6 ms (+60 mV).
Figure 8.
The time course of S4 equilibration measured from the MTSET modification of I521C inward currents. (A and C) The cells were held at −120 mV and, after a short control period, continuously exposed to 1 mM MTSET and depolarized to 0 mV (A) or +60 mV (C) for 10% of the cycle duration (i.e., 1 ms every 10 ms, 2 ms every 20 ms, etc., up to 400 ms every 4 s) until a stable current was obtained. Inward holding current levels at −120 mV were measured just before the start of each pulse, and pulsing continued until current levels no longer changed. Because the MTSET-induced increase of inward current was irreversible, only one pulse duration protocol could be applied in each cell studied. The MTSET current values were fit to a single exponential as described in Materials and methods to obtain modification rates for each pulse protocol duration. Averaged fits from three to four cells in each case are shown overlain on the mean current data for different pulse protocols, which have been normalized to the maximum change predicted from the fitting, and plotted against time of total exposure to MTSET in A and C. Note that for clarity, only selected points are plotted. (B and D) The modification rate constants from averaged fits in A and C are plotted against the depolarizing pulse duration. Single-exponential fits to the rates gave time constants of 36.0 ± 8.5 ms at 0 mV and 11.6 ± 6.3 ms at +60 mV for exposure duration.
DISCUSSION
Our studies use two different, but complementary, approaches to definitively measure the speed of voltage-sensor movement in hERG channels when they are expressed in mammalian cells. Overall, the MTSET experiments that directly track I521C exposure are in agreement with our gating charge measurements in supporting voltage-sensor movement in hERG that is largely complete with a time constant of ∼36 ms at 0 mV and 10 ms at +60 mV. Because we know that the activation time constant for hERG ionic currents at room temperature is 200 ms at 0 mV and 50 ms at +60 mV (Es-Salah-Lamoureux et al., 2010), our data here establish that the major components of voltage-sensor displacement takes ∼20% of the time required for ionic current activation over this potential range. The corollary of these findings is that the limiting events in hERG activation mainly lie after determinants of voltage-sensor movement that can be detected as gating currents or I521 displacement, and likely lie within the relationship of structures such as the S4 itself (Piper et al., 2005) or the S4–S5 linker to the S5 and pore domains (Ferrer et al., 2006; Batulan et al., 2010).
Two charge systems underlie hERG activation charge movement
In most channels, the Boltzmann analysis of Q-V relations has been limited to a single charge system, but in Shaker and Kv1.5 potassium channels, as well as in cardiac L-type Ca channels (Josephson, 1996), detailed analysis has been made of the dual charge systems underlying gating currents (Bezanilla et al., 1994; Hesketh and Fedida, 1999). Both K+ channels exhibit Q1 and Q2 charge systems that bear several similarities to those described here for hERG channels. The Q1 system is active at more negative potentials than Q2 and carries less charge, comprising approximately one third of the total. In the present experiments, we also found that the rapid early component of gating charge accounted for only ∼30% of the total charge movement in hERG channels (Figs. 3 and 6 B), and so we have called it Q1. When Q1 is maximally moved, the S4 helix is thought to exist in an intermediate state and only reaches its final destination on the movement of Q2. This is supported by fluorescence and mutational data from Shaker channels (Perozo et al., 1994), which have established the serial nature of Q1 and Q2 movement. Our experiments also suggest that Q2 charge movement determines the ultimate placement of S4, as its movement is reflected by much slower time constants compared with Q1 in the range of potentials where the hERG ion pore opens.
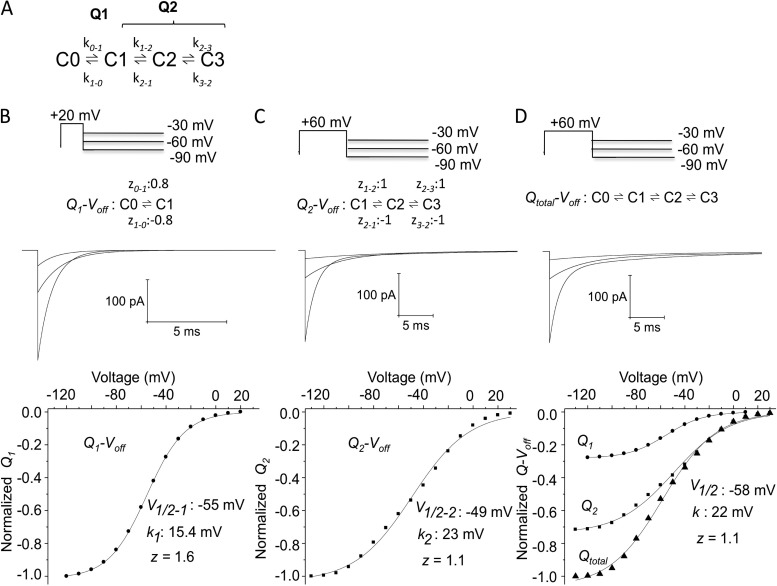
We developed a Markov model to gain insight into the minimum number of transitions required to account for the two charge systems we have described thus far (Fig. 9). Q1 data could be well described with a single charged step, but although the Q2 system showed almost the same apparent valence (Fig. 5) when the Q-Voff’s of Q1 and Q2 were normalized to the maximum charge moved, it was apparent that Q2 carried approximately two thirds of the total charge and Q1 only one third (Figs. 3 and 6 B) and therefore could not be described with a single transition of voltage dependence of 1.3 e0. Two equivalently voltage-dependent transitions constrained to carry approximately two thirds of the charge (zQ2, total = 4) have therefore been used to describe Q2 (Fig. 9 C), and this formulation for both Q1 and Q2 has permitted a reasonable simulation of both the off-gating current time course (Fig. 9 D) comprised of the individual Q1 and Q2 components as well as the individual and composite Q-V relationships.
Figure 9.
Separation of charge systems: Q1 and Q2 can be represented by a four-state model. (A) Four-state model used to simulate the two charge components observed in hERG gating currents recorded from mammalian cells. Q1 was modeled based on the isolated Q1-Voff relation (z = 1.60; Fig. 5 A). Gating currents corresponding to Q1 charge movements were well represented by a two-state, voltage-dependent transition with forward and backward transitions of equal voltage dependence (z = 0.8). The determination of Q2 charge movement was based upon the charge distribution left after subtraction of the charge movements from the Qtotal (Fig. 5 B). The total equivalent charge for Q2 movement determined from the Boltzmann fit was similar to that of Q1, with z = 1.3 (Fig. 5 D). Q2 was modeled as two transitions, each with a total equivalent charge movement of z = 2. (B) Q1 simulations. Voltage-independent rate constants were adjusted by fitting the simulated gating currents to the Q1-Voff and V1/2 in Fig. 5 and had values of k0–1(0 mV) = 1,915 s−1 and k1–0(0 mV) = 58 s−1. Clamp protocols are as in Fig. 5 for repolarization steps to −30, −60, and −90 mV. Simulated currents are shown below, and the Q1-Voff relations are shown at the bottom. (C) Q2 simulation had voltage-independent rate constants of k1–2(0 mV) = 195 s−1, k2–1(0 mV) = 1.8 s−1, k2–3(0 mV) = 88 s−1, and k3–2(0 mV) = 7.9 s−1. (D) Qtotal simulation with Q1 and Q2 components displayed as in Fig. 6 B.
The Q1 charge system
The initial charge system, Q1, moves extremely rapidly, with time constants of 2.4–2.7 ms at 0 mV (Figs. 3 and 4). The apparent gating charge valence associated with this displacement was 1.58 e0 (Figs. 5 and 9 B). The speed of this component of gating charge is reminiscent of the rapid component described in the cut-open oocyte (Piper et al., 2003), but the voltage dependence is completely different. Our modeling indicated that most of the voltage dependence of this charge system occurred between −100 and −40 mV. At large depolarizations where very rapid Q1 movement occurs, there is less obvious voltage dependence (Fig. 2). At very negative potentials such as −100 to −60 mV, currents were too small and probably moving too slowly to resolve experimentally during step depolarizations (Fig. 3). They could only be measured on repolarization when charge returned more quickly (Fig. 5 A). There was no obvious correlation of this Q1 charge to the MTSET exposure data at 0 mV (Fig. 8), which showed single-exponential modification rates that had a much slower time constant and correlated better with Q2 charge movement (see below).
What then is the nature of the voltage-sensor displacement that underlies rapid Q1 charge movement? Interestingly, we have previously reported an extremely rapid S4 voltage-sensor environmental change at E519C at the very tip of S4, recorded as fluorescence from tetramethylrhodamine attached to the introduced cysteine (Es-Salah-Lamoureux et al., 2010). The speed of the movement was at the upper limit of resolution of the oocyte clamp and was recorded as an almost instantaneous fluorescence quenching. The relative amplitude of this fluorescence environment change gave no information as to the magnitude of S4 displacement but had a V1/2 of −38 mV during depolarization, close to that of the Q1 charge system, but more importantly was significantly more negative than the V1/2 of the G-V in those experiments, just like the Q1 system described here. Thus, the Q1 system appears to underlie early steps in the activation pathway that do not greatly displace S4 in the outward direction because it does not result in measurable MTSET modification at residue 521. It does, however, cause a rapid change in the environment at E519, perhaps a rotation or tilt in S4 sufficient to move a third of the gating charge across the electric field. Interestingly, in Shaker channels, Q1 movement has been suggested to accompany conformational changes in acidic amino acids that interact with R368 in the closed channel (Perozo et al., 1994).
Time-dependent development of Q2
At 0 mV there was little difference between charge moved and returned for the first 20 ms, and then Qoff increased to become more than twice as large as Qon (Fig. 3, D and E), stabilizing in absolute and relative size after 100 ms. The Q2 charge system thus carries over two thirds of the total charge and has an apparent charge valence z of 1.3. The time of appearance for this slow component of on-gating current was voltage dependent, with a time constant of 36.2 ms at 0 mV and 4.3 ms at +60 mV. At +60 and +80 mV, the overlay data show the appearance of a slow component of off-gating current after short depolarizations indicated by the two time constants of decay (Fig. 2) and maintained charge ratios for depolarizations of increasing duration (Figs. 2 and 3 J).
The Q2 charge system has time constants of movement an order of magnitude slower than most mammalian gating currents at physiologically relevant potentials as originally shown by Piper et al. (2003) in oocytes. It is worth considering that rapid inactivation of hERG, compared with EAG, might result in the subsequent slow movement of a relatively immobilized second component of gating charge, as EAG channels lack inactivation and have rapid activation and on- and off-gating currents, like those we have described in many Kv channels (Wang et al., 1999, 2007) and others see in Shaker (Bezanilla et al., 1994). However, the Q2 charge system in hERG moves more quickly at potentials more positive than the physiological range (+20 to +80 mV) when inactivation should be more, rather than less, complete. As well, the D540C (Ferrer et al., 2006) hERG mutant that is in the S4–S5 linker inactivates normally but has fast gating currents like EAG, and hERG S631A (Piper et al., 2003), which is inactivation removed, still shows the major slow component of gating current. Thus, it seems unlikely that inactivation alone can explain the slow Q2 charge movement seen in our experiments and in the cut-open oocyte clamp (Piper et al., 2003).
Q2 movement could be delayed by electrostatic interactions between transmembrane segments, such as S2 and S4 (Subbiah et al., 2004; Zhang et al., 2005) inside the channel structure, as there are three negative charges in S2 of hERG and six overall in the voltage sensor, compared with only two in S2 and four overall in Shaker (not counting linker negative charges). It is also possible that the slow Q2 displacement might be dependent on turret conformational changes. Indeed, the S5-P linker in hERG is much longer than in other Kv channels (Fig. 1), and models suggest that this part of the channel is flexible and far from the pore (Yi et al., 2007).
In our experiments, the time constants of Q2 displacement at 0 and +60 mV correlated extremely well with the time constants of S4 equilibration measured from MTSET modification of I521C (Fig. 8). The latter data directly measure the rate of exposure of the top of the S4 domain to the extracellular medium and suggest that Q2 charge movement correlates closely with outward displacement and/or rotation of the S4 domain itself. The voltage dependence of MTSET modification of I521C (Fig. 8) also correlated closely with the voltage dependence of Q2 movement with a V1/2 of −64 mV, compared with −54 mV for Q2. We therefore conclude that it is Q2 charge that results from significant S4 domain displacement during channel activation, and this displacement is an obligatory step before channel opening. Although Q2 movement will significantly delay channel opening at physiological potentials because it has a time constant of 36 ms at 0 mV, there must be further rate-limiting steps downstream of S4 displacement to account for the ionic current activation time constant of 200 ms at 0 mV.
Supplementary Material
Acknowledgments
We wish to thank Jodene Eldstrom for excellent discussion and ideas for this project, and Hongjian Xu who helped with the MTS modification experiments shown in Fig. 8.
This work was supported by grant funding to D. Fedida from the Canadian Institutes of Health Research and Heart and Stroke Foundation of BC and Yukon. Y. Dou and S.J. Goodchild are supported by fellowships from the Heart and Stroke Foundation of Canada.
Kenton J. Swartz served as editor.
Footnotes
Abbreviations used in this paper:
- hERG
- human ether-á-go-go–related gene
- MTSET
- [2-(trimethylammonium)ethyl] MTS chloride
- Q-V
- charge–voltage
References
- Bannister J.P., Chanda B., Bezanilla F., Papazian D.M. 2005. Optical detection of rate-determining ion-modulated conformational changes of the ether-à-go-go K+ channel voltage sensor. Proc. Natl. Acad. Sci. USA. 102:18718–18723 10.1073/pnas.0505766102 [DOI] [PMC free article] [PubMed] [Google Scholar]
- Batulan Z., Haddad G.A., Blunck R. 2010. An intersubunit interaction between S4-S5 linker and S6 is responsible for the slow off-gating component in Shaker K+ channels. J. Biol. Chem. 285:14005–14019 10.1074/jbc.M109.097717 [DOI] [PMC free article] [PubMed] [Google Scholar]
- Bezanilla F. 2000. The voltage sensor in voltage-dependent ion channels. Physiol. Rev. 80:555–592 [DOI] [PubMed] [Google Scholar]
- Bezanilla F., Perozo E., Stefani E. 1994. Gating of Shaker K+ channels: II. The components of gating currents and a model of channel activation. Biophys. J. 66:1011–1021 10.1016/S0006-3495(94)80882-3 [DOI] [PMC free article] [PubMed] [Google Scholar]
- Chen F.S., Steele D., Fedida D. 1997. Allosteric effects of permeating cations on gating currents during K+ channel deactivation. J. Gen. Physiol. 110:87–100 10.1085/jgp.110.2.87 [DOI] [PMC free article] [PubMed] [Google Scholar]
- Claydon T.W., Fedida D. 2007. Voltage clamp fluorimetry studies of mammalian voltage-gated K(+) channel gating. Biochem. Soc. Trans. 35:1080–1082 10.1042/BST0351080 [DOI] [PubMed] [Google Scholar]
- Claydon T.W., Vaid M., Rezazadeh S., Kwan D.C., Kehl S.J., Fedida D. 2007. A direct demonstration of closed-state inactivation of K+ channels at low pH. J. Gen. Physiol. 129:437–455 10.1085/jgp.200709774 [DOI] [PMC free article] [PubMed] [Google Scholar]
- Es-Salah-Lamoureux Z., Fougere R., Xiong P.Y., Robertson G.A., Fedida D. 2010. Fluorescence-tracking of activation gating in human ERG channels reveals rapid S4 movement and slow pore opening. PLoS ONE. 5:e10876 10.1371/journal.pone.0010876 [DOI] [PMC free article] [PubMed] [Google Scholar]
- Ferrer T., Rupp J., Piper D.R., Tristani-Firouzi M. 2006. The S4-S5 linker directly couples voltage sensor movement to the activation gate in the human ether-a’-go-go-related gene (hERG) K+ channel. J. Biol. Chem. 281:12858–12864 10.1074/jbc.M513518200 [DOI] [PubMed] [Google Scholar]
- Heinemann S.H., Conti F., Stühmer W. 1992. Recording of gating currents from Xenopus oocytes and gating noise analysis. Methods Enzymol. 207:353–368 10.1016/0076-6879(92)07024-I [DOI] [PubMed] [Google Scholar]
- Hesketh J.C., Fedida D. 1999. Sequential gating in the human heart K+ channel Kv1.5 incorporates Q1 and Q2 charge components. Am. J. Physiol. 277:H1956–H1966 [DOI] [PubMed] [Google Scholar]
- Josephson I.R. 1996. Kinetic components of the gating currents of human cardiac L-type Ca2+ channels. Pflugers Arch. 433:321–329 10.1007/s004240050283 [DOI] [PubMed] [Google Scholar]
- Lee S.Y., Banerjee A., MacKinnon R. 2009. Two separate interfaces between the voltage sensor and pore are required for the function of voltage-dependent K(+) channels. PLoS Biol. 7:e47 10.1371/journal.pbio.1000047 [DOI] [PMC free article] [PubMed] [Google Scholar]
- Melishchuk A., Armstrong C.M. 2001. Mechanism underlying slow kinetics of the OFF gating current in Shaker potassium channel. Biophys. J. 80:2167–2175 10.1016/S0006-3495(01)76189-9 [DOI] [PMC free article] [PubMed] [Google Scholar]
- Papazian D.M., Timpe L.C., Jan Y.N., Jan L.Y. 1991. Alteration of voltage-dependence of Shaker potassium channel by mutations in the S4sequence. Nature. 349:305–310 10.1038/349305a0 [DOI] [PubMed] [Google Scholar]
- Perozo E., Papazian D.M., Stefani E., Bezanilla F. 1992. Gating currents in Shaker K+ channels. Implications for activation and inactivation models. Biophys. J. 62:160–168 10.1016/S0006-3495(92)81802-7 [DOI] [PMC free article] [PubMed] [Google Scholar]
- Perozo E., Santacruz-Toloza L., Stefani E., Bezanilla F., Papazian D.M. 1994. S4 mutations alter gating currents of Shaker K channels. Biophys. J. 66:345–354 10.1016/S0006-3495(94)80783-0 [DOI] [PMC free article] [PubMed] [Google Scholar]
- Piper D.R., Varghese A., Sanguinetti M.C., Tristani-Firouzi M. 2003. Gating currents associated with intramembrane charge displacement in HERG potassium channels. Proc. Natl. Acad. Sci. USA. 100:10534–10539 10.1073/pnas.1832721100 [DOI] [PMC free article] [PubMed] [Google Scholar]
- Piper D.R., Hinz W.A., Tallurri C.K., Sanguinetti M.C., Tristani-Firouzi M. 2005. Regional specificity of human ether-a’-go-go-related gene channel activation and inactivation gating. J. Biol. Chem. 280:7206–7217 10.1074/jbc.M411042200 [DOI] [PubMed] [Google Scholar]
- Rocheleau J.M., Kobertz W.R. 2008. KCNE peptides differently affect voltage sensor equilibrium and equilibration rates in KCNQ1 K+ channels. J. Gen. Physiol. 131:59–68 10.1085/jgp.200709816 [DOI] [PMC free article] [PubMed] [Google Scholar]
- Sanguinetti M.C., Tristani-Firouzi M. 2006. hERG potassium channels and cardiac arrhythmia. Nature. 440:463–469 10.1038/nature04710 [DOI] [PubMed] [Google Scholar]
- Sanguinetti M.C., Jiang C., Curran M.E., Keating M.T. 1995. A mechanistic link between an inherited and an acquired cardiac arrhythmia: HERG encodes the IKr potassium channel. Cell. 81:299–307 10.1016/0092-8674(95)90340-2 [DOI] [PubMed] [Google Scholar]
- Smith P.L., Yellen G. 2002. Fast and slow voltage sensor movements in HERG potassium channels. J. Gen. Physiol. 119:275–293 [DOI] [PMC free article] [PubMed] [Google Scholar]
- Subbiah R.N., Clarke C.E., Smith D.J., Zhao J., Campbell T.J., Vandenberg J.I. 2004. Molecular basis of slow activation of the human ether-a-go-go related gene potassium channel. J. Physiol. 558:417–431 10.1113/jphysiol.2004.062588 [DOI] [PMC free article] [PubMed] [Google Scholar]
- Subbotina J., Yarov-Yarovoy V., Lees-Miller J., Durdagi S., Guo J., Duff H.J., Noskov S.Y. 2010. Structural refinement of the hERG1 pore and voltage-sensing domains with ROSETTA-membrane and molecular dynamics simulations. Proteins. 78:2922–2934 10.1002/prot.22815 [DOI] [PMC free article] [PubMed] [Google Scholar]
- Trudeau M.C., Warmke J.W., Ganetzky B., Robertson G.A. 1995. HERG, a human inward rectifier in the voltage-gated potassium channel family. Science. 269:92–95 10.1126/science.7604285 [DOI] [PubMed] [Google Scholar]
- Vaid M., Claydon T.W., Rezazadeh S., Fedida D. 2008. Voltage clamp fluorimetry reveals a novel outer pore instability in a mammalian voltage-gated potassium channel. J. Gen. Physiol. 132:209–222 10.1085/jgp.200809978 [DOI] [PMC free article] [PubMed] [Google Scholar]
- Van Slyke A.C., Rezazadeh S., Snopkowski M., Shi P., Allard C.R., Claydon T.W. 2010. Mutations within the S4-S5 linker alter voltage sensor constraints in hERG K+ channels. Biophys. J. 99:2841–2852 10.1016/j.bpj.2010.08.030 [DOI] [PMC free article] [PubMed] [Google Scholar]
- Wang Z., Zhang X., Fedida D. 1999. Gating current studies reveal both intra- and extracellular cation modulation of K+ channel deactivation. J. Physiol. 515:331–339 10.1111/j.1469-7793.1999.331ac.x [DOI] [PMC free article] [PubMed] [Google Scholar]
- Wang Z., Robertson B., Fedida D. 2007. Gating currents from a Kv3 subfamily potassium channel: charge movement and modification by BDS-II toxin. J. Physiol. 584:755–767 10.1113/jphysiol.2007.140145 [DOI] [PMC free article] [PubMed] [Google Scholar]
- Warmke J.W., Ganetzky B. 1994. A family of potassium channel genes related to eag in Drosophila and mammals. Proc. Natl. Acad. Sci. USA. 91:3438–3442 10.1073/pnas.91.8.3438 [DOI] [PMC free article] [PubMed] [Google Scholar]
- Wynia-Smith S.L., Gillian-Daniel A.L., Satyshur K.A., Robertson G.A. 2008. hERG gating microdomains defined by S6 mutagenesis and molecular modeling. J. Gen. Physiol. 132:507–520 10.1085/jgp.200810083 [DOI] [PMC free article] [PubMed] [Google Scholar]
- Yi H., Cao Z., Yin S., Dai C., Wu Y., Li W. 2007. Interaction simulation of hERG K+ channel with its specific BeKm-1 peptide: insights into the selectivity of molecular recognition. J. Proteome Res. 6:611–620 10.1021/pr060368g [DOI] [PubMed] [Google Scholar]
- Zhang M., Liu J., Tseng G.N. 2004. Gating charges in the activation and inactivation processes of the HERG channel. J. Gen. Physiol. 124:703–718 10.1085/jgp.200409119 [DOI] [PMC free article] [PubMed] [Google Scholar]
- Zhang M., Liu J., Jiang M., Wu D.M., Sonawane K., Guy H.R., Tseng G.N. 2005. Interactions between charged residues in the transmembrane segments of the voltage-sensing domain in the hERG channel. J. Membr. Biol. 207:169–181 10.1007/s00232-005-0812-1 [DOI] [PubMed] [Google Scholar]
Associated Data
This section collects any data citations, data availability statements, or supplementary materials included in this article.


