

Abstract
Cold Syndrome and Hot Syndrome are thousand-year-old key therapeutic concepts in traditional Chinese medicine (TCM), which depict the loss of body homeostasis. However, the scientific basis of TCM Syndrome remains unclear due to limitations of current reductionist approaches. Here, we established a network balance model to evaluate the imbalanced network underlying TCM Syndrome and find potential biomarkers. By implementing this approach and investigating a group of chronic superficial gastritis (CSG) and chronic atrophic gastritis (CAG) patients, we found that with leptin as a biomarker, Cold Syndrome patients experience low levels of energy metabolism, while the CCL2/MCP1 biomarker indicated that immune regulation is intensified in Hot Syndrome patients. Such a metabolism-immune imbalanced network is consistent during the course from CSG to CAG. This work provides a new way to understand TCM Syndrome scientifically, which in turn benefits the personalized medicine in terms of the ancient medicine and complex biological systems.
Traditional Chinese medicine (TCM) is a medical system with over 3000 years of rich history. The main feature of TCM is Holism, with an emphasis on regulating the integrity of the human body as well as the interaction between human individuals and their environment. This attitude is essentially different from Reductionism. Various studies have shown that the scientific basis of TCM is not suitable for research within the reductionist framework1,2. The development of systems biology has helped people to realize the limitations of Reductionism, as methods are discovered as a result of exploring the complexity of biological systems3,4. Using systems biology as a new route, the study of TCM in a holistic way has become one of the popular research topics in modern science5,6.
Syndrome (“ZHENG” in Mandarin Chinese) is a key principle in TCM. Cold Syndrome and Hot Syndrome are two key conditions of the TCM Syndrome that highlight the balance-regulation thinking in TCM, and widely used in diagnosis of diseases including inflammation, infection, stress and autoimmune disorders. However, the biological basis, especially the methodology to uncover the biological basis for TCM Syndrome remains unclear. It is well known that network perspectives and network-based approaches are powerful and effective in systems biology and are widely used in disease gene prediction7, drug discovery8 and biomarker identification9,10,11. For example, hub genes9,10 or functionally related genes11 in a disease-specific network or in functional network modules are considered to be potential biomarkers. Our previous studies have shown the effectiveness and practicality of the network-based systems biology approach for revealing the biological basis of TCM Cold/Hot Syndrome12,13,14. The molecular networks specific to Cold Syndrome (Cold network) and Hot Syndrome (Hot network) were constructed and the metabolism-immune imbalance was found to be closely related to Cold/Hot Syndrome in the context of the neuro-endocrine-immune network12. Such a pattern of network imbalance was then verified in a typical Cold Syndrome pedigree consisting of 9 patients with Cold Syndrome and 5 controls13. Therefore, “network imbalance” potentially underlies the abnormalities associated with Cold Syndrome and Hot Syndrome; this conclusion is based on the assumption that TCM Syndrome is due to the complex interactions of molecules rather than changes in a single factor.
In the present work, we proposed that key nodes that are topologically important or functionally meaningful may cause the network imbalance, and these key proteins with changes in the network can be regarded as so-called biomarkers for network imbalance. These biomarkers are objective indicators of TCM Syndrome at the molecular level. We then established a network balance model that combines bioinformatics and clinical information to identify biomarkers of network imbalance that are associated with Cold Syndrome and Hot Syndrome. We further identified a series of abnormally expressed molecules using this model in a total of 81 patients with Cold Syndrome or Hot Syndrome in chronic gastritis including, respectively, chronic superficial gastritis (CSG) and chronic atrophic gastritis (CAG). The network balance model can transfer the syndrome differentiation of TCM from the macro level to the syndrome differentiation on a network basis from the micro level. In the model, the molecules in the Cold network and Hot network12 serve as “seeds” to lay the background for Cold Syndrome and Hot Syndrome. Transcriptional profiles of patients and network analyses were integrated to evaluate the network imbalance, and then, the key nodes in the generated networks were chosen as candidate biomarkers. Finally, those potential biomarkers were further detected in gastric serum samples and mucosa samples. We demonstrated the reliability and effectiveness of such a framework in discovering biomarkers for Cold/Hot Syndrome and revealed that the abnormal expression of leptin reflects the low level of energy metabolism in Cold Syndrome, while the abnormal expression of CCL2/MCP1 reflects the intensified level of immune regulation in Hot Syndrome. Moreover, this metabolism-immune imbalance that underlies Cold/Hot Syndrome is consistent during the course from CSG to CAG, indicating the potential of the network imbalance associated with Cold/Hot Syndrome as a new perspective in sub-typing gastritis and promoting the development of personalized medicine.
Results
Outline of the network balance model
As shown in Fig. 1, the network balance model mainly contains the following three steps to find biomarkers from imbalanced networks underlying a TCM Syndrome.
Figure 1. The network balance model and a toy example.
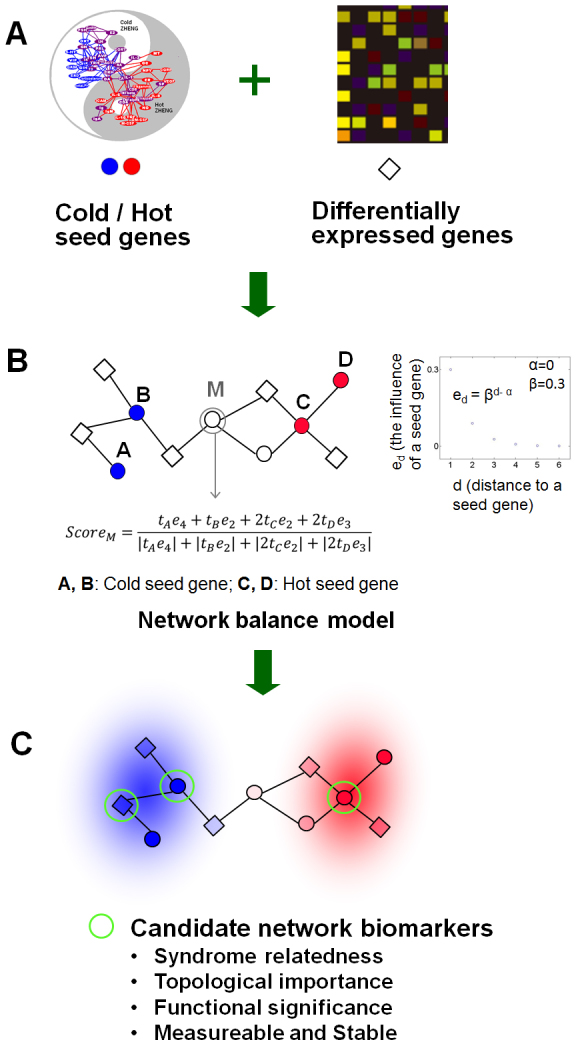
Firstly, information from two sources was integrated: (i) Seed genes related to Cold/Hot Syndrome. By using the typical Cold-Syndrome-related and Hot-Syndrome-related symptoms as key words to conduct manual curation and co-occurrence literature mining, we previously identified a group of genes and chemical messengers that closely associated with Cold Syndrome and Hot Syndrome respectively in the context of the neuro-endocrine-immune system. We further verified these obtained molecules in 38 Hot-Syndrome-related diseases and 21 Cold-Syndrome-related diseases by statistical pathway enrichment analysis12. The obtained genes together with genes that code for receptors and molecules mediating the function of the obtained chemical messengers constitute the “seed genes” of Cold/Hot Syndrome in this work (see Supplementary Table S1). (ii) Differentially expressed genes of Cold Syndrome and Hot Syndrome were resulted from transcription profiles under a particular disease condition such as gastritis in the present work. The seed genes and differentially expressed genes as well as their interactions formed the imbalanced network.
Secondly, we extended our topological temperature measurement12 to a network balance model for scoring the Cold or Hot status of each differentially expressed genes based on their connections with Cold or Hot seed genes in the protein-protein interaction network (see Methods). Differentially expressed genes with polarized scores as well as seed genes around most differentially expressed genes are both considered as candidate biomarkers.
Thirdly, functions of genes in the imbalanced network were annotated, and candidate biomarkers meeting the following criteria, namely Syndrome relatedness, topological importance, functional significance, measureable and stable, will be subjected to further clinical validation.
General information of patients
Outpatients complaining of upper gastrointestinal discomforts received an endoscopic examination in Beijing Dongzhimen TCM Hospital and Beijing Xiyuan TCM Hospital, and their histopathology was graded and classified as CSG or CAG according to “the updated Sydney System”15,16. Cold Syndrome and Hot Syndrome were diagnosed in patients by two TCM senior gastroenterologists. The clinical manifestations of these patients were also investigated according to the “National TCM Diagnosis Principle” issued by State Administration of Traditional Chinese Medicine, China, in 1994 (Table 1). Only patients diagnosed as typical Cold Syndrome or Hot Syndrome and experienced typical manifestations of the Syndromes were enrolled in this study. The normal controls consisted of volunteers without stomach discomfort complaints. This study protocol received approval from the Ethical Committee of Dongzhimen Hospital, Beijing University of TCM.
Table 1. General information of gastritis patients with Cold/Hot Syndrome and normal participants.
| Chronic superficial gastritis (CSG) | Chronic atrophic gastritis (CAG) | ||||
|---|---|---|---|---|---|
| Category | Normal | Cold Syndrome | Hot Syndrome | Cold Syndrome | Hot Syndrome |
| Cases (with Helicobacter Pylori infection) | 8 (3) | 20 (5) | 20 (4) | 17 (8) | 24 (11) |
| Male/Female | 3/5 | 5/15 | 10/10 | 8/9 | 11/13 |
| Age, Mean Years (SD) | 25.5 (3.2) | 38.2 (11.9) | 42.4 (12.6) | 46.7 (15.3) | 48.8 (10.9) |
| Typical Symptoms | N/A | 14 Pale complexion | 17 Halitosis | 6 Pale complexion | 18 Halitosis |
| 18 Preference for hot food and drink | 15 Dysphoria | 15 Preference for hot food and drink | 19 Dysphoria | ||
| 8 Loose stool | 15 Scorching stomach pain with preference for coolness | 9 Loose stool | 15 Scorching stomach pain with preference for coolness | ||
| 13 Cold limbs | 16 Yellow urine | 12 Cold limbs | 16 Yellow urine | ||
A total of 81 patients, 37 with Cold Syndrome and 44 with Hot Syndrome, were investigated in this study (Table 1). The main clinical features of patients with Cold Syndrome and Hot Syndrome are shown in Table 1. The distribution of Helicobacter Pylori (HP) infection (confirmed by a fast urea test and histology in the patients and by a urea breath test in the controls) showed no significant difference in patients with Cold Syndrome, Hot Syndrome and control participants. To evaluate the global network imbalance of patients, we conducted gene expression measurements in gastric tissue samples from 35 patients, including 17 samples with Cold Syndrome (8 for CSG and 9 for CAG) and 18 samples with Hot Syndrome (8 for CSG and 10 for CAG). To further select biomarkers, we collected serum from 24 patients with Cold Syndrome, 27 patients with Hot Syndrome, and 8 normal participants, and the serum biomarkers were determined by ELISA. Gastric tissue from 30 patients with Cold Syndrome and 37 patients with Hot Syndrome was also sampled and measured by immunohistochemistry (IHC).
Global network imbalance reflected by gene expression
Genes that were differentially expressed between Cold Syndrome and Hot Syndrome were screened using a two-sample t-test and controlling the local FDR < 0.05. Genes that were not part of the protein-protein interaction network were filtered out. As a result, 513 differentially expressed genes were found for CSG and 646 differentially expressed genes were found for CAG. As illustrated in Fig. 2, using principal component analysis (PCA) and hierarchical clustering methods for differentially expressed gene analyses, we found that the gene expression profiles of patients with Cold Syndrome were distinct from those with Hot Syndrome, suggesting that gene expression profiles involved in the network as a whole can differentiate the patterns of gastritis patients with Cold Syndrome and Hot Syndrome.
Figure 2. Classification of gastritic patients with Cold/Hot Syndrome by gene expression profile from microarray data.

(A) PCA plot for CSG. (B) PCA plot for CAG. Two-dimensional scatter plots for the classification of TCM Syndrome clusters based on the first 2 principal components were shown in (A) and (B). Each dot represents a patient with respect to the first 2 principal components. (C) Hierarchical clustering for CSG. (D) Hierarchical clustering for CAG. Hierarchical clustering of samples and differential expressed genes in the protein-protein interaction network was shown in (C) and (D).
Network imbalance in Cold/Hot Syndrome
By integrating network information and gene expression profile of patients, a network balance model (Fig. 1) was implemented to find the biomarkers of Cold/Hot Syndrome. Firstly, differentially expressed genes for CSG and CAG were measured using the network balance model (see Methods) respectively. Differentially expressed genes with top 10% of polarized scores and their interacting seed genes were mapped to the protein-protein interaction network. The resulting network, consisting of seed genes and differentially expressed neighbor genes, illustrated the A core molecular relationships reflecting the network imbalance (Fig. 3A).
Figure 3. Biomarker selection and validation from imbalanced network underlying Cold/Hot Syndrome.
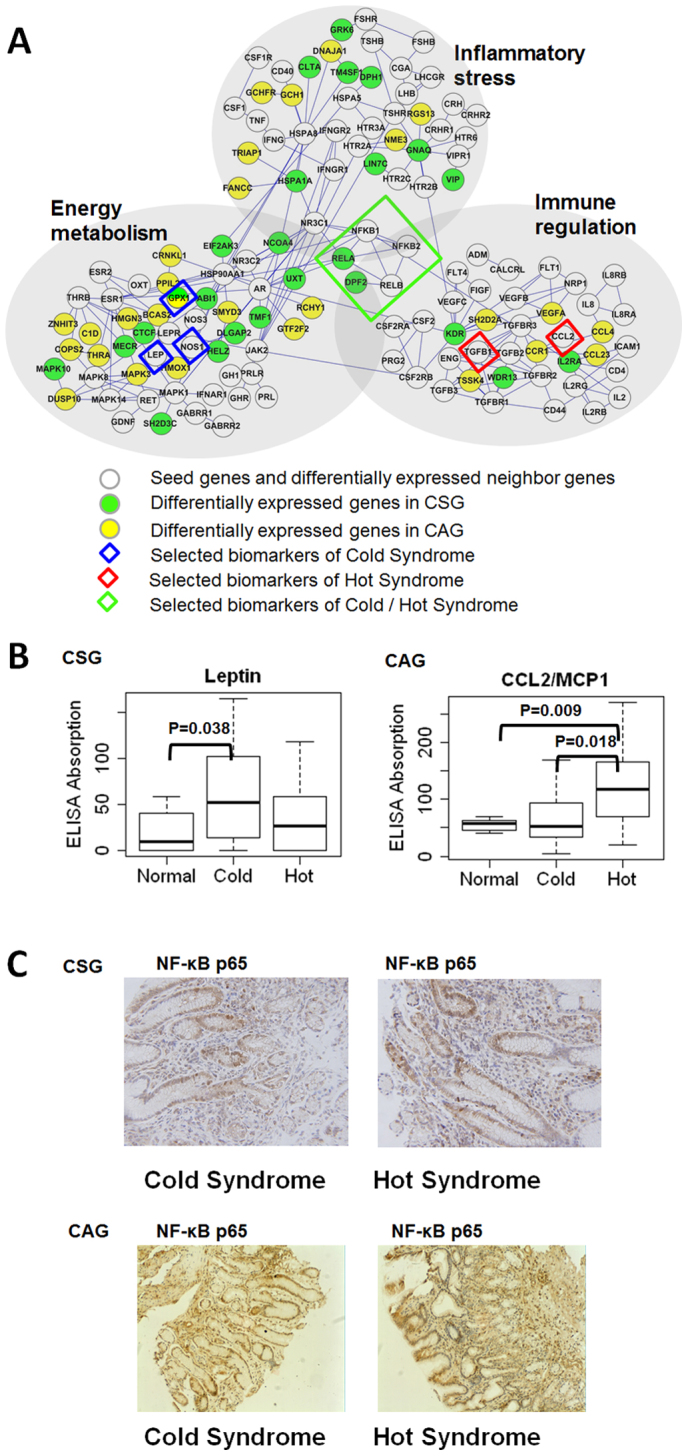
(A) Biomarker selection. Small isolated clusters are not shown in the figure. (B) Differential expressions of Biomarkers in serum. Leptin is a biomarker for Cold Syndrome. CCL2/MCP1 is a biomarker for Hot Syndrome. (C) Immunohistochemical staining of NF-κB p65 in gastric tissue samples from Cold Syndrome and Hot Syndrome patients.
Secondly, we annotated the related biological processes of all of the genes present in the network using Gene Ontology (GO), which provides detailed evidence of functional imbalance in Cold Syndrome or Hot Syndrome (Fig. 3A). Three functions containing enriched GO biological process terms were used to illustrate the function of the genes in the network (Table 2). Each of the three functional modules in the network was composed of core seed genes and differentially expressed neighbor genes. We noted two trends associated with the functional modules: 1) The larger the number of differentially expressed genes, the more likely a module was to be active and correlated with “imbalance”. 2) The function of each module was primarily determined by the core seed genes.
Table 2. Three functional modules containing enriched GO terms in the imbalanced network.
| Functional modules | GO terms | P value* |
|---|---|---|
| Inflammatory stress | inflammatory response | 6.27E-15 |
| Energy metabolism | response to oxygen levels | 0.0018 |
| response to hypoxia | 0.0010 | |
| positive regulation of nitrogen compound metabolic process | 9.57E-04 | |
| Immune regulation | immune response | 3.36E-11 |
*: Bonferroni-corrected Fisher Exact test P values.
Thirdly, we set the following criteria to further refine candidate biomarkers from the imbalanced network (Fig. 1C). 1) Syndrome relatedness: Seed genes differentially expressed or surrounded by many differentially expressed genes, or differentially expressed genes with polarized scores. 2) Topological importance: Genes are topologically significant in the network, such as highly connected genes or hub genes. 3) Functional significance: Potential biomarkers should have clear biological function meanings. 4) Measureable and Stable: Potential biomarkers should be secreted into blood or body fluid and their post-transcriptional regulations are relatively constant to avoid discrepancies between gene expression and protein expression.
Biomarker discovery for TCM Syndrome
Core genes were selected as candidate biomarkers for TCM Syndrome according to the above criteria. Here we only tested the candidates that more differentially expressed genes interacting with them in the imbalanced network (Fig. 3A). The levels of biomarkers in patients with Cold Syndrome and Hot Syndrome were further determined by serum ELISA and gastric tissue IHC measurements.
We found that CAG patients with Cold Syndrome had higher leptin receptor levels in their tissue compared to patients with Hot Syndrome (P = 0.046), indicating the reduced nutrition intake in Cold Syndrome. Meanwhile, CAG patients with Cold Syndrome had slightly higher NOS1 (P = 0.053) and GPX1 levels in their tissues (P = 0.05) compared to patients with Hot Syndrome, reflecting the reduced oxidative state in Cold Syndrome. The inhibition of nutrition intake and the decrease in the oxidative state both indicate that the energy metabolism level of the body is low in Cold Syndrome. The higher serum levels of CCL2/MCP1 in patients with Hot Syndrome compared to normal participants (Fig. 3B, P = 0.009) and patients with Cold Syndrome (Fig. 3B, P = 0.018) suggest that immune regulation is intensified in Hot Syndrome.
The metabolism-immune network imbalance also appears in CSG: patients with Cold Syndrome had higher serum leptin (Fig. 3B, P = 0.038) and slightly increased serum NOS1 (reflected by the nitrotyrosine levels, P = 0.061) levels compared to normal participants and higher tissue GPX1 levels (P = 0.047) compared to patients with Hot Syndrome, suggesting that the energy metabolism level of the body is low in Cold Syndrome. Meanwhile, serum TGFβ1 levels were significantly higher in patients with Hot Syndrome compared to normal participants (P = 0.0005), showing that immune regulation is intensified in Hot Syndrome. Moreover, we found that NF-κB was active in both groups of patients with Cold and Hot Syndromes (Fig. 3C) whereas genes such as RELA, TNIP2 and DPF2 that clustered around NF-κB in the network were differentially expressed in patients (Fig. 3A), indicating a double-faced role of the NF-κB system in the network imbalance associated with Cold/Hot Syndrome.
We also tested ADM as a negative control to further testify the performance of our method. ADM did not interact with differentially expressed genes and had a relatively low score (−0.33). The results showed that the ADM levels in tissues of CSG Cold Syndrome patients were not significantly different from that in tissues of CSG Hot Syndrome patients (P = 0.69), suggesting no biomarker potential of the negative control of ADM.
Discussion
Understanding the biological basis of traditional Chinese medicine, especially the core therapeutic concept of Syndrome, is a critical step in the modernization of TCM. In TCM, Cold Syndrome or Hot Syndrome is a reflection of the body's imbalance. On the basis of our previous established Cold network and Hot network, we believe that TCM Syndrome is caused by “network imbalance”12,13. Recently, some independent clinical studies on TCM Syndromes also support our Cold/Hot networks17,18,19: In two investigations on patients with rheumatoid arthritis, it is supported that immune regulation is closely related to Hot Syndrome and thus in agreement with our Hot network17,18. The investigation on patients with Primary Dysmenorrhea also validated the pattern of our Cold network19. In this study, we further proposed a network balance model (Fig. 1) to identify biomarkers for network imbalance in Cold Syndrome and Hot Syndrome. Without losing generality, the approach was successfully applied to reveal the biological basis of Cold Syndrome and Hot Syndrome in chronic gastritis. Moreover, we highlighted the metabolism-immune network imbalance of a series of biological functions that result in the deregulated escalation of gastric patients with Cold Syndrome and Hot Syndrome: the level of energy metabolism is low in patients with Cold Syndrome, while the level of immune regulation is intensified in patients with Hot Syndrome.
Several biomarkers for the metabolism-immune network imbalance embedded in Cold/Hot Syndrome are identified through the network balance model. As a biomarker of network imbalance in patients with Cold Syndrome, leptin with NOS1 and GPX1 is always associated with a decrease in energy metabolism (Fig. 4). For example, leptin can cause anorexia by inhibiting the nutritional intake of the gastrointestinal tract, leading to a decrease in the nutritional reserves and the energy supply20. Lundberg et al. suggest that NO plays a double role in the balance of oxidation-reduction21. Therefore, the question of whether NO represents oxidation should be decided by the neighboring molecules in the network. Thus, we measured the level of the reductase GPX1 in the gastric mucosa and found that it was more elevated in patients with Cold Syndrome than Hot Syndrome. The levels of NO and GPX1 jointly suggest a decrease in the oxidative state in Cold Syndrome. As a biomarker in patients with Hot Syndrome, CCL2/MCP1 with TGFβ1 indicates the intensified immune regulation in Hot Syndrome (Fig. 4).
Figure 4. The metabolism-immune imbalance is closely associated with Cold Syndrome and Hot Syndrome.
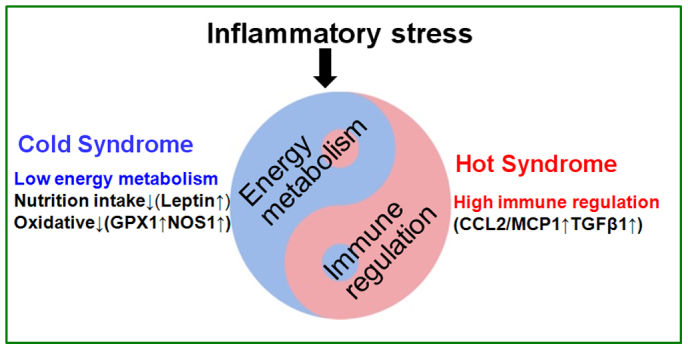
The corresponding molecules responsible for the biological processes are indicated in the figure.
CCL2/MCP1, an adipocytokine secreted by lipocytes that recruits monocytes, T cells, dendritic cells and other immune cells to sites of inflammation, is an important indicator of an enhanced immune response22,23,24. TGFβ1 suppresses the immune system by promoting the development of regulatory T cells. In gastric disease, it is hypothesized that TGFβ1 protects gastric mucosa tissues through immune regulation25.
Interestingly, in the metabolism-immune network of TCM Syndrome, NF-κB, a transcription factor, was found to be active in both Cold Syndrome and Hot Syndrome patients (Fig. 3C). Previous studies reported that the expression of NF-κB p65 was weak in normal gastric mucosa cells26,27. NF-κB is commonly associated with inflammation and cancer28,29,30. The trans-nuclear activity of NF-κB plays an essential role in pathways involved in inflammatory stress31,32, energy metabolism33, and immune regulation34,35,36,37. Leptin (a Cold Syndrome biomarker) can activate NF-κB38,39, and this activation induces an inflammatory response40. Because the CCL2/MCP1 promoter contains NF-κB binding sites, studies have shown that activation of NF-κB is involved in the enhanced expression of CCL2/MCP1 (a Hot Syndrome biomarker)39, which may constitute the mechanism behind the transfer from Cold Syndrome to Hot Syndrome. Furthermore, NF-κB is an active hub and seed gene in the imbalanced network. The evidence suggests that the higher transnuclear rate of NF-κB p65 in patients with Cold Syndrome or Hot Syndrome compared to normal participants is related to the imbalance of biological processes. Thus, the NF-κB system is considered as one of the bridges responsible for the transformation between Cold Syndrome and Hot Syndrome.
It was also found that the same function could be presented by identical or different molecules within the same network module, which means that characteristics of Cold Syndrome or Hot Syndrome are consistent in different disease stages. For example, the intensity of the immune regulation for CAG is reflected by a higher serum level of CCL2/MCP1 in patients with Hot Syndrome compared to normal participants (Fig. 3B, P = 0.009) and Cold Syndrome patients (Fig. 3B, P = 0.018), while the intensity of the immune regulation in CSG is reflected by the higher serum level of TGFβ1 in patients with Hot Syndrome of CSG compared to normal participants (P = 0.0005). It was reported that TGFβ1 contributed to the chemotactic activity, and then monocyte chemotactic activity in lymph was largely dependent on CCL2/MCP1 acting in concert with TGFβ141. Furthermore, TGFβ1 and CCL2/MCP1 have close interactions on the protein-protein interaction network. Thus, CCL2/MCP1 and TGFβ1 were jointly considered to play important roles in immune regulation. Leptin together with NOS1 and GPX1 reflects the decrease in energy metabolism in patients with Cold Syndrome, which is consistent with our findings that levels of energy metabolism are low in the patients with a typical Cold Syndrome pedigree13. The consistency of the metabolism-immune imbalance underlying Cold/Hot Syndrome in different disease stages or populations may be relevant to the hereditary stability13 and environmental factors14. Thus, we believe that the system-level properties of TCM Syndrome are rooted in the changes of multiple molecules in imbalanced network rather than single genes. In this work, we only validated two potential biomarkers, leptin and CCL2/MCP1, for Cold Syndrome and Hot Syndrome in gastritis patients respectively. Other candidates produced by the network imbalance model are still need to be further investigated.
The successful selection of biomarkers not only suggests that it is reasonable to decipher the biological basis of TCM Syndrome from the perspective of network imbalance but also demonstrates the effectiveness of the network balance model. This model combines microarray and network analysis to predict biomarkers of network imbalance. By analyzing gene expression data, we determined that the gene expression profiles of patients with Cold Syndrome were distinct from those with Hot Syndrome (Fig. 2), but the underlying mechanism of the biological processes and molecular networks cannot be identified. Identifying biomarkers for network imbalance requires systematic analysis. For example, CCL2/MCP1 is not itself differentially expressed but interacts with genes that are differentially expressed (Fig. 3) and thus cannot be found just by gene expression directly, suggesting that integrating network information can help to identify candidate biomarkers. For further improving the performance of the network balance model, we will take into consideration of more accurate network topological and quantitative measurements in the model. Additionally, this research mainly choose healthy youth human without Cold Syndrome or Hot Syndrome tendency as the normal control. On the choice of cases, the main concerns focus on the comparability between the two groups of Cold Syndrome and Hot Syndrome in the same pathological stage (such as CSG, CAG) and under no-significant-differences-HP-infection conditions. Such choice of cases was able to reflect the differences between Cold Syndrome and Hot Syndrome but may cause potential bias due to the unmatched age distribution between cases and the normal group. Whether the biomarkers of Cold/Hot Syndrome change with the conditions of age etc. will be concerned in our further study.
The network balance model combines information from different biological hierarchies, such as phenotypic, functional and molecular evidence, and integrates how information flows from the top down through biological networks. Information from different hierarchies enriches each other. For example, leptin induces anorexia, and changes in energy expenditure that affect body's thermoregulation may count for manifestations as fear of cold, fond of hot food, et.al. The activity of leptin (a Cold Syndrome biomarker) and CCL2/MCP1 (a Hot Syndrome biomarker) indicated that the biological basis for Cold Syndrome and Hot Syndrome in chronic gastritis could be divided into the low level of energy metabolism and the enhancement of immune regulation, respectively. This result suggests that leptin and CCL2/MCP1 may be potential biomarkers for sub-typing patients during the course of gastritis in terms of TCM Syndrome, which is potentially significant for an individualized regimen to halt the progress from gastritis to gastric cancer and deserves further investigation and validation in a large sample size of patients.
Network imbalance brings about a series of abnormities in biological processes and ultimately leads to the occurrence of Syndrome. We hypothesize that this aberrancy may evolve into cascades and subtypes of the disease. Above all, the present work that combines the traditional experiences of TCM and systems biology is of great importance in interpreting the biological basis for TCM Syndrome, and can open a new avenue for subtyping diseases that will benefit progress towards the coming personalized medicine.
Methods
Network balance model
In the model, the measurement of network imbalance is the core step to find biomarkers. We had constructed Cold and Hot molecular networks, and proposed a topological temperature measurement to give scores reflecting the Cold or Hot status of genes in the network12. Here, the genes in Cold and Hot molecular networks were as seed genes in this work. The network balance model gave score to measure the imbalance level for each differentially expressed gene based on its connections with Cold or Hot seed genes in the protein-protein interaction network.
The score as the output of the network balance model was calculated as follows:
Scorej denotes the score for the j-th gene based on the distances of all its shortest paths to each Cold/Hot seed gene. ti is the score of seed i with a value between −1 and 1 from our previous work12. dijv is the distance of the v-th shortest path between seed i and gene j. β is the attenuation factor, which has a value between 0 and 1 and controls the degree of decrease as the distance increases. α is the distance coefficient, which is a nonnegative integer that determines the maximum of shortest distance with which there is complete transmission capacity for gene j. When dijv < α, the value of dijv-α is set to 0. A negative score indicates that the gene is closer to the Cold seed genes, while a positive one indicates that the gene is closer to the Hot seed genes.
α and β are two parameters of the model. A coarse grid search is conducted to identify α and β (α = 0,1,…,9, β = 0.01,0.02,…,1). For each pair of α and β, we obtained the classification accuracy of the seed genes. If the sign of the score for a seed given by the model is consistent with its original sign, then the prediction for this seed is considered correct. The α and β pair (α = 0 and β = 0.01) with the highest accuracy was then used to calculate the score for each of the differentially expressed genes. The scores of differentially expressed genes and seed genes are provided in Supplementary Table S2.
Fig. 1B shows a toy example for the network balance model. The influence of a Cold/Hot seed gene denoted by ed becomes weaker as the distance d increases and is measured by an exponential function, as shown in the scatter plot in Fig. 1B. Take node M as an example, tA, tB, tC and tD denote the score of the seed genes A, B, C and D, respectively, and ScoreM denotes the score of gene M. M has one shortest path to node A with distance 4 and so the influence of A to M is measured with tAe4. There are two shortest paths between M and C with distance 2 and so the influence of C to M is measured with 2tCe2. ScoreM is ultimately the division of the sum of influence of each seed gene to M by the sum of the corresponding absolute values. Taken together, both (i) differentially expressed genes with polarized scores and (ii) seed genes surrounded by differentially expressed genes are more likely to become biomarkers and deserve further experimental validation.
Sample collection
Tissue and serum were collected from each patient for microarray measurements and biomarker further selection. For each enrolled patient, two gastric biopsy specimens were endoscopically collected from the antrum, one of which was immediately immersed in RNAlater (76106, QUIAGEN, Inc.) and stored at −80°C for the gene expression microarray assay and the other of which was embedded in paraffin for IHC staining. Serum was isolated from patients and controls and stored at −80°C for ELISA.
Measurement of tissue gene expression
Total RNA was extracted from gastric antrum specimens using Qiagen RNA extraction reagents (Qiagen) according to the manufacturer's instruction. The mRNAs from patients suffering from Cold Syndrome and Hot Syndrome were hybridized to the Affymetrix Human Genome U133 Plus 2.0 Array (U133Plus2.0, Affymetrix, Inc.). The protocols were performed according to the manufacturer's instruction. Using dChip42 software, raw CEL format files were converted into .DCP files which were then normalized, and raw probe signals were then generated. The probe signals were collapsed for gene expression signals using the median value if multiple probes mapped to the same gene. The processed microarray data was provided in Supplementary Table S3.
Biomarker measurement in serum and tissue
Serum ELISA
TGFβ1 ELISA kit (Bio-Technology Co., Ltd. XinBoSheng), nitrotyrosine (NO) ELISA kit (CELL BIOLAB), leptin ELISA kit (Bio-Technology Co., Ltd. XinBoSheng ), and human monocyte chemoattractant protein-1 (Monocyte Chemotactic Protein, CCL2/MCP1) ELISA kit (R & D ) were used to detect the corresponding protein levels in the serum. The ELISA experiments were performed according to the manufacturer's instructions.
Tissue Immunohistochemistry
IHC staining was performed on 5 μm sections of paraffin-embedded mucosal samples from the gastric antrum of patients with Cold Syndrome or Hot Syndrome. The heat-induced antigen retrieval of the deparaffinized sections was performed by autoclaving the slides in 1× citrate buffer for 15 min. The sections were incubated overnight with the appropriate primary antibody, that is, GPX1/2 antibody (sc-133160, Santa Cruz Biotechnology, Inc.), NF-κB RelA antibody (1546-1, Epitomics, Inc.), nNOS (NOS1) antibody (2081-1, Epitomics, Inc.), LEPR (pS473) antibody (2118-1, Epitomics, Inc.), or ADM antibody (sc-16496, Santa Cruz Biotechnology, Inc.), according to the protocol for each antibody. Then, the sections were quenched with the streptavidin-linked biotinylated secondary antibody and with a supersensitive horseradish peroxidase detection system (Universal LSAB Kit, CW0120, CWBIO, Inc. Beijing) using 3-Diaminobenzidine (CW0125, CWBIO, Inc. Beijing) as the chromogenic substrate. Positive controls were selected as suggested by the protocols for each primary antibody, while a negative control slide without primary antibody was performed in parallel with each batch of staining. The quantification of protein expression was performed by a certificated pathologist by calculating the percentage of the area that was positively stained based on 5 randomly selected images for each slide that were captured by an Olympus OPELCO microscope (model BX41). Both nuclear and cytoplasmic staining of NF-κB RelA was quantified. The transnuclear rate was used to measure the difference in the activity of NF-κB p65 between samples from patients with Cold Syndrome and Hot Syndrome. The transnuclear rate is the nuclear surface density divided by the total surface density. For the other proteins, the surface density was used to measure the difference.
Statistical analysis
Differentially expressed genes
Differentially expressed genes between Cold Syndrome and Hot Syndrome were analyzed by two sample t-test on gene expressions and controlling the local FDR level < 0.05. The local FDR was calculated using the R package "fdrtool"43.
Biomarker discovery in serum and tissue
For serum ELISA assays, one way ANOVA followed by the permutation resampling correction was used to compare serum protein levels in normal participants, patients with Cold Syndrome, and patients with Hot Syndrome. For tissue IHC, wilcoxon test was applied to compare protein levels in tissue between patients with Cold Syndrome and patients with Hot Syndrome.
Database and tools
The protein-protein interaction data used in the manuscript were derived from HPRD (release 7)44 curated binary interactions in the database file “BINARY_PROTEIN_PROTEIN_INTERACTIONS.txt”. The biological processes of genes in the imbalanced network were annotated in the Gene Ontology (GO)45. The Database for Annotation, Visualization and Integrated Discovery (DAVID)46 and Fisher exact test were used to obtain the enriched GO biological process terms.
Author Contributions
S.L. conceived and designed the study. R.L. and S.L. performed the computational works. T.M., X.L. and S.L. conducted the experiments. R.L., T.M., J.G. and S.L. wrote the manuscript. All authors approved the final version.
Supplementary Material
Dataset 1, 2 and 3
Acknowledgments
We thank Drs. Yongan Ye and Zhihong Li at Dongzhimen Hospital, Beijing University of Chinese Medicine and Dr. Zhenhua Li at Xiyuan hospital, China Academy of Traditional Chinese Medicine for their helps in patient sample collection. We thank volunteers for their contributions in normal sample collection. This work is supported by the NSFC grants 81225025, 91229201,60934004, 90709013 and 61005040.
References
- Jiang W. Y. Therapeutic wisdom in traditional Chinese medicine: a perspective from modern science. Trends Pharmacol Sci, 26, 558–563 (2005). [DOI] [PubMed] [Google Scholar]
- Feng Y. et al. Knowledge discovery in traditional Chinese medicine: state of the art and perspectives. Artif Intell Med, 38, 219–236 (2006). [DOI] [PubMed] [Google Scholar]
- Auffray C. et al. Systems medicine: the future of medical genomics and healthcare. Genome Med, 1, 2 (2009). [DOI] [PMC free article] [PubMed] [Google Scholar]
- Heng H. H. The conflict between complex systems and reductionism. JAMA, 300, 1580–1581 (2008). [DOI] [PubMed] [Google Scholar]
- Qiu J. Traditional medicine: a culture in the balance. Nature, 448, 126–128 (2007). [DOI] [PubMed] [Google Scholar]
- van der Greef, J. PERSPECTIVE All systems go. Nature, 480, S87–S87 (2011). [DOI] [PubMed] [Google Scholar]
- Wu X. et al. Network-based global inference of human disease genes. Mol Syst Biol, 4, 189 (2008). [DOI] [PMC free article] [PubMed] [Google Scholar]
- Zhao S. & Li S. Network-based relating pharmacological and genomic spaces for drug target identification. PLoS One, 5, e11764 (2010). [DOI] [PMC free article] [PubMed] [Google Scholar]
- Olivares M. et al. Present situation of biomarkers for copper status. Am J Clin Nutr, 88, 859S–862S (2008). [DOI] [PubMed] [Google Scholar]
- Dezso Z. et al. Identifying disease-specific genes based on their topological significance in protein networks. BMC Syst Biol, 3, 36 (2009). [DOI] [PMC free article] [PubMed] [Google Scholar]
- Yang R. et al. Core module biomarker identification with network exploration for breast cancer metastasis. BMC Bioinformatics, 13, 12 (2012). [DOI] [PMC free article] [PubMed] [Google Scholar]
- Li S. et al. Understanding ZHENG in traditional Chinese medicine in the context of neuro-endocrine-immune network. IET Syst Biol, 1, 51–60 (2007). [DOI] [PubMed] [Google Scholar]
- Ma T. et al. Bridging the gap between traditional Chinese medicine and systems biology: the connection of Cold Syndrome and NEI network. Mol Biosyst, 6, 613–619 (2010). [DOI] [PubMed] [Google Scholar]
- Jiang B. et al. Integrating next-generation sequencing and traditional tongue diagnosis to determine tongue coating microbiome. Sci Rep, 2, 936 (2012). [DOI] [PMC free article] [PubMed] [Google Scholar]
- Dixon M. F. et al. Classification and grading of gastritis - The updated Sydney System. Am J of Surg Pathol, 20, 1161–1181 (1996). [DOI] [PubMed] [Google Scholar]
- Stolte M. & Meining A. The updated Sydney system: classification and grading of gastritis as the basis of diagnosis and treatment. Can J Gastroenterol, 15, 591–598 (2001). [DOI] [PubMed] [Google Scholar]
- Chen G. et al. A network-based analysis of traditional Chinese medicine cold and hot patterns in rheumatoid arthritis. Complement Ther Med, 20, 23–30 (2012). [DOI] [PubMed] [Google Scholar]
- van Wietmarschen H. A. et al. Characterization of Rheumatoid Arthritis Subtypes Using Symptom Profiles, Clinical Chemistry and Metabolomics Measurements. PLoS One, 7, e44331. [DOI] [PMC free article] [PubMed] [Google Scholar]
- Su S. et al. A Metabolomic Study of Biochemical Changes in the Plasma and Urine of Primary Dysmenorrhea Patients Using UPLC - MS Coupled with Pattern Recognition Approach. J Proteome Res (2013). [DOI] [PubMed] [Google Scholar]
- Zigman J. M. & Elmquist J. K. Minireview: From anorexia to obesity--the yin and yang of body weight control. Endocrinology, 144, 3749–3756 (2003). [DOI] [PubMed] [Google Scholar]
- Lundberg J. O. et al. The nitrate-nitrite-nitric oxide pathway in physiology and therapeutics. Nat Rev Drug Discov, 7, 156–167 (2008). [DOI] [PubMed] [Google Scholar]
- Kyriakides T. R. et al. The CC chemokine ligand, CCL2/MCP1, participates in macrophage fusion and foreign body giant cell formation. American Journal of Pathology, 165, 2157–2166 (2004). [DOI] [PMC free article] [PubMed] [Google Scholar]
- Conductier G. et al. The role of monocyte chemoattractant protein MCP1/CCL2 in neuroinflammatory diseases. J Neuroimmunol. 224, 93–100 (2010). [DOI] [PubMed] [Google Scholar]
- Copaci I. et al. The role of cytokines in non-alcoholic steatohepatitis. A review. J Gastrointestin Liver Dis, 15, 363–373 (2006). [PubMed] [Google Scholar]
- Letterio J. J. & Roberts A. B. Regulation of immune responses by TGF-beta. Annu Rev Immunol, 16, 137–161 (1998). [DOI] [PubMed] [Google Scholar]
- Wang W. et al. Expression of NF-kappaB and human telomerase reverse transcriptase in gastric cancer and precancerous lesions. World J Gastroenterol, 10, 177–181 (2004). [DOI] [PMC free article] [PubMed] [Google Scholar]
- Soutto M. et al. Loss of TFF1 is associated with activation of NF-kappaB-mediated inflammation and gastric neoplasia in mice and humans. J Clin Invest, 121, 1753–1767 (2011). [DOI] [PMC free article] [PubMed] [Google Scholar]
- Razani B. & Cheng G. NF-kappaB: much learned, much to learn. Sci Signal, 3, pe29 (2010). [DOI] [PubMed] [Google Scholar]
- O'Neill L. A. & Kaltschmidt C. NF-kappa B: a crucial transcription factor for glial and neuronal cell function. Trends Neurosci, 20, 252–258 (1997). [DOI] [PubMed] [Google Scholar]
- Dolcet X. et al. NF-kB in development and progression of human cancer. Virchows Arch, 446, 475–482 (2005). [DOI] [PubMed] [Google Scholar]
- Tak P. P. & Firestein G. S. NF-kappaB: a key role in inflammatory diseases. J Clin Invest, 107, 7–11 (2001). [DOI] [PMC free article] [PubMed] [Google Scholar]
- Lawrence T. et al. Possible new role for NF-kappaB in the resolution of inflammation. Nat Med, 7, 1291–1297 (2001). [DOI] [PubMed] [Google Scholar]
- Rius J. et al. NF-kappaB links innate immunity to the hypoxic response through transcriptional regulation of HIF-1alpha. Nature, 453, 807–811 (2008). [DOI] [PMC free article] [PubMed] [Google Scholar]
- Dalton T. P. et al. Regulation of gene expression by reactive oxygen. Annu Rev Pharmacol Toxicol, 39, 67–101 (1999). [DOI] [PubMed] [Google Scholar]
- Karin M. & Greten F. R. NF-kappaB: linking inflammation and immunity to cancer development and progression. Nat Rev Immunol, 5, 749–759 (2005). [DOI] [PubMed] [Google Scholar]
- Hayden M. S. et al. NF-kappaB and the immune response. Oncogene, 25, 6758–6780 (2006). [DOI] [PubMed] [Google Scholar]
- Li Q. & Verma I. M. NF-kappaB regulation in the immune system. Nat Rev Immunol, 2, 725–734 (2002). [DOI] [PubMed] [Google Scholar]
- Rouet-Benzineb P. et al. Leptin counteracts sodium butyrate-induced apoptosis in human colon cancer HT-29 cells via NF-kappaB signaling. J Biol Chem, 279, 16495–16502 (2004). [DOI] [PubMed] [Google Scholar]
- Bouloumie A. et al. Leptin induces oxidative stress in human endothelial cells. FASEB J, 13, 1231–1238 (1999). [PubMed] [Google Scholar]
- Sitaraman S. et al. Colonic leptin: source of a novel proinflammatory cytokine involved in IBD. FASEB J, 18, 696–698 (2004). [DOI] [PubMed] [Google Scholar]
- Birdsall H. H. et al. Complement C5a, TGF-beta 1, and MCP-1, in sequence, induce migration of monocytes into ischemic canine myocardium within the first one to five hours after reperfusion. Circulation, 95, 684–692 (1997). [DOI] [PubMed] [Google Scholar]
- Li C. & Wong W. H. Model-based analysis of oligonucleotide arrays: expression index computation and outlier detection. Proc Natl Acad Sci U S A, 98, 31–36 (2001). [DOI] [PMC free article] [PubMed] [Google Scholar]
- Strimmer K. fdrtool: a versatile R package for estimating local and tail area-based false discovery rates. Bioinformatics, 24, 1461–1462 (2008). [DOI] [PubMed] [Google Scholar]
- Peri S. et al. Development of human protein reference database as an initial platform for approaching systems biology in humans. Genome Res, 13, 2363–2371 (2003). [DOI] [PMC free article] [PubMed] [Google Scholar]
- Ashburner M. et al. Gene ontology: tool for the unification of biology. The Gene Ontology Consortium. Nat Genet, 25, 25–29 (2000). [DOI] [PMC free article] [PubMed] [Google Scholar]
- Huang da W. et al. Bioinformatics enrichment tools: paths toward the comprehensive functional analysis of large gene lists. Nucleic Acids Res, 37, 1–13 (2009). [DOI] [PMC free article] [PubMed] [Google Scholar]
Associated Data
This section collects any data citations, data availability statements, or supplementary materials included in this article.
Supplementary Materials
Dataset 1, 2 and 3