

Abstract
The time course of muscular fatigue that develops during and after an intense bout of self-paced dynamic exercise was characterized by using different forms of electrical stimulation (ES) of the exercising muscles. Ten active subjects performed a time trial (TT) involving repetitive concentric extension/flexion of the right knee using a Biodex dynamometer. Neuromuscular function (NMF), including ES and a 5 s maximal isometric voluntary contraction (MVC), was assessed before the start of the TT and immediately (<5 s) after each 20% of the TT had been completed, as well as 1, 2, 4 and 8 min after TT termination. The TT time was 347 ± 98 s. MVCs were 52% of baseline values at TT termination. Torque responses from ES were reduced to 33–68% of baseline using different methods of stimulation, suggesting that the extent to which peripheral fatigue is documented during exercise depends upon NMF assessment methodology. The major changes in muscle function occurred within the first 40% of exercise. Significant recovery in skeletal muscle function occurs within the first 1–2 min after exercise, showing that previous studies may have underestimated the extent to which peripheral fatigue develops during exercise.
Key points
In this study we describe the time course of fatigue development during and after an intense bout of self-paced, high-intensity dynamic exercise using various electrical stimulation parameters to assess neuromuscular function (NMF) changes.
Most of the decrease in muscle function occurs within the first 40% of the exercise bout, and substantial recovery in muscle function occurs within 1–2 min after exercise termination.
Decreases in muscle function varied greatly with different methods of stimulation, suggesting that the extent to which muscle fatigue is documented during exercise depends upon NMF assessment methodology.
Measurements of muscle function must be performed as soon as possible after exercise termination, and previous studies may have underestimated the extent to which muscle fatigue develops during exercise.
Introduction
The process of muscle fatigue is generally considered to depend on at least two separate processes: those occurring in the muscle itself (build-up of end products of metabolism, alterations in excitation–contraction (EC) coupling, reduction in efficiency of neuromuscular transmission, etc.), often referred to as ‘peripheral fatigue’; and a reduction in initiation or transmission of electrical activity from the motor neurons that command the contracting muscle, the so-called ‘central fatigue’. The effect of these two processes is usually defined by changes in the maximal voluntary contraction (MVC; Bigland-Ritchie & Woods, 1984; Gandevia, 2001). The contribution of peripheral fatigue to the diminution of MVC is measured by the alteration in mechanical response of the muscle elicited by electrical or magnetic stimulation of the nerves of the muscles that were active during exercise. The development of peripheral fatigue during exercise is progressive (Gandevia, 2001), and depends on the duration and intensity of the exercise bout (Enoka & Stuart, 1992). The ideal method to quantify the extent of change in neuromuscular function (NMF) has yet to be determined (Cairns et al. 2005).
The most commonly employed methods to assess muscle function are the single electrical stimulus or high-frequency paired-pulse stimuli (Millet et al. 2002; Place et al. 2004; Amann et al. 2006; Ross et al. 2010). However, it is known that the measured muscle response varies significantly with the type of stimulus used, for example single versus paired stimulation versus tetanic stimulation (Martin et al. 2004; Place et al. 2004).
No study has yet systematically compared skeletal muscular responses with different stimulation methods after high-intensity exercise. In addition, as far as we know, no study has measured the response of the active muscles to electrical or magnetic stimulation delivered in short breaks during and immediately after intense self-paced exercise. Instead, in most studies the extent of change in NMF is usually measured in breaks of 3–10 min during (Place et al. 2004; Martin et al. 2010; Ross et al. 2010) or 2–4 min after termination (Amann & Dempsey, 2008) of dynamic exercise. Because muscle function can show substantial recovery within a few seconds of exercise cessation (Szubski et al. 2007; Allen & Westerblad, 2010; Cheng et al. 2010; Power et al. 2010), these studies may underestimate the extent to which NMF changes during exercise.
The present study was therefore designed to better understand the changes in NMF during and after high-intensity exercise. In this descriptive study, we address three questions. Firstly, what are the time course and the nature of the changes in NMF that develop during an intense bout of self-paced dynamic exercise? Secondly, what is the time course of changes in NMF after this exercise? Thirdly, do different stimulation methods identify different degrees of change in NMF during exercise and recovery?
To address these questions, we designed an experiment of vigorous leg extension exercise lasting 4–8 min. Exercise was performed on an isokinetic dynamometer that was used for both the concentric extension–flexion exercise bout and for the isometric measurement of NMF in response to electrical stimulation (ES). This allowed NMF to be assessed almost immediately (<5 s) after the exercise termination. By using multiple stimulation techniques to measure NMF and by comparing those results with actual changes in voluntary torque development, we aimed to determine fatigue mechanisms and their time course during and after intense self-paced (time trial (TT)) exercise.
Methods
Subjects
Ten physically active (training >4 times a week) subjects (two women and eight men) volunteered to participate in the study. Their average (±SD) age, body mass and height were 23.1 ± 6.0 years, 74.7 ± 9.0 kg and 180.2 ± 9.0 cm, respectively. The study was approved by the Research and Ethics Committee of the Faculty of Health Science of the University of Cape Town, and the experiments were performed according to the latest (2008) revision of the Declaration of Helsinki. The subjects gave their written informed consent to participate in the study, after which they completed a health screening questionnaire. Subjects were given a full explanation of the details and rationale of the study, and were informed that they were free to withdraw from the study at any time. The possibility that ES might cause discomfort was fully explained as were the nature of the risks involved.
Experimental design
Subjects made two preliminary visits to the laboratory during the last 3 weeks before the experiments commenced. During both visits, the subjects were familiarized by performing the TT with knee extension–flexion of the right leg and to assess NMF using a Biodex System 3 isokinetic dynamometer (Biodex Medical System, Shirley, NY, USA). Pilot and familiarization testing found that the expected TT time was 4–8 min. NMF was assessed before, during and after the TT.
Protocol
Subjects performed the TT on the isokinetic dynamometer by performing repetitive concentric extension–flexion movements of the right leg. Termination (100%) of the TT occurred when 30,000 J of work had been completed on the dynamometer (Fig. 1A). NMF evaluation (Fig. 1B) was performed before the start of the TT and immediately (mean for all subjects: 2.8 ± 0.7 s) after each 20% (6000 J) of the TT had been completed, as well as 1, 2, 4 and 8 min after termination of the TT. During rest after the TT, subjects continued to sit in the dynamometer and were inactive except when performing the NMF evaluations.
Figure 1. Overview of the stimulation timing and methods during the time trial (TT) (A) and the NMF evaluation (B).
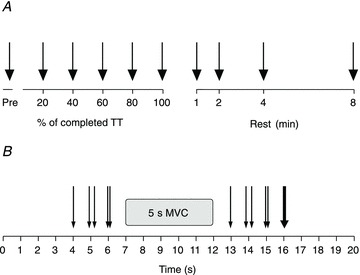
A, during the TT, black solid arrows indicate electrically evoked force measurements. B, each thin arrow indicates ES; SS; paired thin arrows indicate PS10 and PS100. A single solid arrow indicates TETANUS. Only torque responses evoked by ES after maximal voluntary contraction (MVC) were analysed in this paper.
On arrival at the laboratory, the electrodes for ES were taped on the skin. Subjects were secured to the dynamometer by chest and hip strapping to avoid excessive lateral and frontal displacements. The seating was adjusted for each subject, with the right knee femoral epicondyle aligned with the axis of the rotation arm of the dynamometer. The right lower leg was attached to the lever arm just above the lateral malleolus. The left leg was not active during the TT and was secured to the dynamometer by strapping around the upper leg. During both the TT and NMF evaluations, subjects kept their hands in the same position by holding the chest strapping of the dynamometer.
The subjects warmed up by performing 5 s isometric contractions of 2 × 50%, 2 × 70%, 2 × 90% and 1 × 100% of MVC. The rest period between each contraction was 30 s between the 50% and 70% efforts, and 60 s between the 90% and 100% efforts. Pre-TT NMF was assessed after the isometric warm up. Five maximal extension–flexion concentric isokinetic contractions were performed 3–4 min before the start of the TT. These maximal contractions were used to normalize the concentric torque during the TT.
ES
After detection of the femoral nerve with a ball probe cathode, ES was applied percutaneously via a 10 mm diameter self-adhesive cathode electrode (Kendall Meditrace, USA) pressed manually onto the femoral nerve. The anode, a 130 × 80 mm self-adhesive electrode (Cefar-Compex Scandinavia AB, Sweden), was applied to the gluteal fold.
A constant current stimulator (DS7AH; Digitimer, Hertfordshire, UK) delivered a square-wave stimulus of 200 μs duration at a maximum of 400 V. The optimal stimulation intensity for a single stimulus was determined by increasing the current gradually from 10 mA until a plateau in torque (50–115 mA) was reached. The current was then increased by a further 30% (70–150 mA) to ensure supramaximal stimulation. The intensity was kept constant for the same subject for all types of ES. The subjects were instructed to relax fully when the ES was applied.
Evaluation of NMF in response to ES
As shown in Fig. 1B, NMF evaluation consisted of the following sequence of stimuli: single stimulus (unpotentiated (UNPOT) SS); paired stimuli at 10 Hz (UNPOT PS10); paired stimuli at 100 Hz (UNPOT PS100); 5 s isometric MVC of the knee extensors; SS; PS10; PS100; and finally tetanic stimulation (TETANUS) at 100 Hz for 350–600 ms. The duration of the TETANUS was set individually based on the shortest tetani that produced the highest torque measured for tetanic stimuli of 300, 350, 400, 450, 500, 550 and 600 ms. This method of stimulation also provided a torque plateau in the fatigued state (data not shown). For the MVC, the subjects were instructed to reach maximum torque in 1 s, and then to maintain this level for 4 s whilst they received strong verbal encouragement. The interval between the stimulation techniques and between stimuli and MVCs was 1 s. PowerLab (ADInstruments Pty Ltd, Bella Vista NSW, Australia) was used to trigger the ES. Unpotentiated data (UNPOT SS, UNPOT PS10 and UNPOT PS100) are not presented in this paper. NMF was assessed with the knee angle positioned at 90 deg.
TT
The goal of the TT was to complete 30,000 J of work in the fastest time possible. The subjects performed repetitive isokinetic concentric knee extension–flexions at 300 deg s−1. In addition to knee extension, knee flexion was also used to mimic an activity such as cycling. The range of motion was from knee flexion at approximately 120 deg to full knee extension (anatomical zero) at 0 deg. As a result of familiarization testing, the subjects knew the approximate duration of the TT and were therefore able to pace themselves. Before the start of the TT, the subjects were reminded to complete the TT in as short a time as possible and that they would be stopped for approximately 20 s during the TT to assess NMF. During the TT, the subjects were verbally encouraged to perform a maximal effort. They received constant visual feedback of the proportion of the TT they had completed. After 18, 38, 58, 78 and 98% of the TT, the subjects were asked to report their ratings of perceived exertion (RPEs; Borg, 1974). The TT was briefly stopped for NMF evaluation after 20, 40, 60 and 80% of the TT. These measurements were performed again immediately (<5 s), and 1, 2, 4 and 8 min after completion of the TT.
Torque measurements
Right leg torque was measured in the isokinetic dynamometer during both the TT and the NMF assessment. During the TT, the dynamic maximum and minimum torque for every cycle of both extension and flexion was measured.
Experimental variables and data analysis
The mechanical responses to ES are reported as peak torque (PT). Maximal muscle torque capacity was measured as the PT response to the TETANUS stimulation. PS10/PS100 torque ratio was calculated as an index of low/high-frequency fatigue (Verges et al. 2009).
Statistical analyses
The data were analysed with Statistica 10.0 (Stat Soft. Inc., Tulsa, OK, USA). Descriptive statistics are presented as means ± SD unless otherwise noted. Repeated-measures ANOVAs were used to detect differences over time. When the F-value was significant, a Tukey post hoc test was used to determine the specific differences. The area under the curve was calculated for each stimulation torque/time relationship during the TT and the rest period, respectively (GraphPad Prism version 3.00 for Windows; GraphPad Software, San Diego, CA, USA; http://www.graphpad.com). The statistical significance was defined at P < 0.05.
Results
TT
Exercise duration during the TT was 347 ± 98 s. The times for successive 20% segments (6000 J) during the TT are presented in Table 1. The time for the first segment was significantly shorter than for all subsequent segments. Although the time for the final 20% of the TT (end spurt) appeared less than for the previous two segments, this difference was not significant (P > 0.05). The average time spent testing NMF (after each 20% segment of the TT) was 19 ± 1 s. RPE scores increased progressively during the TT (Table 1).
Table 1.
Exercise duration and RPE scores for each 20% segment of the TT
| 20% | 40% | 60% | 80% | 100% | |
|---|---|---|---|---|---|
| Exercise duration (s) | 48 ± 19 | 65 ± 21* | 80 ± 24*† | 82 ± 23*† | 72 ± 21* |
| RPE | 13.8 ± 1.3 | 15.5 ± 0.8* | 16.3 ± 1.2* | 17.2 ± 1.3*† | 18.2 ± 1.1*†‡ |
Values are expressed as means ± SD. RPE, rating of perceived exertion. Significantly different from 20%: *P < 0.05; significantly different from 40%: †P < 0.05; significantly different from 60%: ‡P < 0.05.
The average PT per extension–flexion cycle during the TT was 54 ± 13% of the concentric PT measured pre-TT. The total TT torque and torque during extension and flexion, considered separately, fell steeply during the first 20–40% of the TT but remained relatively unchanged thereafter (Fig. 2). As a result, only TT torque values measured either pre-TT or during the first 25% of the TT were significantly different from later values.
Figure 2. Voluntarily developed torque for combined extension and flexion during the time trial (TT) as a percentage of the pre-TT value.
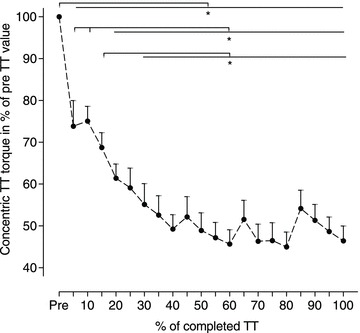
Values are expressed as means ± SEM, n= 10, *P < 0.05. The pre-TT value was 120.9 ± 7.2 N m.
Isometric torque measurements during exercise: time course of the development of fatigue
Isometric MVC torque declined progressively throughout the TT (Table 2; Fig. 3A). The decrease to 52 ± 11% of the baseline value at the end of the TT was significant (P < 0.001).
Table 2.
Absolute PT (N m) and ratio values for NMF measurements
| During TT | Rest | |||||||||
|---|---|---|---|---|---|---|---|---|---|---|
| Pre-TT | 20% | 40% | 60% | 80% | 100% | 1 min | 2 min | 4 min | 8 min | |
| SS (N m) | 70 ± 20 | 40 ± 14* | 29 ± 12*† | 27 ± 11*† | 26 ± 10*† | 23 ± 6*† | 33 ± 10* | 39 ± 12*§ | 41 ± 12*§ | 41 ± 12*§ |
| PS10 (N m) | 108 ± 28 | 63 ± 22* | 46 ± 20*† | 42 ± 17*† | 40 ± 16*† | 33 ± 9*† | 47 ± 16* | 56 ± 19*§ | 57 ± 20*§ | 54 ± 18*§ |
| PS100 (N m) | 111 ± 24 | 80 ± 21* | 65 ± 18*† | 62 ± 17*† | 59 ± 16*† | 53 ± 13*† | 63 ± 16* | 70 ± 19*§ | 73 ± 16*§ | 73 ± 17*§ |
| PS10/PS100 ratio | 0.97 ± 0.10 | 0.77 ± 0.12* | 0.69 ± 0.12* | 0.68 ± 0.12* | 0.67 ± 0.12* | 0.63 ± 0.09*† | 0.74 ± 0.12* | 0.79 ± 0.13*§ | 0.78 ± 0.13*§ | 0.73 ± 0.11* |
| TETANUS (N m) | 267 ± 82 | 213 ± 61* | 200 ± 58* | 196 ± 59* | 188 ± 53* | 175 ± 35*† | 200 ± 59* | 220 ± 56*§ | 229 ± 63*§ | 233 ± 70*§ |
| MVC (N m) | 306 ± 80 | 247 ± 79* | 203 ± 69*† | 187 ± 63*† | 168 ± 53*† | 153 ± 40*†‡ | 180 ± 51* | 199 ± 62*§ | 211 ± 70*§ | 222 ± 65*§ |
Values are expressed as means ± SD. MVC, maximal voluntary contraction; PS10, paired stimuli at 10 Hz; PS100, paired stimuli at 100 Hz; SS, single stimulus; TETANUS, tetanic stimulation at 100 Hz; TT, time trial. Significantly different from pre-TT value: *P < 0.05; significantly different from 20% during the TT: †P < 0.05; significantly different from 40% during the TT: ‡P < 0.05; significantly different from 100% (=0 min) in rest after TT: §P < 0.05.
Figure 3. Percentage difference from pre-time trial (TT) values for maximal voluntary contraction (MVC) torque (A), and PT response to ES for single stimulus (SS), paired stimuli at 100 Hz (PS100), paired stimuli at 10 Hz (PS10)/PS100 ratio and tetanic stimulation at 100 Hz (TETANUS; B) during the TT and after 1, 2, 4 and 8 min rest.
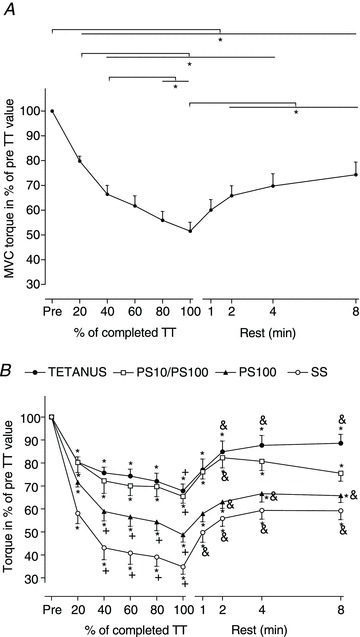
Values are expressed as means ± SEM, n= 10, *P < 0.05. Statistical differences for B: from the pre-TT value for the same variable, *P < 0.05; from 20% of the TT value for the same variable, +P < 0.05; from 100% (=0 min) for the same variable at rest after TT, &P < 0.05. Both during the TT and rest period, TETANUS, PS100, SS and PS10/PS100 were significantly different (P < 0.05) from each other, except between TETANUS and PS10/PS100 during the TT, based on the area under the curve statistics.
The percentage reductions and absolute values for PT in response to each stimulation method at each time point during exercise are shown in Fig. 3B and Table 2, respectively. Percentage reductions in PT were greatest in the first 40% of the TT for each stimulation method without any significant changes thereafter for any of the stimulation methods. With the exception of SS versus PS10 during both the TT and the rest period, and TETANUS versus PS10/PS100 during the TT, PT produced by the different stimulation methods, expressed as percentage change from pre-TT PT for either the TT or for the rest period, were significantly (P < 0.05) different from each other when analysed with the area under the curve statistical method (Fig. 3B). This effect appeared graded so that the smallest reduction in PT occurred with TETANUS, followed by PS100 and SS.
Short-term recovery
MVC torque recovered substantially within the first 2 min after the termination of exercise (P < 0.001), then continued to gradually recover to 74 ± 16% of the pre-TT value after 8 min.
PT responses to ES also recovered rapidly, and were already significantly different from termination of the TT after 1 min (SS and PS10, P < 0.01) and 2 min (PS100, TETANUS and PS10/PS100, P < 0.001) of rest. The pattern of recovery was similar for all stimulation methods (Fig. 3B). After 8 min rest, TETANUS PT (P < 0.05) and PT for SS, PS10, PS100 and PS10/PS100 (P < 0.001) remained significantly different from pre-TT values.
Discussion
To our knowledge, this is the first study describing instantaneous NMF measurements during and after an intense bout of self-paced dynamic exercise. The most important findings were that: (i) the major changes in muscle function in response to ES occurred within the first 40% of the TT with no further significant changes thereafter. We also showed that (ii) the extent of the measured change in NMF during exercise depends on the type of NMF evaluation that is used; and (iii) significant NMF recovery occurred within the first and second minutes of rest, suggesting that the extent of change in NMF has been underestimated by some degree in studies in which these measurements are first made 2–10 min after exercise termination.
NMF-measured PT reached a plateau at 40% of the total exercise duration
Concentric TT torque and PT did not change progressively during the TT. Instead, the fall in PT stabilized within the first 40% of the exercise bout with no further significant changes thereafter (Fig. 3B). In contrast, MVC torque continued to decline after 40% of the TT (Fig. 3A), whereas RPEs continued to increase progressively (Table 1). Previous studies conducted at much lower exercise intensities have also shown a plateau in the reduction of electrically evoked PT despite a progressive decrease in MVC (Lepers et al. 2002; Place et al. 2004; Martin et al. 2010; Decorte et al. 2012). In contrast, no evidence for the reduction in PT was detected in a self-paced 20 km treadmill run (Ross et al. 2010), although central motor drive was reduced. Other studies (Martin et al. 2010; Millet et al. 2011; Decorte et al. 2012) indicate that the extent of NMF reduction during TT exercise is independent of task duration, although specific research in this area is still lacking.
Unchanged PT and TT torque during the last 60% of the TT indicate that early in the TT the participants adopted a pace that could be kept relatively constant throughout the TT despite the progressive fall in MVC torque. The fall in isometric MVC and the continuous increase in RPE during the TT may be partly due to muscle fatigue and the associated feedback from the muscles to the CNS, and could also include feedforward mechanisms (Millet, 2011). This suggests that central regulation is an important factor directing the intensity during this form of exercise.
The break of 19 s four times during the TT may have caused some recovery and hence influenced the TT torque. However, it is difficult to make the break shorter with several ES measurements and a MVC.
The extent of the changes in NMF measured with the different testing methods differed substantially
PT responses to the ES methods (SS, PS100 and TETANUS) were significantly different both during the TT and during rest (Fig. 3B) when analysed with area under the curve statistics. Traditionally, PT from SS is used to estimate changes in muscle function during or after exercise (Place et al. 2010). Whereas PT from SS measured a 65% reduction at the end of the TT, it was ‘only’ reduced by 51% for PS100 and 32% for TETANUS. On the other hand, the PT responses changed in a similar way for all stimulation methods (Fig. 3B) even though the magnitude of these changes was different. The influence of E–C coupling is assessed indirectly from the PS10/PS100 ratio, which may be an alternate measure of low-frequency fatigue (Verges et al. 2009; Millet et al. 2011). In this study the PS10/PS100 ratio decreased by 35% during the TT, indicating that low-frequency fatigue may be significantly implicated in the development of peripheral fatigue and could explain a large part of the decrease in muscle function measured with SS.
There was a rapid recovery in both MVC and PT within the first and second minute of rest
All NMF measurements began to recover within the first 2 min after the TT (Table 2; Fig. 3). Despite this impressive early recovery, neither MVC nor any of the PT variables had returned to the pre-TT value within 8 min of rest.
Rapid recovery in some measures of PT has not previously been reported for self-paced prolonged exercises (Lattier et al. 2004; Racinais et al. 2007), probably because some degree of recovery of PT had already occurred before the first post-exercise measurements were performed in those studies (Macintosh & Shahi, 2011).
However, rapid recovery measured as changes in MVC, power output or PT have been reported by others (Szubski et al. 2007). Studies have also shown that there is a very rapid post-exercise recovery within 5–10 s after cycling exercise (Sargeant & Dolan, 1987) or after stimulation of single muscle fibres (Westerblad & Allen, 1991).
This rapid recovery of skeletal muscle function following intense whole body exercise requires that measurements of NMF must be performed immediately after the termination of exercise if the full magnitude of change is to be detected. Indeed, the extent (Fig. 3B) of NMF changes is reversed within the first minute once exercise terminates. Changes in PT during a TT, when measured 2 min or more after completion of the TT (Amann & Dempsey, 2008), may therefore produce incorrect findings. However, this does not necessarily change the general conclusions of those studies.
Conclusion
The present findings help to clarify the kinetics of changes in NMF during and after an intense bout of self-paced, high-intensity dynamic exercise. The major changes in NMF occur within the first 40% of exercise that is within the first 2 min of a ∼6 min exercise bout. Hence, PT reached a plateau after 40% of the TT, and the subjects produced unchanged dynamic torque for the last 60% of the TT. It is also proposed that: (i) the extent of the measured change in NMF during exercise is dependent on the type of NMF evaluation used; and (ii) significant recovery occurs in skeletal muscle function within the first 2 min after exercise, suggesting that the extent of peripheral fatigue has been underestimated by previous studies. Further studies need to establish if fatigue kinetics are the same for TT exercises of similar intensities performed in running or cycling.
Acknowledgments
The authors would like to thank Fernando Gabe Beltrami for contribution to the data collection and revision of the manuscript, and Dr Nicolas Place for his kind revision of the manuscript. The authors have no conflicts of interest to disclose. This research was funded by the University of Cape Town Staff Research Fund, the Medical Research Council of South Africa, Discovery Health and the National Research Foundation.
Glossary
- E–C
excitation–contraction
- ES
electrical stimulation
- MVC
maximal voluntary contraction
- NMF
neuromuscular function
- PS10
paired stimuli at 10 Hz
- PS100
paired stimuli at 100 Hz
- PT
peak torque response to electrical stimulation
- RPE
rating of perceived exertion
- SS
single stimulus
- TETANUS
tetanic stimulation at 100 Hz
- TT
time trial
- UNPOT
unpotentiated
Author contributions
The experiments were performed at the University of Cape Town, South Africa. C.F. and T.D.N. conceptualized and designed the study. C.F. collected and analysed the data, while all authors interpreted the data. C.F. drafted the manuscript, while all authors contributed to the manuscript and approved the final version of the manuscript.
References
- Allen D, Westerblad H. What limits exercise during high-intensity aerobic exercise. Eur J Appl Physiol. 2010;110:661–662. doi: 10.1007/s00421-010-1538-z. [DOI] [PubMed] [Google Scholar]
- Amann M, Dempsey JA. Locomotor muscle fatigue modifies central motor drive in healthy humans and imposes a limitation to exercise performance. J Physiol. 2008;586:161–173. doi: 10.1113/jphysiol.2007.141838. [DOI] [PMC free article] [PubMed] [Google Scholar]
- Amann M, Romer LM, Pegelow DF, Jacques AJ, Hess CJ, Dempsey JA. Effects of arterial oxygen content on peripheral locomotor muscle fatigue. J Appl Physiol. 2006;101:119–127. doi: 10.1152/japplphysiol.01596.2005. [DOI] [PubMed] [Google Scholar]
- Bigland-Ritchie B, Woods JJ. Changes in muscle contractile properties and neural control during human muscular fatigue. Muscle Nerve. 1984;7:691–699. doi: 10.1002/mus.880070902. [DOI] [PubMed] [Google Scholar]
- Borg GA. Perceived exertion. Exerc Sport Sci Rev. 1974;2:131–153. [PubMed] [Google Scholar]
- Cairns SP, Knicker AJ, Thompson MW, Sjogaard G. Evaluation of models used to study neuromuscular fatigue. Exerc Sport Sci Rev. 2005;33:9–16. [PubMed] [Google Scholar]
- Cheng AJ, Davidson AW, Rice CL. The influence of muscle length on the fatigue-related reduction in joint range of motion of the human dorsiflexors. Eur J Appl Physiol. 2010;109:405–415. doi: 10.1007/s00421-010-1364-3. [DOI] [PubMed] [Google Scholar]
- Decorte N, Lafaix PA, Millet GY, Wuyam B, Verges S. Central and peripheral fatigue kinetics during exhaustive constant-load cycling. Scand J Med Sci Sports. 2012;22:381–391. doi: 10.1111/j.1600-0838.2010.01167.x. [DOI] [PubMed] [Google Scholar]
- Enoka RM, Stuart DG. Neurobiology of muscle fatigue. J Appl Physiol. 1992;72:1631–1648. doi: 10.1152/jappl.1992.72.5.1631. [DOI] [PubMed] [Google Scholar]
- Gandevia SC. Spinal and supraspinal factors in human muscle fatigue. Physiol Rev. 2001;81:1725–1789. doi: 10.1152/physrev.2001.81.4.1725. [DOI] [PubMed] [Google Scholar]
- Lattier G, Millet GY, Martin A, Martin V. Fatigue and recovery after high-intensity exercise. Part II: recovery interventions. Int J Sports Med. 2004;25:509–515. doi: 10.1055/s-2004-820946. [DOI] [PubMed] [Google Scholar]
- Lepers R, Maffiuletti NA, Rochette L, Brugniaux J, Millet GY. Neuromuscular fatigue during a long-duration cycling exercise. J Appl Physiol. 2002;92:1487–1493. doi: 10.1152/japplphysiol.00880.2001. [DOI] [PubMed] [Google Scholar]
- Macintosh BR, Shahi MR. A peripheral governor regulates muscle contraction. Appl Physiol Nutr Metab. 2011;36:1–11. doi: 10.1139/H10-073. [DOI] [PubMed] [Google Scholar]
- Martin V, Kerherve H, Messonnier LA, Banfi JC, Geyssant A, Bonnefoy R, Feasson L, Millet GY. Central and peripheral contributions to neuromuscular fatigue induced by a 24-h treadmill run. J Appl Physiol. 2010;108:1224–1233. doi: 10.1152/japplphysiol.01202.2009. [DOI] [PubMed] [Google Scholar]
- Martin V, Millet GY, Martin A, Deley G, Lattier G. Assessment of low-frequency fatigue with two methods of electrical stimulation. J Appl Physiol. 2004;97:1923–1929. doi: 10.1152/japplphysiol.00376.2004. [DOI] [PubMed] [Google Scholar]
- Millet GY. Can neuromuscular fatigue explain running strategies and performance in ultra-marathons?: the flush model. Sports Med. 2011;41:489–506. doi: 10.2165/11588760-000000000-00000. [DOI] [PubMed] [Google Scholar]
- Millet GY, Lepers R, Maffiuletti NA, Babault N, Martin V, Lattier G. Alterations of neuromuscular function after an ultramarathon. J Appl Physiol. 2002;92:486–492. doi: 10.1152/japplphysiol.00122.2001. [DOI] [PubMed] [Google Scholar]
- Millet GY, Tomazin K, Verges S, Vincent C, Bonnefoy R, Boisson RC, Gergele L, Feasson L, Martin V. Neuromuscular consequences of an extreme mountain ultra-marathon. PLoS One. 2011;6:e17059. doi: 10.1371/journal.pone.0017059. [DOI] [PMC free article] [PubMed] [Google Scholar]
- Place N, Lepers R, Deley G, Millet GY. Time course of neuromuscular alterations during a prolonged running exercise. Med Sci Sports Exerc. 2004;36:1347–1356. doi: 10.1249/01.mss.0000135786.22996.77. [DOI] [PubMed] [Google Scholar]
- Place N, Yamada T, Bruton JD, Westerblad H. Muscle fatigue: from observations in humans to underlying mechanisms studied in intact single muscle fibres. Eur J Appl Physiol. 2010;110:1–15. doi: 10.1007/s00421-010-1480-0. [DOI] [PubMed] [Google Scholar]
- Power GA, Dalton BH, Rice CL, Vandervoort AA. Delayed recovery of velocity-dependent power loss following eccentric actions of the ankle dorsiflexors. J Appl Physiol. 2010;109:669–676. doi: 10.1152/japplphysiol.01254.2009. [DOI] [PMC free article] [PubMed] [Google Scholar]
- Racinais S, Girard O, Micallef JP, Perrey S. Failed excitability of spinal motoneurons induced by prolonged running exercise. J Neurophysiol. 2007;97:596–603. doi: 10.1152/jn.00903.2006. [DOI] [PubMed] [Google Scholar]
- Ross EZ, Goodall S, Stevens A, Harris I. Time course of neuromuscular changes during running in well-trained subjects. Med Sci Sports Exerc. 2010;42:1184–1190. doi: 10.1249/MSS.0b013e3181c91f4e. [DOI] [PubMed] [Google Scholar]
- Sargeant AJ, Dolan P. Effect of prior exercise on maximal short-term power output in humans. J Appl Physiol. 1987;63:1475–1480. doi: 10.1152/jappl.1987.63.4.1475. [DOI] [PubMed] [Google Scholar]
- Szubski C, Burtscher M, Loscher WN. Neuromuscular fatigue during sustained contractions performed in short-term hypoxia. Med Sci Sports Exerc. 2007;39:948–954. doi: 10.1249/mss.0b013e3180479918. [DOI] [PubMed] [Google Scholar]
- Verges S, Maffiuletti NA, Kerherve H, Decorte N, Wuyam B, Millet GY. Comparison of electrical and magnetic stimulations to assess quadriceps muscle function. J Appl Physiol. 2009;106:701–710. doi: 10.1152/japplphysiol.01051.2007. [DOI] [PubMed] [Google Scholar]
- Westerblad H, Allen DG. Changes of myoplasmic calcium concentration during fatigue in single mouse muscle fibers. J Gen Physiol. 1991;98:615–635. doi: 10.1085/jgp.98.3.615. [DOI] [PMC free article] [PubMed] [Google Scholar]