

Abstract
Cardiomyocytes (CMs) derived from human pluripotent stem cells (hPSCs) possess a high potential for regenerative medicine. Previous publications suggested that viral transduction of a defined set of transcription factors (TFs) known to play pivotal roles in heart development also increases cardiomyogenesis in vitro upon overexpression in mouse or human ES cells. To circumvent issues associated with viral approaches such as insertional mutagenesis, we have established a transient transfection system for straightforward testing of TF combinations. Applying this method, the transfection efficiency and the temporal pattern of transgene expression were extensively assessed in hPSCs by quantitative real time-polymerase chain reaction (qRT-PCR), TF-specific immunofluorescence analysis, and flow cytometry. Testing TF combinations in our approach revealed that BAF60C, GATA4, and MESP1 (BGM) were most effective for cardiac forward programming in human induced pluripotent stem cell lines and human ES cells as well. Removal of BAF60C slightly diminished formation of CM-like cells, whereas depletion of GATA4 or MESP1 abolished cardiomyogenesis. Each of these TFs alone had no inductive effect. In addition, we have noted sensitivity of CM formation to cell density effects, which highlights the necessity for cautious analysis when interpreting TF-directed lineage induction. In summary, this is the first report on TF-induced cardiomyogenesis of hPSCs applying a transient, nonintegrating method of cell transfection.
Introduction
Myocardial infarction and other cardiovascular disorders can induce severe, irreversible loss of functional cardiomyocytes (CMs) and reduced heart function. Ultimately, this may lead to heart failure with very limited treatment options at present. CMs derived from human pluripotent stem cells (hPSCs), including human embryonic stem cells (hESCs) and human induced pluripotent stem cells (hiPSCs), possess a high potential for the development of innovative regenerative treatments for diseased hearts. They also represent a human cell source for the development of more predictive drug discovery and drug safety assays [1]. Furthermore, patient-specific hiPSC-derived CMs have recently been established as a tool for in vitro disease modeling. It has, for example, been demonstrated that the expected prolongation of the action potential duration characteristic of patients with long-QT syndrome was successfully emulated in patient-specific hiPSC-derived CMs [2–4].
However, one of the main obstacles in generating CMs from hPSCs is the relatively variable and inefficient differentiation efficiency [5]. Several approaches have been investigated to better control the differentiation process and to improve CM yields from hPSCs, including the relative costly supplementation of growth factors or specific effector molecules [5]. In addition, the overexpression of single or multiple transcription factors (TFs) known to play significant roles in heart development was tested. An in situ study demonstrated the ectopic induction of beating cardiac tissue in preformed mouse mesoderm outside the heart field by the combined expression of GATA4, TBX5, and the chromatin remodeling complex subunit BAF60C [6]. Subsequently, lentiviral-delivered TFs were claimed to induce direct transdifferentiation of mouse cardiac and tail-tip fibroblasts into functional CMs in vitro [7] and in vivo [8,9]. Despite their exciting clinical implications, the efficiency of such direct conversion experiments is controversially discussed in the field [10]. Regarding PSCs, forward programming has been demonstrated upon constitutive overexpression of MESP1 and NKX2.5 in mouse ES cells applying embryoid body (EB)-induced differentiation [11]. Most recently, a 4-factor cocktail, including GATA4, TBX5, NKX2.5, and BAF60C, was found to induce expression of an MYH6-monomeric red fluorescent protein (mRFP) reporter transgene, suggesting formation of CMs from hESCs after lentivirus-based TF introduction [12].
Despite their experimental utility, retro- or lentiviral vector systems have limitations. They require cumbersome and time-consuming cloning and virus production procedures, specially equipped laboratories with higher safety levels, and pose issues for potential clinical applications due to their tendency to activate oncogenes after random integration into the host genome [13].
Given the high practical value of improving in vitro CM differentiation and, on the other hand, the general interest in dissecting TF networks controlling cardiomyogenesis, the aim of this study was to establish novel techniques for transient expression of TFs in hPSCs. Applying an efficient electroporation-based method of transgene delivery developed by us, we have tested TF combinations toward their ability to induce CM formation in hPSCs independent of EB formation. Rather than relying on a potentially deceptive reporter line assay, we have focused on assessing expression of well-established endogenous marker genes by immunofluorescence analysis to unequivocally monitor CM formation. Using this system, we found that in hPSCs, a combination of 3 factors, BAF60C, GATA4, and MESP1, was most effective for induction of CM-like cells, which was even reduced to GATA4 and MESP1 only. Yet, we have also observed an impact of the (overall and local) cell density on cardiomyogenesis calling for a critical assessment of reports on the topic.
Materials and Methods
Vector construction
To generate expression vectors, TF cDNAs were cloned by RT-PCR or received from ImaGenes (Berlin, Germany), cloned into pCAGGS2 under the control of the CMV enhancer (CMVieE)/chicken beta-actin promoter (CAG), and sequence verified. For coexpression of fluorescence reporters, an internal ribosome entry site 2 (IRES2) was employed in front of a Venus or nRedStar reporter gene, respectively, both targeted to the nuclear membrane.
Cell culture and transfection
Human cord blood iPS2 cells (hCBiPS2) were generated from human cord blood and characterized in our laboratory [14]. Hematopoietic stem cell-derived iPS (HSC-iPS) lines 1441 and 1285 were generated from human hematopoietic stem cells and characterized in our laboratory. All hiPS lines and the ESC line hES3 were maintained on irradiated mouse embryonic fibroblasts (MEFs) in a culture medium containing knockout DMEM, 20% serum replacement, 1% NEAA, 1 mM l-glutamine, 0.1 mM β-mercaptoethanol (all GIBCO, Karlsruhe, Germany), and 10 ng/mL recombinant human bFGF generated by Chen et al. [15]. For electroporation, 1×10⁶ cells were applied after dissociation with TrypLE and transfected with 10 μg of each plasmid using the Neon® transfection system (Invitrogen, Karlsruhe, Germany). In brief, detached hPSCs were washed once with phosphate-buffered saline w/o Ca2+/Mg2+, collected at 1000 rpm for 5 min, resuspended in 110 μL buffer R, and transferred with the corresponding circular plasmids in sterile microcentrifuge tubes. Cells were electroporated with 2 pulses at 1200 V for 20 ms and seeded at a density of 0.33×10⁶ cells per well in 12 well-plates (Nunc, Langenselbold, Germany) precoated with 0.1% gelatin in an MEF-conditioned culture medium supplemented with 10 μM Rho-Kinase inhibitor Y-27632 (supplied by the Institute for Organic Chemistry, Leibniz University Hannover, Germany [16]). After 48 h, the culture medium was changed to a basic serum-free (bSF) medium containing DMEM, 1% NEAA, 1 mM l-glutamine, 1% transferrin–selenium, and 0.1 mM β-mercaptoethanol (all GIBCO, Karlsruhe, Germany) supplemented with 10 μM p38 MAPK inhibitor SB203580 (supplied by the Institute for Organic Chemistry, Leibniz University, Hannover, Germany). Medium changes were performed every 2 days throughout the 14-day differentiation period.
Immunofluorescence and flow cytometry
Cells were fixed with 4% paraformaldehyde and permeabilized using the TBS buffer supplemented with 0.5% Tween20 and 0.5% serum for 1 h. Applied primary antibodies are listed in Table 1. Cells were incubated with primary and secondary antibodies (Dylight549-conjugated AffiniPure donkey anti-mouse IgG and Dylight488-conjugated AffiniPure donkey anti-rabbit IgG; Jackson Immunoresearch Laboratories, Suffolk, United Kingdom) for 1 h each, respectively. Nuclei were counterstained with DAPI (4,6-diamidino-2-phenylindole, diluted 1:30,000; Sigma-Aldrich, Deisenhofen, Germany). Microscopic analysis was carried out using an Axio Observer A1 microscope (Carl Zeiss MicroImaging, Gottingen, Germany). For manual quantification, wells were systematically screened for the presence of cells, that is, cell clusters staining for the respective marker.
Table 1.
List of Antibodies Used for Assessing Transcription Factor Expression and Cardiomyocyte Detection by Immunofluorescence
| Name | Species | Class | Clonality | Vendor | Dilution |
|---|---|---|---|---|---|
| Anti-troponin T | Mouse | IgG2a | Monoclonal | Thermo Scientific, Karlsruhe, Germany | 1:100 |
| Anti-sarcomeric-α-Actinin | Mouse | IgG1 | Monoclonal | Sigma, Saint Louis, MO | 1:800 |
| Anti-αMHC (MF20) | Mouse | IgG | Polyclonal | Hybridoma supernatant, self-produced | 1:10 |
| Anti-NKX2.5 (clone H114) | Rabbit | IgG | Polyclonal | Santa Cruz Biotechology, Santa Cruz, CA | 1:200 |
| Anti-GATA4 (clone C20) | Goat | IgG | Polyclonal | Santa Cruz Biotechology | 1:100 |
| Anti-BAF60C (clone 1G6) | Mouse | IgG2a | Monoclonal | Abnova, Heidelberg, Germany | 1:100 |
| Anti-TBX5 (clone 1G10) | Mouse | IgG1 | Monoclonal | Abnova | 1:100 |
| Anti-MESP1 | Rabbit | IgG | Polyclonal | Received from R. David, LMU München | 1:90 |
| Isotype control | Mouse | IgG1 | Monoclonal | DAKO, Glostrup, Denmark | 1:50 |
| Isotype control | Mouse | IgG2a | Monoclonal | DAKO | 1:100 |
| Isotype control | Rabbit | IgG | Polyclonal | Santa Cruz Biotechology | 1:200 |
| Isotype control | Goat | IgG | Polyclonal | R&D, Minneapolis, MN | 1:200 |
Fluorescent reporter expression was quantified with an FACSCalibur cell analyzer (Becton Dickinson, Heidelberg, Germany), and raw data were analyzed using software CellQuest. To exclude dead cells, propidium iodide (PI) was added to samples.
RNA isolation and quantitative RT-PCR
Total RNA was obtained by dissolving cells in Trizol® Reagent (Invitrogen, Karlsruhe, Germany) followed by isolation with a Nucleospin® RNA II Kit, including DNase I digestion, according to the manufacturer's instructions (Macherey Nagel, Düren, Germany). RNA quality was assessed by a Bioanalyzer 2100 (Agilent, Boeblingen, Germany). Reverse transcription was performed applying RevertAid™ H Minus First Strand cDNA synthesis Kit (Fermentas, St. Leon-Rot, Germany) using random primers. For conventional RT-PCR, 1 μL of cDNA was amplified by PCR with GoTaq polymerase (Promega, Madison, WI). Quantitative PCR was performed using ABsolute™ QPCR SYBR® Green Mix (ABgene, Epsom, United Kingdom) on Mastercycler ep realplex® (Eppendorf, Hamburg, Germany). Data were analyzed by the ΔCt method. Expression levels of target genes were normalized to β-actin. Sequences and specifications of primers are shown in Table 2.
Table 2.
Polymerase Chain Reaction Primer Sequences, Annealing Temperatures (TA), and Lengths of the Respective Product
| Primer | Target | Sequence (5—>3) | Product size (bp) | TA |
|---|---|---|---|---|
| qRT BAF60C F | NM_001003801.1 | GCCTGATGCTGAGGATTCCG | 162 | 60°C |
| qRT BAF60C R | AGGTGGTTGTCAGGGCCATA | |||
| qRT GATA4 F | NM_002052.3 | AGACGTTCTCAGTCAGTGCG | 124 | 60°C |
| qRT GATA4 R | TTGGAGCTGGTCTGTGGAGA | |||
| qRT MESP1 F | NM_018670.3 | CGCAGATGCAGACACGGAC | 70 | 60°C |
| qRT MESP1 R | CCTTGTCACTTGGGCTCCTC | |||
| NKX2.5 F | NM_004387.3 | AAGGACCCTAGAGCCGAAA | 79 | 60°C |
| NKX2.5 R | GTTGTCCGCCTCTGT | |||
| TBX5 F | NM_000192.3 | AGCAGTGACTTCCTACCAGAAC | 108 | 60°C |
| TBX5 R | TGACATTCTGTGCAGCTCCAT | |||
| β-Actinin RT F | NM_001101.3 | ATTGCCGACAGGATGCAGAA | 176 | 60°C |
| β-Actinin RT R | GGGCCGGACTCGTCATACTC |
Statistical analysis
Statistical analysis was performed by one-way ANOVA (followed by Dunnett's test), and standard deviation of the mean is presented. Results were considered significant at P<0.05 indicated by * and P<0.01 indicated by **, respectively.
Results
Efficient multiplasmid transfection of hPSCs by electroporation
To assess the ability of forced transcription factor expression for directing cardiac differentiation, we have established an efficient, but gentle, hPSC transfection method [35]. Fluorescence microscopy 48 h post-transfection of plasmids encoding RedStar (targeted to the nuclear membrane, nRedStar) or eGFP controlled by a constitutive promoter showed bright labeling of electroporated cells (Fig. 1A–C; plasmid structure is displayed in Fig. 1D). Concurrent cell counting at 48 h revealed ∼60% vital cell recovery compared to the number of cells seeded after electroporation (data not shown). For a human cord blood-derived iPS line (hCBiPS2 [14]), flow cytometry (Fig. 1E) revealed, on average, 49.9%±14.0% nRedStar- and 49.8%±14.1% eGFP-positive cells (Fig. 1F). Equivalent values were observed for nRedStar expression in hES3 cells (53.47%±10.7%), whereby the average number of eGFP-positive cells was somewhat lower, that is, 36.6%±12.1% (Fig. 1F). Cotransfection with both plasmids resulted in 31.3%±9.3% double-positive hCBiPS2 and 28.4%±7.8% hES3 cells, respectively (Fig. 1F). These values were higher than the theoretically expected double-transfection efficiencies of 24.85% for hiPS-K2 cells and 19.6% for hES3, which were calculated from the single-plasmid transfection results by the following equation: hCBiPS2: 100×(49.9% nRedStar/100×49.8% eGFP/100), hES3: 100×(53.47% nRedStar/100×36.6% eGFP/100). The higher-than-calculated numbers of double-positive cells observed experimentally suggest that by our transfection method, successfully targeted cells are likely to coexpress transgenes encoded on independent plasmids added during electroporation.
FIG. 1.

Efficient transfection of human cord blood iPS2 (hCBiPS2) and hES3 cells by electroporation. (A–C) Overlay of fluorescence and phase-contrast images of hCBiPS2 cells transfected with reporter plasmids encoding RedStar targeted to the nuclear membrane (nRedStar) or cytosolic eGFP (enhanced green fluorescent protein) or both at 48 h post-transfection; insert in (C) represents higher magnification to visualize orange-like nuclei in double-positive cells. (D) Schematic presentation of the eukaryotic expression cassettes of reporter plasmids. Fluorescence reporter expression is driven by the chicken beta-actin promoter (CAG). (E) Flow cytometry plots of hCBiPS2 cells exemplary depicting untransfected (upper row), eGFP (lower left), nRedStar (lower middle), and nRedStar/eGFP double-transfected (lower right) cell populations 48 h after transfection with respective reporter plasmids. (F) Flow cytometry-based quantification of hCBiPS2 and hES3 cells transfected with nRedStar (red), eGFP (green), or both (red and green stripes) 48 h post-transfection (n=3).
IRES-coupled reporter gene coexpression is a reliable marker to monitor plasmid-encoded TF expression
Next, TF expression vectors were cloned that individually encoded 1 of the 4 TFs, GATA4, TBX5, MESP1, or NKX2.5, each coupled to a fluorescence reporter gene targeted to the nuclear membrane, nVenus or nRedStar, respectively, via an IRES (Fig. 2A). Within the limits of a 2-color code, this arrangement allowed us to monitor the transfection efficiency of each individual experiment throughout the study. Given the importance to validate TF expression on the protein level, we have applied specific antibodies to test the presence of individual factors and overlaid the respective staining with the corresponding fluorescence reporter activity in transfected cells (Fig. 2B). Highly overlapping nuclear colocalization of fluorescence markers and the respective TF-specific staining in individual cells were found for all 4 plasmid constructs tested. These findings suggest that the reporter gene expression is a reliable surrogate marker to monitor TF expression from our constructs. It is worth to note that TF-specific immunofluorescence staining was essentially undetectable in nontransfected control cells, with the exception of low GATA4 positivity in few cells (data not shown).
FIG. 2.

Efficient transcription factor (TF) expression from bicistronic transfection vectors. (A) Left panel: Schematic presentation of bicistronic transfection vectors encoding respective TFs coupled to fluorescence reporters via an internal ribosome entry site (IRES). Reporters are targeted to the nuclear membrane (nVenus or nRedStar). Right panel: Overlay of fluorescence reporter gene expression and anti-TF-specific antibody staining 48 h post-transfection in hCBiPS2 cells. (B) Scheme of the monocistronic BAF60C expression cassette (left) and immunofluorescence images of cells transfected with the respective vector (upper row) versus nontransfected controls (lower row). White arrows indicate nuclear speckles representing anti-BAF60C-specific antibody stain.
The fifth factor tested in our study was BAF60C. Published data showed that this factor, when overexpressed in cell culture, can mediate interactions between cardiac TFs and the BAF complex ATPase Brg1, thereby potentiating the activation of target genes [17]. These findings prompted us to always include this factor in our transfection experiments, thereby combining the expression of BAF60C (encoded on an individual plasmid without reporter gene coupling; Fig. 2C) with all possible double-TF combinations in the present study (Fig. 3E and onward). At first, however, anti-BAF60C-specific immunofluorescence staining was established, displaying the expected speckle-like pattern in the nuclei of transfected cells (see arrows in Fig. 2C), which was absent in nontransfected hiPSC controls (lower panel in Fig. 2C).
FIG. 3.

Kinetics of transgene expression revealed a narrow peak on the RNA level and a 2–4-day expression window assessed by flow cytometry. (A) TF expression kinetics at 0–72 h post-transfection in hCBiPS2 analyzed by quantitative real time-polymerase chain reaction (qRT-PCR), exemplarily depicting MESP1 (n=3). (B) qRT-PCR-based analysis to test levels of TF overexpression in cells transfected either with a single-plasmid (white bars) or a triple-plasmid combination (black bars) normalized to mock-transfected controls (n=3 for single, n=8 for triple transfections). RNA was harvested 12 h post-transfection. (C) Flow cytometry-based analysis of nVenus-transfected cells at days 2–6 post-transfection (n=3). (D) Relative decline of reporter gene expression measured by flow cytometry of nVenus+, nRedStar+, or double-positive cell populations (n=3 for Venus and RedStar, n=2 for double-positive analysis). (E) Flow cytometry-based quantification of double-positive cells transfected with the indicated triple-plasmid combinations (see letter code below X-axis) 48 h post-transfection. B, BAF60C; G, GATA4; M, MESP1; N, NKX2.5; RS, nRedStar; T, TBX5; V, nVenus.
We next applied qRT-PCR to monitor cardiac TF expression in transfected hCBiPS2 cells on the RNA level. Independent of the transgene, a sharp peak of overexpression was observed at 12 h postelectroporation, declining thereafter (Fig. 3A) as expected for nonintegrating, nonreplicating plasmids. Focusing on individual factors, we found 2 ranges of TF overexpression when normalized to the respective endogenous expression level in control cells (transfected with reporter plasmids only). For BAF60C and GATA4, a moderate ∼5–10-fold elevation was observed (Fig. 3B). For MESP1, TBX5, and NKX2.5, this range was one magnitude higher, that is, ∼50–300-fold, above controls. We also compared the expression level after transfection with either one TF-encoding plasmid alone (white bars in Fig. 3B) or after cotransfection of 3 plasmids, each encoding another factor (gray bars in Fig. 3B). Normalized expression levels after 3-plasmid cotransfection were equivalent or slightly higher compared to the single-transfection approach. Notably, rigorous RT-minus controls revealed no plasmid-born background in these assays (Supplementary Fig. S1; Supplementary Data are available online at www.liebertpub.com/scd).
Longitudinal monitoring of transgene expression was then tracked by flow cytometry. A substantial, stable proportion of hCBiPS2 cells was found to express IRES-coupled reporter genes at days 2–3 after transfection with 1 or 2 plasmid vectors, and a stepwise decline was observed on days 4–6 (last time point tested) thereafter (Fig. 3C, D).
Subsequently, to establish expression of specific 3-factor combinations, 3 independent TF constructs in hCBiPS2 cells were simultaneously transfected. Flow cytometry at 48 h (Supplementary Fig. S2) revealed that the number of nVenus/nRedStar double-positive cells remained in the same range previously found after electroporation of 2 reporter-only plasmids (Fig. 1E), that is, from 22.7% to 37.8%, respectively (Fig. 3E).
Combined transfection with BAF60C, GATA4, and MESP1 induces formation of CM-marker-expressing clusters
Previous reports have shown an impact of TF overexpression on cardiomyogenic induction of pluripotent cells upon combining different factors. Here, we have tested individual TF candidates as well as combinations of 2 or 3, whereby BAF60C was always included in our 3 factor cocktails.
After electroporation, cells were seeded as a subconfluent monolayer on gelatin-coated dishes and cultured in a feeder cell-conditioned medium for 2 days to allow for recovery (Fig. 4A). The medium was then replaced by a fully defined serum-free medium (bSF [18,19]) for another 12 days of culture. Figure 4C depicts the morphology of hCBiPS2 as colonies on murine feeder cells on day 0, on day 2 postelectroporation, and as confluent monolayer formed over time in a bSF medium (day 14). Starting with 0.33×10⁶ electroporated cells per well of a 12-well dish, about 67% vital cells were retrieved on day 2 (Fig. 4B, 0.22±0.12×10⁶ TF-transfected cells and 0.21±0.11×10⁶ reporter plasmid-receiving controls). The cell number increased by about 3-fold at day 14 after electroporation, resulting in 0.69±0.39×10⁶ of TF-transfected cells (0.71±0.35×10⁶ cells in control transfections). To test the formation of CMs, immunofluorescence staining specific to the sarcomeric protein cardiac Troponin T (cTnT) was performed in combination with the CM-specific TF NKX2.5, and positive cell clusters in individual dishes were counted. Distinct clusters consisting of 2 to >50 cells were observed, most of which coexpressed both cardiac markers tested (Fig. 4D). Of importance, in this assay, positive stained cells were absent in untransfected and mock-transfected controls included in all experiments with a rare background (Fig. 4E). As summarized in Fig. 4E, in triple combinations, only BAF60C, GATA4, and MESP1 (BGM) yielded a considerable number of cTnT- and NKX2.5-positive clusters, that is, 30.6±26.6 clusters per well of a 12-well dish (Fig. 4E). Despite a considerable degree of interexperimental variation, our data were highly significant compared to controls or other TF combinations in a high number of biological repeats. Any other triple combination tested resulted in <5 positive clusters per well on average, and notably <10 clusters per well in any individual experiment, which was also true for the combination of BAF60C, GATA4, and TBX5 (BGT), recently reported to induce ectopic beating cardiac cells in mouse embryos [6].
FIG. 4.

BGM was the most efficient triple TF combination in inducing cardiac Troponin T (cTnT)/NKX2.5 double-positive clusters. (A) Schematic presentation of the experimental schedule: cells were cultured in feeder-conditioned medium for 48 h post-transfection followed by a culture period in defined serum-free medium before immunefluorescence analysis was performed at day 14. (B) Respective cell counts at d2 and d14. Initially, 0.33×10⁶ electroporated cells per 12-well were seeded. (C) Representative pictures of hCBiPS2 cells before electroporation (d0, on murine feeder cells) and 2 days thereafter (d2) as well as at the end of the protocol (d14). (D) Examples of cTnT+ (red) and NKX2.5+ (green) cell clusters after simultaneous transfection of triple TF combinations (BGM, BGT, and BTM). Clusters possessed various shapes and sizes (containing a range of number of cells). Nuclei were counterstained with DAPI (blue). (E) Counts of cTnT/NKX2.5 double-positive cell clusters per 12-well on d14 post-transfection with respective TF combination as indicated. P<0.05 indicated by * and P<0.01 indicated by **.
Next, we tested the significance of individual factors in the BGM combination. Transfections lacking GATA4 or MESP1 yielded a significant loss in cTnT-positive cluster induction (Fig. 5B) comparable to control levels. In contrast, transfections lacking BAF60C yielded 23.3±17.6 cTnT-positive clusters, suggesting that BAF60C was dispensable in our setting. When transfected individually, GATA4 or MESP1 as well as any other individual factor produced only background levels of cTnT-positive clusters. For more detailed analysis, the number of DAPI-positive nuclei per cTnT-positive clusters was carefully counted to calculate the average number of cTnT-positive cells per well. Given the variability of the number of clusters per well (Fig. 5B) and particularly the heterogeneity in cluster sizes (Fig. 4D), a high standard deviation was found (Fig. 5C), as expected. On average, hCBiPS2 formed 464.9±690.4 cTnT-positive cells per well in response to BGM transfection and 219.0±171.7 for GM, respectively (Fig. 5C).
FIG. 5.

Reduction of BGM to GM, but no other TF double combination or single factors, induced formation of clusters expressing cTnT and other cardiac sarcomere markers. (A) BGM-transfected hCBiPS2 cells, fixed, and stained on day 14 expressed structural cardiac markers, including Troponin T (cTnT), α-myosin heavy chain (αMHC), sarcomeric α-Actinin, and NKX2.5. Although no beating was observed before cell fixation, distinct cross-striation typical of sarcomeric structures were found, as depicted in higher-magnification insets for cTnT and α-Actinin stainings, respectively. (B–D) The combination BGM was further dissected by testing respective double combinations and single factors for appearance of cTnT-positive cell clusters per 12-well on d14 post-transfection. (B) Quantification revealed that only the reduction to GM yielded considerable numbers of cTnT-positive cell clusters (n=7 for BGM and control, and n=3 for all other combinations or single factors). (C) Average number of cTnT-positive cells per well, which was determined by counting DAPI-positive nuclei in respective clusters. (D) Exemplary cTnT and αMHC stainings of GM-induced clusters on day 14 post-transfection revealed distinct cross-striation as in BGM cells. P<0.05 indicated by * and P<0.01 indicated by **.
To substantiate the formation of cells recapitulating CM characteristics in response to BGM or GM transfection, immunocytology was extended to anti-α-myosin heavy chain (αMHC)- and α-Actinin-specific staining, alone or in combination with anti-NKX2.5-specific antibodies (Fig. 5A, D). Although neither BGM- nor GM-transfected cells started beating, immunocytological analysis revealed unequivocal cross-striation of cells in respective clusters (Fig. 5C), further supporting the formation of sarcomeric structures typical of bona fide CMs.
BGM and GM transfection induced formation of cross-striated cell clusters in 3 additional hPSC lines tested
To further broaden and substantiate our data, we tested the effect of BGM in additional cell lines, that is, hES3 and 2 HSCiPS lines (HSCiPS 1441 and 1285) recently established by us (unpublished). In contrast to a zero-background found for all 3 lines in transfection controls in our assay, a considerable number of cTnT- and α-Actinin-positive cell clusters, also exhibiting cross striation, were discovered after TF treatment (Fig. 6). Plasmid-encoded BGM transfection yielded 20.0±18.3 clusters in hES3 cells (Fig. 6A), 13.75±13.1 clusters in HSCiPS 1441 (Fig. 6B), and 4.5±2.1 clusters in HSCiPS 1285 (Fig. 6C). Similar numbers were obtained for GM-transfected samples, that is, 18.2±19.9 clusters in hES3, 14.2±10.9 clusters in HSCiPS 1441, and 5.5±6.4 clusters in HSCiPS 1285, again suggesting dispensability of BAF60c; by manual counting of DAPI-positive nuclei per cluster, the average number of cTnT-positive cells per well was also determined as presented in Fig. 6A–C, respectively. Despite the observation of pronounced cross-striation by antibody staining, no beating activity was observed by extensive light microscopy screening of cell layers before fixation, even after prolonged culture for up to 28 days.
FIG. 6.

(B)GM transfection also induced cTnT-positive clusters in additional human pluripotent stem cell lines. (A–C) Examples of cTnT- and α-Actinin-positive cell clusters after simultaneous transfection of hES3, hematopoietic stem cell-derived iPS (HSCiPS) 1441, and 1285 cells with BGM or GM analyzed on d14 post-transfection. Distinct cross-striations typical of sarcomeric structures were identified (magnified in white insets). Respective cell line-dependent quantification of the number of cTnT-positive clusters and individual cells is also presented (n=5 for hES3, n=4 for HSCiPS 1441, n=2 for HSCiPS 1285).
Observations on the impact of cell density
Within the large number of experimental repeats using hCBiPS2 in our study, an occasional occurrence of excessive cell accumulation, particularly at the rim of respective culture wells, was observed. Immunocytological assessment of these wells revealed the formation of larger amounts of cTnT-/NKX2.5-positive cells indicating CM formation, which were structured in a network-like pattern (Fig. 7). Such observations were made independently of the combination of plasmids transfected into hCBiPS2, but were also found in control transfected cells receiving reporter plasmid constructs only. Notably, on such occasion, the whole experiment was excluded from the analysis.
FIG. 7.
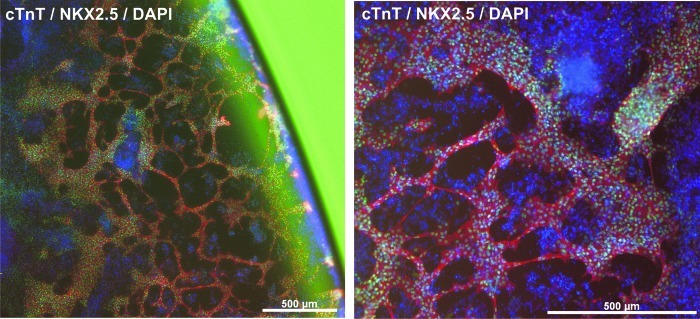
Cell accumulation at the rim of wells sporadically resulted in the formation of cTnT-/NKX2.5-positive cardiomyocyte-like networks in TF- as well as control-transfected hCBiPS2 cells. If this apparently density-dependent phenomenon occurred in any well of an experiment, the whole experiment was discarded. No similar events were observed with hES3 or either of the HSCiPS cell lines tested. cTnT (red), NKX2.5 (green), and DAPI (blue).
Discussion
In this work, we have tested the idea of directing cardiomyogenic differentiation of hiPSCs by transient overexpression of specific TFs. The approach is focused on a subset of factors shown to be most effective in inducing ectopic heart formation during embryogenesis in zebrafish [20] and mice [6], or promoted cardiomyogenic differentiation in vitro in mouse ESCs [11,21] and most recently in hESCs [12]. Moreover, cardiac reprogramming of mouse fibroblasts through overexpression of TFs was achieved in vitro and in vivo [7–10]. However, previous work either relied on TF expression in randomly targeted, stable mouse ESC clones [11,21] or delivered factors by means of lenti- or retroviral vectors [7–10,12]. The applied randomly integrating vector systems such as classical oncoretroviral and lentiviral vectors result in modestly controlled and long-lasting constitutive transgene expression and hold the risk of insertional mutagenesis. Therefore, and to potentially mirror more closely the transitory peak of expression of cardiogenic factors during development, we opted for a transient (nonintegrating) approach with a reduced risk of malignant transformation [22], which should be particularly beneficial for therapeutic applications in humans.
First, we have characterized our transfection system in hESCs and hiPSCs to assess suitability for the envisioned purpose. Although conventional feeder-based cultures not adapted to single-cell passaging were used, our electroporation protocol relying on single-cell dissociation was well tolerated by hPSCs, yielding high cell vitality.
The transgene expression pattern in our system was defined as follows. On the mRNA level, a narrow peak was observed that sharply declined around 24 h post-transfection, as expected for nonreplicating, nonintegrating vectors introduced into proliferative cells. In contrast, fluorescence reporter analysis and anti-TF-specific staining showed robust presence of transgenes on the protein level in a relatively stable 2–4-day window after electroporation, followed by stepwise fading. Quantification by flow cytometry revealed that the average proportion of positive cells in this expression window was >50% for a single reporter and ∼30% of cells coexpressing 2 reporter transgenes encoded on independent plasmids. Importantly, immunofluorescence analysis confirmed that the reporters nicely reflected TF expression encoded on the same plasmid.
Because our transfection system was robust with limited interexperimental variability regarding the transfection efficiency, complete batches of transfected cells were applied in experiments without any further sorting or genetic enrichment. In our monolayer culture, the combination of BAF60C GATA4 and MESP1 (BGM) induced formation of CM clusters coexpressing nuclear NKX2.5 with sarcomeric proteins αMHC, cTnT, or α-Actinin, and positive cells exhibited well-defined cross-striation on day 14 post-transfection, although beating areas were not observed. Notably, single-factor transfections showed no effect in this assay.
Although single cardiac TFs such as MESP1, NKX2.5 [11,21], or GATA4 [23,24] promoted cardiomyogenesis in murine ESCs, to our best knowledge, no equivalent reports exist in the human system. However, Dixon et al. induced a CM-like phenotype from hESCs by transduction of a 4-factor combination, that is, GATA4, TBX5, NKX2.5, and BAF60C (GTNB) [12]. Despite a number of methodological dissimilarities, this study is maybe the most relevant comparison to our data. First, the authors have chosen lentiviral vectors for TF expression. Although viral transduction is generally thought to result in efficient cell labeling, the authors relied on antibiotic-based enrichment (TF-IRES-coupled puromycin resistance transgene) after transduction, apparently to ensure homogeneous levels of TF expression in hESCs. Secondly, Dixon and coworkers have largely relied on the MYH6 promoter–mRFP reporter hESC lines to assess cardiomyogenesis. Although reporter lines provide obvious advantages in screenings, in our study, we have deliberately focused on a more cumbersome assessment by microscopic quantification of CM formation following immunocytology specific to a panel of relevant endogenous markers. The effort is justified by a more reliable phenotype assessment and avoids overinterpretation of data, which might primarily reflect transcriptional activation of an artificial promoter–reporter transgene independent of the formation of functional CMs. This assumption is highlighted in a recent study by Protze et al., who found a rather incomplete cardiac phenotype in response to cardiac TF transduction in mouse fibroblasts, despite unambiguous activation of an αMHC-GFP reporter transgene [10]. Cross-comparing the efficiency documented in human PSCs, we noted in our approach an average formation of ∼30 cTnT/NKX2.5 double-positive CM clusters per well of a 12-well dish (ie, 3.6-cm2 surface area per well) on day 14 after BGM electroporation. Using a 6-well dish format (ie, 9.5-cm2 surface area per well), Dixon et al. reported formation of ∼40 MYH6-mRFP-positive cell clusters per well on day 14 post-transduction; values were elevated to ∼60 MYH6-mRFP clusters on days 16–28. Calculating CM cluster numbers per cm2, the GTNB-study yielded 4.2 clusters/cm2 on day 14, which corresponds to about 7.9 clusters/cm2 in our experiments. Since the number of cells per cluster seems to be comparable in both studies (when judging figures presented by Dixon et al. versus our fluorescence microscopy data in Figs. 4D, 5B, and 6), this comparison suggests at least an equivalent induction of CM clusters in our experiments.
Quantification of hESCs after transduction with GTNB revealed ∼1% MYH6-mRFP-positive cells on day 14 and ∼4% at days 16–28 as assessed by flow cytometry [12]. Applying flow cytometry of anti-αMHC-specific staining on day 14 in our study revealed equivalent results (data not shown). However, at this low level of positivity, flow cytometry is an error-prone assay and microscopy the method of choice for reliable, semiquantitative assessment. Thus, by comprehensive microscopy, we found an average induction of ∼465 cTnT-positive cells per well in BGM-transfected hCBiPS2, whereby up to 1150 positive cells per well (ie, 319.4 cells/cm2) were found in individual experiments, indicating the high degree of interexperimental variability in this type of assay.
In EB-based differentiation protocols, we have previously observed formation of contractile and electrophysiologically functional (although immature) CMs from hCBiPS2 and hES3 cells [14,25] and our novel HSCiPS lines as well (unpublished), demonstrating that the applied cell lines, per se, do have the respective potential. In contrast, in the present study, we have not detected unequivocal evidence of contractility. A number of reasons might account for this finding. First, although cell layers were systematically analyzed by light microscopy before fixation, we might have simply missed to detect low levels of twitching activity in the spot-like distributed clusters; with this respect, the lack of CM-specific reporter gene expression is a limitation in our study. Secondly, cells that stained positive for cTnT (or α-Actinin, αMHC, and often-showed overlapping NKX2.5 staining in the nucleus as well) might have been too immature to initiate contractions, despite the pronounced formation of cross-striations. However, even prolonged maintenance of cell layers for up to 28 days in culture did not allow detection of contractile foci. Alternatively, or in addition, TF expression might have induced an incomplete CM phenotype lacking essential properties to induce spontaneous beating. Notably, the absence of contracting cells after TF induction is in line with other studies. Critical analysis by Protze et al. [10] revealed that TF-directed reprogramming of mouse fibroblasts only led to spontaneous beating when heart-derived cardiac fibroblasts were analyzed, but the frequency at which beating cells were detected was not above the level of coisolated, contaminating CMs. In contrast, although TF induction in mouse tail-derived fibroblasts resulted in easily traceable Myh6:tdTomato-expressing CM-like cells that expressed cTnT-specific and other CM-specific markers, no beating was detected in these cells. Even more recently, Islas and coworkers [26] demonstrated transdifferentiation of human dermal fibroblasts into cardiac progenitors displaying contraction activity by collective overexpression of the factors ETS2 and MESP1. Notably, however, beating cells were only observed when cultures were cosupplemented with growth factors Activin A and BMP2 in addition to TF expression, suggesting that this was mandatory to induce a more functional CM phenotype.
Interestingly, we also found MESP1 to be indispensible for CM induction, while previous studies [6,7,12] always excluded MESP1 from further analysis because of low numbers of αMHC-GFP reporter-positive cells observed in the presence of this factor. MESP1 is transiently expressed in vivo in the primitive streak (PS) or in PS-like cells in vitro [27,28]. By regulating mesoderm formation, MESP1 precedes other cardiac TFs that act upon the mesoderm to form cardiac precursors. There are conflicting reports about the necessity of MESP1 during mouse ESC cardiomyogenesis. As pointed out by Bondue et al., only transient MESP1 activity promoted CM formation [29]. The transient transgene expression pattern that specifies our approach might subsequently be more appropriate for MESP1 to exert its lineage-inducing potential. The strong, but narrow, peak of MESP1 expression in our experiments might have a mesoderm-inducing effect that GATA4 and BAF60C can act upon. However, mouse ESC clones constitutively expressing MESP1 have shown an increased CM number compared to wild-type cells in an EB-based differentiation assay [21]. Cooperation of GATA4 and BAF60C in cardiac development was shown in several studies. BAF60C is the cardiac-specific subunit of a Swi/snf-like BAF chromatin remodeling complex, and when overexpressed in culture allows interaction of GATA4 (and also TBX5 and NKX2.5) with ATPase Brg1, thus exposing target genes for transcription [17]. Moreover, BAF60C potentiates GATA4 activity on an NKX2.5 enhancer [6], which might explain why NKX2.5 was dispensable in our transfection cocktail. GATA4 is also regulating the development of endoderm, which contributes to cardiomyogenesis by paracrine signals [30]. Furthermore, combining BAF60C and GATA4 has been shown to induce a pattern of cardiac gene expression in mouse embryos [6]. However, while the 2-factor combination of GATA4 and MESP1 (GM) showed traceable effects on CM formation in our assay, neither BAF60C-GATA4 nor BAF60C-MESP1 combinations showed this effect. BAF60C was also omitted in studies for cardiac reprogramming of fibroblasts [7–10], indicating a nonessential role of this factor.
Although a number of previous reports [6–9,12], including the recent study in hESCs [12], included TBX5 as a key player in respective TF cocktails, we could not observe prominent cardiomyogenesis in any tested combination containing this factor. From TBX5 KO mice, it is known that affected null-embryos do form a beating linear heart tube [31]. This suggests that TBX5 might not be essential for early cardiac induction, but acts at later stages of chamber morphogenesis and development of the conduction system [32–34].
In addition to the combination of factors and the timing of transgene expression discussed above, another critical and hard-to-control aspect is the gene dose. Transfection as well as transduction yields heterogeneous cell populations expressing more or less transgenes per cell. While too little of TFs might not have any impact on cell differentiation, too high doses might have inhibitory effects. Regulatory circuits of many genes include negative feedback loops that might be sensitive to the amounts of transgenes present in a particular cell. Our as well as other studies [6,7,12] are based on cell batches rather than stable single-cell clones, which might have more defined levels of TF expression. Our initial attempts to generate stable, expandable hiPSC lines expressing constitutive, considerable levels of BGM or other factor combinations failed (data not shown), although we have recently established a straight-forward methodology for successful generation of stable, double- or triple-transgenic hiPSC and hESC lines [35]. The reason for this is not understood, but relative high expression levels of lineage determining TFs might be incompatible with the pluripotent state in hPSCs. Hence, in batch transfection systems applied in most studies, the exact TF composition as well as the most successful TF doses in those pluripotent cells that developed into CMs remains unknown. This aspect, however, probably adds to the low overall efficiency in dominantly directing pluripotent cells by defined TFs into a lineage of interest, that is, CMs. As outlined above, this was at the level of ∼30 CM-clusters in our study representing a total number of few hundred to thousand CMs within about 0.7×10⁶ total cells per well (average cell number yielded on day 14; Fig. 4C), even in the most successful BGM approach.
Dixon and coworkers have published a content of up to 45% of cardiac Tropnin I (cTnI)/α-Actinin double-positive cells after viral GTNB delivery [12]). Notably, this was only achieved upon adding the chemotherapeutic agent Ara-C in a defined time pattern in transduced cultures. However, the role of this chemostatic agent in the protocol is not fully understood, and the described enrichment level provides no information about the absolute cell yield and the phenotype of the cTnI-/α-Actinin-positive cell population quantified by flow cytometry in that study.
Another critical aspect touched in the GTNB study is the role of the cell density, which strongly impacted on cardiac differentiation [12]. With this respect, we noted the occasional occurrence of excessive cell accumulations, particularly at the rim of respective culture wells, in the present study. Such observations were made independently of transgene expression and also found in control transfected cells receiving reporter plasmids only. These observations provide another example of the sensitivity of such experimental systems to cell density-depending effects, which must be critically considered before drawing conclusions.
In summary, our study is the first to present a strategy for forward programming from hPSCs induced by the TF combination BAF60C, GATA4, and MESP1, and even further reduction to GATA4 and MESP1 only, without permanent genetic manipulation of cells. The transient transfection approach with conventional expression plasmids eliminates the risk of insertional mutagenesis and provides a straightforward platform for further optimizations and translation to other lineages as well. Despite the low overall cell yield of CM-like cells, the system is valuable to decipher the inductive as well as inhibitory activity of TFs, particularly in the well-defined expression window 2–4 days post-transgene introduction.
Supplementary Material
Acknowledgment
We are grateful to Andreas Kispert for providing the TBX5 cDNA clone and valuable experimental advice, Denise Hilfiker for very helpful practical suggestions, and Maria Ensthaler for providing excellent technical assistance (all from Hannover Medical School, Hannover, Germany). We thank Vita34 (Leipzig, Germany) for providing HSCs for the generation of the respective cell lines.
The work was supported by the Cluster of Excellence REBIRTH (DFG EXC62/1), by the German Ministry for Education and Science (BMBF, grant agreements no. 01GN0958 and 315493), the initiative BIOSCENT, European Union, European Atomic Energy Community, Seventh Framework Programme ([FP7/2007–2013] [FP7/2007–2011]), under grant agreement no. [214539], the CORTISS foundation (Hannover, Germany) provided a grant to K. Schwanke, and the Hannover Biomedical Research School (Hannover, Germany) provided a grant to S. Hartung. R. David and W-M. Franz are supported by the BMBF [01GN0960 to R.D. and W-M.F.] and the Deutsche Forschungsgemeinschaft [DA 1296/2-1 to R.D. and FR 705/14-2 to W-M.F.]. W-M. Franz is PI of the Munich Heart Alliance.
Author Disclosure Statement
No competing financial interests exist.
References
- 1.Schaaf S. Shibamiya A. Mewe M. Eder A. Stohr A. Hirt MN. Rau T. Zimmermann WH. Conradi L. Eschenhagen T. Hansen A. Human engineered heart tissue as a versatile tool in basic research and preclinical toxicology. PLoS One. 2011;6:e26397. doi: 10.1371/journal.pone.0026397. [DOI] [PMC free article] [PubMed] [Google Scholar]
- 2.Malan D. Friedrichs S. Fleischmann BK. Sasse P. Cardiomyocytes obtained from induced pluripotent stem cells with long-QT syndrome 3 recapitulate typical disease-specific features in vitro. Circ Res. 2011;109:841–847. doi: 10.1161/CIRCRESAHA.111.243139. [DOI] [PubMed] [Google Scholar]
- 3.Itzhaki I. Maizels L. Huber I. Zwi-Dantsis L. Caspi O. Winterstern A. Feldman O. Gepstein A. Arbel G, et al. Modelling the long QT syndrome with induced pluripotent stem cells. Nature. 2011;471:225–229. doi: 10.1038/nature09747. [DOI] [PubMed] [Google Scholar]
- 4.Moretti A. Bellin M. Welling A. Jung CB. Lam JT. Bott-Flugel L. Dorn T. Goedel A. Hohnke C, et al. Patient-specific induced pluripotent stem-cell models for long-QT syndrome. N Engl J Med. 2010;363:1397–1409. doi: 10.1056/NEJMoa0908679. [DOI] [PubMed] [Google Scholar]
- 5.Burridge PW. Keller G. Gold JD. Wu JC. Production of de novo cardiomyocytes: human pluripotent stem cell differentiation and direct reprogramming. Cell Stem Cell. 2012;10:16–28. doi: 10.1016/j.stem.2011.12.013. [DOI] [PMC free article] [PubMed] [Google Scholar]
- 6.Takeuchi JK. Bruneau BG. Directed transdifferentiation of mouse mesoderm to heart tissue by defined factors. Nature. 2009;459:708–711. doi: 10.1038/nature08039. [DOI] [PMC free article] [PubMed] [Google Scholar]
- 7.Ieda M. Fu JD. Delgado-Olguin P. Vedantham V. Hayashi Y. Bruneau BG. Srivastava D. Direct reprogramming of fibroblasts into functional cardiomyocytes by defined factors. Cell. 2010;142:375–386. doi: 10.1016/j.cell.2010.07.002. [DOI] [PMC free article] [PubMed] [Google Scholar]
- 8.Qian L. Huang Y. Spencer CI. Foley A. Vedantham V. Liu L. Conway SJ. Fu JD. Srivastava D. In vivo reprogramming of murine cardiac fibroblasts into induced cardiomyocytes. Nature. 2012;485:593–598. doi: 10.1038/nature11044. [DOI] [PMC free article] [PubMed] [Google Scholar]
- 9.Song K. Nam YJ. Luo X. Qi X. Tan W. Huang GN. Acharya A. Smith CL. Tallquist MD, et al. Heart repair by reprogramming non-myocytes with cardiac transcription factors. Nature. 2012;485:599–604. doi: 10.1038/nature11139. [DOI] [PMC free article] [PubMed] [Google Scholar]
- 10.Protze S. Khattak S. Poulet C. Lindemann D. Tanaka EM. Ravens U. A new approach to transcription factor screening for reprogramming of fibroblasts to cardiomyocyte-like cells. J Mol Cell Cardiol. 2012;53:323–332. doi: 10.1016/j.yjmcc.2012.04.010. [DOI] [PubMed] [Google Scholar]
- 11.David R. Stieber J. Fischer E. Brunner S. Brenner C. Pfeiler S. Schwarz F. Franz WM. Forward programming of pluripotent stem cells towards distinct cardiovascular cell types. Cardiovasc Res. 2009;84:263–272. doi: 10.1093/cvr/cvp211. [DOI] [PubMed] [Google Scholar]
- 12.Dixon JE. Dick E. Rajamohan D. Shakesheff KM. Denning C. Directed differentiation of human embryonic stem cells to interrogate the cardiac gene regulatory network. Mol Ther. 2011;19:1695–1703. doi: 10.1038/mt.2011.125. [DOI] [PMC free article] [PubMed] [Google Scholar]
- 13.Stocking C. Bergholz U. Friel J. Klingler K. Wagener T. Starke C. Kitamura T. Miyajima A. Ostertag W. Distinct classes of factor-independent mutants can be isolated after retroviral mutagenesis of a human myeloid stem cell line. Growth Factors. 1993;8:197–209. doi: 10.3109/08977199309011023. [DOI] [PubMed] [Google Scholar]
- 14.Haase A. Olmer R. Schwanke K. Wunderlich S. Merkert S. Hess C. Zweigerdt R. Gruh I. Meyer J, et al. Generation of induced pluripotent stem cells from human cord blood. Cell Stem Cell. 2009;5:434–441. doi: 10.1016/j.stem.2009.08.021. [DOI] [PubMed] [Google Scholar]
- 15.Chen R. John J. Lavrentieva A. Müller S. Tomala M. Zhao Y. Zweigerdt R. Beutel S. Hitzmann B, et al. Cytokine production using membrane adsorbers: human basic fibroblast growth factor produced by Escherichia coli. Eng Life Sci. 2012;12:29–38. [Google Scholar]
- 16.Palecek J. Zweigerdt R. Olmer R. Martin U. Kirschning A. Drager G. A practical synthesis of Rho-Kinase inhibitor Y-27632 and fluoro derivatives and their evaluation in human pluripotent stem cells. Org Biomol Chem. 2011;9:5503–5510. doi: 10.1039/c1ob05332a. [DOI] [PubMed] [Google Scholar]
- 17.Lickert H. Takeuchi JK. Von Both I. Walls JR. McAuliffe F. Adamson SL. Henkelman RM. Wrana JL. Rossant J. Bruneau BG. Baf60c is essential for function of BAF chromatin remodelling complexes in heart development. Nature. 2004;432:107–112. doi: 10.1038/nature03071. [DOI] [PubMed] [Google Scholar]
- 18.Graichen R. Xu X. Braam SR. Balakrishnan T. Norfiza S. Sieh S. Soo SY. Tham SC. Mummery C, et al. Enhanced cardiomyogenesis of human embryonic stem cells by a small molecular inhibitor of p38 MAPK. Differentiation. 2008;76:357–370. doi: 10.1111/j.1432-0436.2007.00236.x. [DOI] [PubMed] [Google Scholar]
- 19.Xu XQ. Graichen R. Soo SY. Balakrishnan T. Rahmat SN. Sieh S. Tham SC. Freund C. Moore J, et al. Chemically defined medium supporting cardiomyocyte differentiation of human embryonic stem cells. Differentiation. 2008;76:958–970. doi: 10.1111/j.1432-0436.2008.00284.x. [DOI] [PubMed] [Google Scholar]
- 20.Reiter JF. Alexander J. Rodaway A. Yelon D. Patient R. Holder N. Stainier DY. Gata5 is required for the development of the heart and endoderm in zebrafish. Genes Dev. 1999;13:2983–2995. doi: 10.1101/gad.13.22.2983. [DOI] [PMC free article] [PubMed] [Google Scholar]
- 21.David R. Brenner C. Stieber J. Schwarz F. Brunner S. Vollmer M. Mentele E. Muller-Hocker J. Kitajima S, et al. MesP1 drives vertebrate cardiovascular differentiation through Dkk-1-mediated blockade of Wnt-signalling. Nat Cell Biol. 2008;10:338–345. doi: 10.1038/ncb1696. [DOI] [PubMed] [Google Scholar]
- 22.Williams DA. Baum C. Medicine. Gene therapy—new challenges ahead. Science. 2003;302:400–401. doi: 10.1126/science.1091258. [DOI] [PubMed] [Google Scholar]
- 23.Grepin C. Nemer G. Nemer M. Enhanced cardiogenesis in embryonic stem cells overexpressing the GATA-4 transcription factor. Development. 1997;124:2387–2395. doi: 10.1242/dev.124.12.2387. [DOI] [PubMed] [Google Scholar]
- 24.Hu DL. Chen FK. Liu YQ. Sheng YH. Yang R. Kong XQ. Cao KJ. Gu HT. Qian LM. GATA-4 promotes the differentiation of P19 cells into cardiac myocytes. Int J Mol Med. 2011;26:365–372. [PubMed] [Google Scholar]
- 25.Xu XQ. Soo SY. Sun W. Zweigerdt R. Global expression profile of highly enriched cardiomyocytes derived from human embryonic stem cells. Stem Cells. 2009;27:2163–2174. doi: 10.1002/stem.166. [DOI] [PubMed] [Google Scholar]
- 26.Islas JF. Liu Y. Weng KC. Robertson MJ. Zhang S. Prejusa A. Harger J. Tikhomirova D. Chopra M, et al. Transcription factors ETS2 and MESP1 transdifferentiate human dermal fibroblasts into cardiac progenitors. Proc Natl Acad Sci U S A. 2012;109:13016–13021. doi: 10.1073/pnas.1120299109. [DOI] [PMC free article] [PubMed] [Google Scholar]
- 27.Saga Y. Hata N. Kobayashi S. Magnuson T. Seldin MF. Taketo MM. MesP1: a novel basic helix-loop-helix protein expressed in the nascent mesodermal cells during mouse gastrulation. Development. 1996;122:2769–2778. doi: 10.1242/dev.122.9.2769. [DOI] [PubMed] [Google Scholar]
- 28.Saga Y. Miyagawa-Tomita S. Takagi A. Kitajima S. Miyazaki J. Inoue T. MesP1 is expressed in the heart precursor cells and required for the formation of a single heart tube. Development. 1999;126:3437–3447. doi: 10.1242/dev.126.15.3437. [DOI] [PubMed] [Google Scholar]
- 29.Bondue A. Lapouge G. Paulissen C. Semeraro C. Iacovino M. Kyba M. Blanpain C. Mesp1 acts as a master regulator of multipotent cardiovascular progenitor specification. Cell Stem Cell. 2008;3:69–84. doi: 10.1016/j.stem.2008.06.009. [DOI] [PubMed] [Google Scholar]
- 30.Holtzinger A. Rosenfeld GE. Evans T. Gata4 directs development of cardiac-inducing endoderm from ES cells. Dev Biol. 2010;337:63–73. doi: 10.1016/j.ydbio.2009.10.003. [DOI] [PMC free article] [PubMed] [Google Scholar]
- 31.Bruneau BG. Transcriptional regulation of vertebrate cardiac morphogenesis. Circ Res. 2002;90:509–519. doi: 10.1161/01.res.0000013072.51957.b7. [DOI] [PubMed] [Google Scholar]
- 32.Bruneau BG. Nemer G. Schmitt JP. Charron F. Robitaille L. Caron S. Conner DA. Gessler M. Nemer M. Seidman CE. Seidman JG. A murine model of Holt-Oram syndrome defines roles of the T-box transcription factor Tbx5 in cardiogenesis and disease. Cell. 2001;106:709–721. doi: 10.1016/s0092-8674(01)00493-7. [DOI] [PubMed] [Google Scholar]
- 33.Plageman TF., Jr. Yutzey KE. T-box genes and heart development: putting the “T” in heart. Dev Dyn. 2005;232:11–20. doi: 10.1002/dvdy.20201. [DOI] [PubMed] [Google Scholar]
- 34.Greulich F. Rudat C. Kispert A. Mechanisms of T-box gene function in the developing heart. Cardiovasc Res. 2011;91:212–222. doi: 10.1093/cvr/cvr112. [DOI] [PubMed] [Google Scholar]
- 35.Templin C. Zweigerdt R. Schwanke K. Olmer R. Ghadri JR. Emmert MY. Müller E. Küest SM. Cohrs S, et al. Transplantation and tracking of human induced pluripotent stem cells in a pig model of myocardial infarction: assessment of cell survival, engraftment and distribution by Hybrid SPECT-CT imaging of sodium iodide symporter trangene expression. Circulation. 2012;124:430–439. doi: 10.1161/CIRCULATIONAHA.111.087684. [DOI] [PubMed] [Google Scholar]
Associated Data
This section collects any data citations, data availability statements, or supplementary materials included in this article.