

Abstract
The mechanisms by which mesenchymal stromal cells (MSCs) induce immunomodulation are still poorly understood. In the current work, we show by a combination of polymerase chain reaction (PCR) array, flow cytometry, and multiplex cytokine data analysis that during the inhibition of an alloantigen-driven CD4+ T-cell response, MSCs induce a fraction of CD4+ T-cells to coexpress interferon-γ (IFNγ) and interleukin-10 (IL-10). This CD4+ IFNγ+ IL-10+ cell population shares properties with recently described T-cells originating from switched Th1 cells that start producing IL-10 and acquire a regulatory function. Here we report that IL-10-producing Th1 cells accumulated with time during T-cell stimulation in the presence of MSCs. Moreover, MSCs caused stimulated T-cells to downregulate the IFNγ receptor (IFNγR) without affecting IL-10 receptor expression. Further, the inhibitory effect of MSCs could be reversed by an anti-IFNγR-blocking antibody, indicating that IFNγ is one of the major players in MSC-induced T-cell suppression. Stimulated (and, to a lesser extent, resting) CD4+ T-cells treated with MSCs were able to inhibit the proliferation of autologous CD4+ T-cells, demonstrating their acquired regulatory properties. Altogether, our results suggest that the generation of IL-10-producing Th1 cells is one of the mechanisms by which MSCs can downmodulate an immune response.
Introduction
Due to their multipotent differentiation capacity and immunomodulatory properties, mesenchymal stromal cells (MSCs) have been extensively studied in recent years as a possible therapeutic tool in regenerative medicine and as a promising therapy for immunological disorders [1]. Although the mechanism of action of MSCs is not well understood, they have already entered into clinical trials and, given their low immunogenicity, few if any adverse events have emerged to date [2–6].
MSCs were first isolated from bone marrow (BM), but it has now been shown that they can be derived from different adult tissues (ie, adipose tissue and dental pulp) as well as from cord blood (CB). Previous studies have shown that MSCs can interact with almost all hematopoietic cells and act as a downmodulator of immune cell activation [7]. It has been proposed that MSCs can inhibit T-cell proliferation regardless of the nature of the stimulus (ie, alloantigens, mitogens, and CD3 engagement) [8,9], or the human leukocyte antigen (HLA) match [10]. Different mechanisms have been proposed as mediating this effect that involve both direct cell–cell contact and/or soluble factors (ie, interleukin-6 [IL-6], HLA-G, idoleamine 2,3 dioxygenase [IDO], and transforming growth factor [TGF]) [11]. It has also been reported that MSCs could modulate the immune response by expanding regulatory T-cells (Tregs) defined as being CD25+, FoxP3+, and CD4+ [12,13]. Comparing data from studies on MSCs is further complicated due to differences in experimental settings, as well as the source and preparation of MSCs that have been reported [7,14].
In the current work, we investigated the immunomodulatory properties of CB-derived MSCs focusing our attention on the effects on T-cell activation and proliferation. We took advantage of an immortalized CB-MSC line that we generated [15], and that we have shown to be effective in inhibiting xenogeneic graft-versus-host disease (GvHD) induced by human peripheral blood mononuclear cells (PBMCs) in a mouse model [15]. This CB-MSC line is also a very useful tool in terms of limiting experimental variability while increasing reproducibility. We observed that MSCs could effectively inhibit the immune response triggered by allogeneic stimulation in vitro. Moreover, we propose that the induction of IL-10-producing Th1 cells is an important mechanism through which MSCs are able to promote immunosuppression. These IL-10-producing Th1 cells share properties similar to a recently described T-cell subset that was found to occur in humans upon repetitive antigen stimulation as a result of a phenotypical and functional switch of Th1 cell clones. These switched cells coexpress interleukin-10 (IL-10) and interferon-γ (IFNγ) and exert an important regulatory role in the resolution of the Th1-driven immune response [16–18].
Materials and Methods
MSC isolation and culture
CB samples were obtained from the CHU Sainte-Justine Research Cord Blood Bank after approval by the ethics committee. Human CB-MSCs were obtained from CB mononuclear cells, and immortalized as previously described [15]. This cell line, which retains both the phenotype and differentiation capacity typical of freshly isolated MSCs, can be safely used for in vivo injection due to their characteristic cell-contact-induced growth arrest. MSCs were cultured in an α-minimum essential medium (α-MEM) medium supplemented with 10% fetal bovine serum (FBS), 100 U/mL penicillin, and 100 μg/mL streptomycin, all purchased from Invitrogen (Burlington, ON). In all in vitro experiments, MSCs were irradiated (54 Gy) immediately before starting the coculture with effector cells (ratio of effector cells to MSCs=10:1). In a preliminary experiment, nonirradiated MSCs demonstrated the same ability as irradiated MSCs to inhibit T-cell proliferation in a mixed lymphocyte reaction. We used irradiated MSCs to avoid their expansion, which would have altered the MSC-to-T-cell ratio, and the composition of the culture medium by depletion of nutrients and consequently could have resulted in the inhibition of T-cell proliferation independent of their immunomodulatory properties.
Human blood samples
Peripheral blood samples were collected from consenting healthy donors according to guidelines established by the CHU Sainte-Justine ethics committee. PBMCs were isolated by Ficoll–Hypaque separation and used either immediately or stored in liquid nitrogen for use at a later date.
Dendritic cell differentiation and maturation
To differentiate human immature dendritic cells (iDCs) from monocytes, CD14+ cells were first isolated with magnetic beads by positive selection (Miltenyi Biotech, Auburn, CA) and then plated in 6-well plates (106 cells/well). Cells were cultured for 5 days in the presence of human recombinant granulocyte–macrophage colony-stimulating factor (GM-CSF, 50 ng/mL; R&D Systems, Minneapolis, MN) and IL-4 (10 ng/mL; eBioscience, San Diego, CA). Mature DCs (mDCs) were obtained by stimulation of iDCs with lipopolysaccharides (1 μg/mL; Sigma, St. Louis, MO) for 2 additional days.
T-cell stimulation and proliferation analysis
Mixed lymphocyte reaction
About 2×10⁵ PBMCs were stained with 5-(and 6)-carboxyfluorescein diacetate succinimidyl ester (CFSE; Invitrogen) and stimulated with 2×10⁵ allogeneic irradiated (54 Gy) PBMCs, obtained by pooling PBMCs from 3 different donors, and cultured for 6 days in 96-well plates. When indicated, freshly purified CD4+ T-cells were isolated from total PBMCs by negative selection (using the pan T-cell isolation kit II, followed by CD8 depletion, using CD8 microbeads; both kits from Miltenyi Biotech) and used as responders for allogeneic stimulation. In this latter experiment, allogeneic mDCs were irradiated (54 Gy) and used to stimulate T-cells for 6 days using a 1:40 DC-to-T-cell ratio.
CFSE staining
Cells were resuspended in PBS and stained with CFSE (final concentration 0.625 μM) for 7 min at room temperature. CFSE incorporation was blocked by the addition of 1 mL cold FBS and incubated on ice for 1 min followed by 2 washes in a complete culture medium (Roswell Park Memorial Institute medium (RPMI), 10% FBS, 100 U/mL penicillin/streptomycin, and 0.1 mM glutamine).
Flow cytometry
The phenotype of monocytes, iDCs, and mDCs was assessed by flow cytometry using the following monoclonal antibodies: anti-CD14-FITC, CD1a-APC, CD80-PE, CD83-PE, CD86-PE, and HLA-DR-FITC (all from BD Biosciences, Mississauga, ON). iDCs and mDCs are defined as CD14−, CD1a+, CD80low, CD83−, CD86low, HLA-DR+, and CD14−, CD1a+, CD80high, CD83+, CD86high, HLA-DRhigh, respectively.
To test the expression of the activation markers on CD4+ T-cells, we performed staining with the following monoclonal antibodies: anti-HLA-DR-FITC, anti-CD25-PE, and anti-CD69-PerCp-Cy5.5. Tregs were identified as cells expressing the markers CD4-PE-Cy7, CD25-PE, and FoxP3-APC, but negative for CD127-FITC. All antibodies were from BD Biosciences, except for anti-CD69-PerCp-Cy5.5, which was from BioLegend (San Diego, CA). For FoxP3 staining, cells were fixed and permeabilized with a FoxP3 staining kit from eBiosciences according to the manufacturer's instructions. For double intracellular staining of IFNγ and IL-10, cells were treated for 10–12 h with the GolgiSTOP solution (BD Biosciences) according to manufacturer's instructions, either without any further restimulation or upon T-cell isolation and restimulation with allogeneic mDCs (derived from the same donor as during the first round of stimulation) for 24, 48, and 72 h before harvesting. After surface staining, cells were fixed, permeabilized (Cytofix Cytoperm Kit; BD Biosciences), and stained with anti-IFNγ-PE and anti-IL-10-APC (BD Biosciences). For the detection of the IFNγR and IL-10 receptor (IL-10R), antibodies from BioLegend were used. The IL-10R was detected by indirect immunofluorescence using a purified rat anti-human IL-10R antibody and a goat anti-rat biotinylated secondary antibody (BioLegend) and streptavidin FITC. Fluorescence activated cell sorter (FACS) analysis was performed on a BD Biosciences FACSAria or LSRFortessa instrument, and data were analyzed using DIVA software.
Quantitative real-time polymerase chain reaction
Gene expression profiling of CD4+ T-cells, stimulated with allogeneic mDCs (with a CD4+ T-cell-to-mDC ratio of 40:1) for 6 days in the presence and absence of MSCs (with a CD4+ T-cell-to-MSC ratio of 10:1), was investigated using a Human Th1-Th2-Th3 RT2 Profiler polymerase chain reaction (PCR) Array (Qiagen, Inc., Toronto, ON). Cells obtained from 3 healthy donors were tested. Analysis was conducted using the online analysis tool provided by Qiagen. The ribosomal protein, RPL13A, was used to normalize data across experiments, since its amplification profile was the most stable across the arrays.
Cytokine quantification
Supernatants were collected on day 6 from cultures of CD4+ T-cells stimulated with allogeneic mDCs, in the presence and absence of MSCs, without any further restimulation and analyzed using the Bio-Plex Pro Human Cytokine 17-plex assay (Bio-Rad Laboratories, Hercules, CA). In a different experiment, T-cells were isolated after 6 days of culture in the presence of allogeneic mDCs and MSCs, and the supernatant was collected after 24, 48, and 72 h and analyzed using the Bio-Plex Pro Human Cytokine 8-plex assay (Bio-Rad Laboratories). The experiments were conducted according to the manufacturer's recommendations, and results were analyzed on a CS 1000 Autoplex Analyzer (Perkin Elmer, Inc., Waltham, MA).
In vitro T-cell suppression experiments
The presence of immune suppressor cells in the responder T-cell pool stimulated or not in the presence of MSCs was evaluated using an in vitro suppression assay. In brief, 2×10⁵ freshly isolated CD4+ T-cells were stimulated or not for 6 days with 5×10³ allogeneic mDCs in the presence and absence of MSCs (2×10⁴), in 96-well round-bottom plates. On day 6, both supernatants and cells were collected separately and used to suppress freshly stimulated CD4+ T-cells (same donor for both responder and target cells). In the case of cell transfer, CD4+ T-cells from the first culture were counted and mixed 1:1 with responder CD4+ T-cells from the second culture. MSCs were not transferred to the second culture. For this reason, when MSCs were present in the first culture, we depleted them from the harvested population based on their adhesive properties: we harvested the cells and transferred them into a new well until there were no more adherent cells. Moreover, we verified the absence of MSCs by visual analysis during cell counting. On day 3, [3H]-thymidine was added to the wells and incubated for 24 h, after which cells were harvested, and [3H]-thymidine uptake was measured using a β-counter.
IL-10R- and IFNγR-blocking experiments
Freshly purified CD4+ T-cells were stimulated with allogeneic mDCs as described previously, in the presence and absence of MSCs. Anti-IL-10R- (clone 3F9) and anti-IFNγR- (clone GIR-208) blocking antibodies (20 μg/mL; both from BioLegend) were added daily to the culture medium, and on day 6, cells were harvested, and proliferation was assessed using the CFSE dilution method as described previously. The neutralizing activity of the antibodies was assessed in preliminary experiments (data not shown). The same dose of blocking antibody was used for testing the contribution of IL-10 and IFNγ to the inhibitory effect obtained by transferring CD4+ T-cells from a first (with or without MSCs) to a second stimulation with allogeneic DCs in the absence of MSCs.
Statistical analysis
Results were analyzed using GraphPad Prism version 5.0 (GraphPad Software, Inc., La Jolla, CA) and shown either as single dots or as mean±standard error of the mean (SEM). To compare different treatments, the paired t-test, unpaired t-test, or Mann–Whitney test was used, as specified in each figure legend. Significance was set at p≤0.05. Venn diagrams were created using free software available at http://www.cmbi.ru.nl/cdd/biovenn/
Results
MSCs inhibit CD4+ T-cell stimulation without increasing the percentage of cells expressing the classical Treg markers
We tested the ability of MSCs to inhibit the immune response by coculturing them with total PBMCs stimulated by allogeneic PBMCs. As shown in Fig. 1A, MSCs induced a large decrease in cell proliferation (on average 66% inhibition), while they had no significant effect on resting cells, as expected from their immunoprivileged properties. In addition, MSCs were able to reduce the expression of the activation markers HLA-DR and CD25 (data not shown). Since it has been proposed that MSCs can lead to immunosuppression by inducing Treg differentiation [19–21], we analyzed the percentage of CD4+ CD25+ CD127− FoxP3+ Tregs in the CD4+ T-cell population after stimulation of responder cells with allogeneic PBMCs in the presence and absence of MSCs. We found that MSCs were able to inhibit T-cell proliferation without increasing the percentage of Tregs among the CD4+ T-cell population (Fig. 1B). The same results were obtained when we measured the percentage of Tregs among the purified CD4+ T-cell population stimulated by allogeneic mDCs in presence of MSCs (Supplementary Fig. S1; Supplementary Data are available online at www.liebertpub.com/scd). This suggests that in our experimental setting, Tregs were not the main players involved in the observed inhibitory activity induced by the presence of MSCs. In fact, MSCs significantly reduced the percentage of Tregs among both resting and stimulated CD4+ T-cells (Fig. 1B). Interestingly, we found that among the CD4+ T-cells that neither expressed FoxP3 nor CD25, the percentage of cells expressing CD69 was significantly increased in the presence of MSCs (from 9% to 40% on average; Fig. 1C).
FIG. 1.

Mesenchymal stromal cells (MSCs) inhibit CD4+ T-cell proliferation, but do not induce a classical Treg phenotype. Total peripheral blood mononuclear cells (PBMCs) were tested upon stimulation with allogeneic PBMCs in the presence and absence of MSCs. (A) CD4+ T-cell proliferation, analyzed by CFSE dilution, was inhibited by the presence of MSCs. (B) CD4+ T-cells were also analyzed for the presence of Tregs (CD4+ CD25+ CD127− FoxP3+ cells). (C) CD69 expression was analyzed on CD4+ FoxP3− CD25− cells. n=4. *p=0.05, **p=0.01, and ***p=0.0005 (paired t-test). CFSE, 5-(and 6)-carboxyfluorescein diacetate succinimidyl ester.
MSCs induce an upregulation of immune-related genes in responder cells during allogeneic CD4+ T-cell stimulation, suggesting the presence of IL-10-producing Th1 cells
We investigated, by quantitative real-time PCR (Human Th1-Th2-Th3 RT2 Profiler PCR Array), the expression profiles of resting CD4+ T-cells and allogeneic mDC-stimulated CD4+ T-cells in the presence and absence of MSCs, cultured for 6 days. As shown in Fig. 2A, cluster analysis of the single arrays indicates that the samples tend to divide into 2 groups according to the presence of stimulating cells in the culture. In these 2 groups, the samples where MSCs were present during the allogeneic stimulation clustered together. Only 1 sample out of 12 clustered in an unexpected way, probably due to donor-related variability. When samples were grouped according to the experimental condition, the clustering of the groups (Fig. 2B) showed that the stimulated samples (Group 1) clustered separately from all the others, confirming that the presence of mDCs in the culture altered the expression profile of the responder cells. In contrast, CD4+ T-cells stimulated by mDCs in the presence of MSCs (Group 2) were more similar to unstimulated cells than to mDC-stimulated cells, thereby confirming the strong inhibitory effect of MSCs.
FIG. 2.
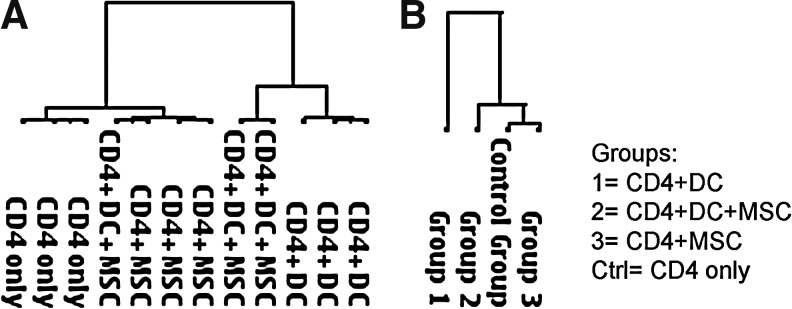
PCR array cluster analysis. PCR array data were clustered (A) independently or (B) grouped according to the condition. PCR, polymerase chain reaction.
In Tables 1–3, we list genes that are differentially expressed when analyzed by class comparison between groups (see also Supplementary Tables S1 and S2 for more comparisons). As expected, allogeneic mDC-stimulated CD4+ T-cells displayed an upregulation of several interferon-related genes when compared with resting CD4+ T-cells, such as CSF2 (fold-regulation +103), IRF4 (fold-regulation +47.7), IFNγ (fold-regulation +16.3), and STAT1 (fold-regulation +13.5) (Table 1), indicating a switch toward a Th1 phenotype. Moreover, the expression of IL-18R1, IL-12RB2, and CSF2 (GM-CSF) in stimulated CD4+ T-cells was upregulated, indicating that a cross-talk was occurring between DCs (producing IL-12 and IL-18) and T-cells. Surprisingly, we found that in comparison to allogeneic mDC-stimulated CD4+ T-cells, these stimulated cells in the presence of MSCs further upregulated many immune-related genes, including IFNγ, STAT1, IRF1, and TBX21 (transcription factor controlling IFNγ expression and typical Th1 marker, also called T-bet) together with an increase in IL-10, a potent immunosuppressor cytokine, and a downmodulation of IL-2 (Table 2). Moreover, MSCs induced an upregulation of CEBPB and MAF, 2 transcription factors involved in the regulation of IL-10 gene expression, in stimulated CD4+ T-cells (Table 2). The coexpression of IFNγ and IL-10 suggests the induction of an IL-10-producing Th1 phenotype among the effector CD4+ T-cells that has been described recently [16,18,22–24]. We also observed an effect of MSCs on the expression profile of resting CD4+ T-cells, namely, an upregulation of STAT1, IL-2RA, and IRF1 (Table 3) that was unexpected. In addition, MSCs induced a slight downregulation of the IL-6R in unstimulated cells.
Table 1.
Comparison of Gene Expression Profiles of Stimulated CD4+ T-Cells and Resting CD4+ T-Cells Shows a Typical Th1 Signature in the Stimulated Cells
| Gene symbol | Fold regulation | p-Value |
|---|---|---|
| CSF2 | 103.0119 | 0.0033 |
| IRF4 | 47.7248 | 0.000967 |
| IL12RB2 | 44.3235 | 0.00018 |
| CD86 | 37.7045 | 0.000089 |
| GAPDH | 36.8434 | 0.000522 |
| IL2RA | 26.9087 | 0.000138 |
| HAVCR2 | 24.4201 | 0.00046 |
| LAG3 | 24.2515 | 0.000211 |
| IFNG | 16.3362 | 0.003145 |
| STAT1 | 13.5479 | 0.002587 |
| TNFRSF8 | 13.5479 | 0.005073 |
| IL13 | 11.0043 | 0.004289 |
| CCR4 | 10.3867 | 0.006376 |
| ACTB | 9.105 | 0.000227 |
| HPRT1 | 8.8356 | 0.000748 |
| CTLA4 | 8.2821 | 0.00173 |
| SOCS1 | 7.8899 | 0.003803 |
| TNFRSF9 | 7.7992 | 0.000522 |
| CD80 | 7.586 | 0.005912 |
| GFI1 | 7.2769 | 0.000416 |
| CXCR3 | 6.379 | 0.022857 |
| TNF | 5.4139 | 0.000697 |
| TNFSF4 | 5.2902 | 0.001869 |
| CCR2 | 3.9267 | 0.00932 |
| ICOS | 3.8106 | 0.003733 |
| JAK2 | 3.6469 | 0.008808 |
| IL7 | 3.4027 | 0.021784 |
| IL18R1 | 2.8547 | 0.017735 |
| IL2 | 2.7702 | 0.00322 |
| IRF1 | 2.639 | 0.001318 |
| GATA3 | 2.6027 | 0.004835 |
| TMED1 | 2.3784 | 0.001681 |
| GLMN | 2.1092 | 0.009668 |
| IL4R | 1.6663 | 0.014107 |
| CD4 | 1.6472 | 0.019746 |
| TFCP2 | 1.6396 | 0.002101 |
| TLR6 | 1.5122 | 0.030715 |
| NFATC2IP | 1.5018 | 0.023402 |
| TGFB3 | −2.3565 | 0.015994 |
| CREBBP | −2.4967 | 0.00391 |
| CD28 | −2.9485 | 0.026825 |
| IGSF6 | −3.088 | 0.024308 |
CD4+ T-cells were cultured in the presence and absence of allogeneic mature dendritic cells (mDCs) (CD4+ T-cells + mDCs and resting CD4+ T-cells, respectively), and harvested after 6 days. Gene expression profiles were generated by PCR array (Human Th1-Th2-Th3 RT2 Profiler PCR Array from Qiagen). The class comparison analysis shows that stimulated cells upregulated several genes indicative of a Th1 signature induced by the presence of allogeneic mDCs. Resting CD4+ T-cells were used as the control group. Downregulated genes are shown in italics. Only genes showing a fold regulation >1.5 with a p-value<0.05 were considered in the analysis.
Table 3.
Comparison of Gene Expression Profiles of Resting CD4+ T-Cells in the Presence and Absence of MSCs Shows Upregulation of Different Genes Involved in T-Cell Activation
| Gene symbol | Fold regulation | p-Value |
|---|---|---|
| STAT1 | 24.761 | 0.00001 |
| LAG3 | 22.7848 | 0.049585 |
| CD86 | 18.5498 | 0.018956 |
| IL2RA | 14.9631 | 0.0069 |
| GAPDH | 11.7669 | 0.036322 |
| SOCS1 | 11.6857 | 0.004475 |
| TNFSF4 | 9.602 | 0.007012 |
| IRF1 | 8.0371 | 0.000742 |
| CD80 | 8.0185 | 0.000198 |
| TNFRSF9 | 7.4643 | 0.04532 |
| CEBPB | 6.9323 | 0.042343 |
| IL18R1 | 6.0629 | 0.000919 |
| CTLA4 | 5.3889 | 0.009356 |
| TMED1 | 4.2183 | 0.024149 |
| ACTB | 4.084 | 0.000995 |
| JAK2 | 3.7668 | 0.000116 |
| IL15 | 3.5801 | 0.014315 |
| HPRT1 | 3.4742 | 0.023748 |
| IL1R2 | 3.2117 | 0.007129 |
| IL4R | 3.0244 | 0.001042 |
| MAF | 2.9349 | 0.001968 |
| B2M | 2.8154 | 0.001036 |
| CCR4 | 2.6147 | 0.007229 |
| ICOS | 2.2191 | 0.016985 |
| NFATC1 | 2.1936 | 0.045864 |
| NFATC2IP | 2.0515 | 0.011964 |
| STAT4 | 2.0093 | 0.011348 |
| STAT6 | 1.9725 | 0.044474 |
| GLMN | 1.8965 | 0.039781 |
| NFATC2 | 1.8108 | 0.014851 |
| YY1 | 1.8067 | 0.033787 |
| GATA3 | 1.7132 | 0.002088 |
| TFCP2 | 1.6857 | 0.009999 |
| PTPRC | 1.5692 | 0.029901 |
| TYK2 | 1.5227 | 0.008305 |
| IL6R | −1.5227 | 0.036303 |
Resting CD4+ T-cells were cultured in the presence and absence of MSCs, and harvested after 6 days. Gene expression profiles were generated by PCR array (Human Th1-Th2-Th3 RT2 Profiler PCR Array from Qiagen). Resting CD4+ T-cells were used as the control group. The class comparison analysis shows that the presence of MSCs upregulated several genes involved in T-cell activation. Downregulated genes are shown in italics. Only genes showing a fold-regulation >1.5 with a p-value<0.05 were considered in the analysis.
Table 2.
Comparison of Gene Expression Profiles of CD4+ T-Cells Stimulated in the Presence and Absence of Mesenchymal Stromal Cells Shows that MSCs Induce an Upregulation of Both IFNγ and IL-10
| Gene symbol | Fold regulation | p-Value |
|---|---|---|
| IL1R1 | 28.7071 | 0.008869 |
| IL10 | 26.8466 | 0.046222 |
| IFNG | 16.1113 | 0.027979 |
| IL1R2 | 8.0185 | 0.049794 |
| CEBPB | 7.2267 | 0.000294 |
| TLR4 | 6.6807 | 0.020829 |
| PCGF2 | 6.0349 | 0.000557 |
| SOCS2 | 5.9932 | 0.000654 |
| MAF | 5.5149 | 0.011426 |
| IL18R1 | 5.4014 | 0.017516 |
| IL15 | 4.4485 | 0.007524 |
| CCR2 | 4 | 0.045012 |
| CCL7 | 3.7494 | 0.000431 |
| SFTPD | 3.5884 | 0.035498 |
| IL7 | 3.4822 | 0.000516 |
| SOCS1 | 3.4422 | 0.044916 |
| CCL11 | 3.3096 | 0.021184 |
| IRF1 | 3.1311 | 0.025793 |
| CREBBP | 3.0244 | 0.000953 |
| SOCS5 | 2.8745 | 0.006632 |
| IGSF6 | 2.7258 | 0.006632 |
| STAT4 | 2.555 | 0.006632 |
| IL4 | 2.3784 | 0.000171 |
| IL4R | 2.3349 | 0.003304 |
| TGFB3 | 2.271 | 0.010546 |
| IL23A | 2.2658 | 0.009474 |
| MAP2K7 | 2.1835 | 0.000377 |
| B2M | 2.1435 | 0.01634 |
| TLR6 | 2.1043 | 0.007087 |
| STAT1 | 1.8921 | 0.004308 |
| TMED1 | 1.8234 | 0.002293 |
| JAK1 | 1.7171 | 0.045392 |
| TNFRSF9 | 1.6702 | 0.005253 |
| CD86 | 1.5874 | 0.022256 |
| NFATC1 | 1.5476 | 0.012132 |
| CCR5 | 3.7064 | 0.00352 |
| TBX21 | 3.8018 | 0.022632 |
| FASLG | 3.8194 | 0.00555 |
| IL2 | −3.3558 | 0.008214 |
| CCR3 | −2.4228 | 0.049106 |
CD4+ T-cells stimulated by allogeneic mDCs were cultured in the presence and absence of mesenchymal stromal cells (MSCs), and harvested after 6 days. Gene expression profiles were generated by PCR array (Human Th1-Th2-Th3 RT2 Profiler PCR Array from Qiagen). Stimulated CD4+ T-cells were used as the control group. The class comparison analysis shows that stimulated cells in the presence of MSCs upregulated both interferon-related genes and IL-10. Downregulated genes are shown in italics. Only genes showing a fold-regulation >1.5 with a p-value<0.05 were considered in the analysis. IL-10, interleukin-10.
If we compare all conditions with resting CD4+ T-cells, the Venn diagram of upregulated genes reveals that many genes are in common, while the expression of others is specific to the single conditions (Fig. 3A). In particular, IFNγ is upregulated only when allogeneic mDCs are present as stimulators. The only gene specific for the condition, CD4+ T-cells + MSCs, is STAT6, but its weak modulation (fold-regulation 1.9, p-value 0.44) does not suggest a major role for this protein, despite its important role in IFNγ signaling. CSF2 was one of the genes upregulated specifically in the condition CD4+ T-cells + mDCs. This gene favors DC activity and has been described as being upregulated in antigen-specific T-cells [25]. If we consider the green and the blue groups depicted in Fig. 3A (CD4+ T-cells stimulated by mDCs in the presence and absence of MSCs, respectively), among the overlapping genes were IFN-related genes (IFNγ, IRF4, and STAT1), other genes related to cell activation (ie, CD86 and IL-2RA), as well as genes involved in the downregulation of IFN signaling (ie, SOCS1). Included among the genes those were identified under the condition in which MSCs were present (red and green groups, Fig. 3A) were CEBPB (common to the 2 groups), a CAAT/enhancing binding protein that inhibits cell proliferation, and TBX21 (specific for the green group), a protein regulating IFNγ production. The increase in TBX21 transcription could explain the stronger induction of IFNγ in cells stimulated in the presence of MSCs compared to cells stimulated by mDCs alone, as mentioned above.
FIG. 3.

Overlapping gene lists. (A) Each condition was compared with resting CD4+ T-cells, and upregulated genes are listed. In (B) and (C), gene lists were compared to the allogeneic mature dendritic cell (mDC)-stimulated CD4+ T-cell condition, and upregulated (B) and downregulated (C) genes are reported. In all analyses, we accepted fold-regulation >1.5 with a p-value<0.05. The obtained lists were analyzed using Venn diagrams. Color images available online at www.liebertpub.com/scd
In comparing all conditions to mDC-stimulated CD4+ T-cells, we observed that the only treatment in which expression of IFNγ and IL-10 were significantly increased was CD4+ T-cells + mDCs + MSCs (Fig. 3B). If we consider the list of downregulated genes, comparing the stimulated to the unstimulated condition (Fig. 3C), we did not find any overlap among the genes listed.
MSCs alter the secreted cytokine profile of CD4+ T-cells stimulated by allogeneic mDCs
In addition to the data on RNA expression, we measured the secretion of 17 cytokines in supernatants taken from cultures of CD4+ T-cells stimulated by allogeneic mDCs in the presence and absence of MSCs. We found a statistically significant overproduction of IL-10 and IFNγ when CD4+ T-cells were stimulated by allogeneic mDCs in the presence of MSCs (Fig. 4A, B), confirming our gene expression array data. Resting CD4+ T-cells cocultured with MSCs also showed a positive trend toward the secretion of both IFNγ and IL-10 (p=0.15 and p=0.32, respectively). In Supplementary Fig. S2, we report data on the detection of additional cytokines. Among them, only G-CSF, MCP1, IL-6, and IL-8 were regulated by the presence of MSCs to a significant extent, while others (ie, IL-4 and IL-7) showed a statistically significant difference between treatments, but the amount of cytokine in the supernatant is so low that this modulation is very unlikely to have a biological function. We also measured the secretion of cytokines by CD4+ T-cells isolated after 6 days of stimulation by allogeneic mDCs in the presence of MSCs and restimulated with mDCs (same source as during the first stimulation) for 1, 2, and 3 days. Upon restimulation, CD4+ T-cells produced a 10 times higher amount of IL-10 in comparison to what was observed before restimulation (from a mean of 22 pg/mL in the first stimulation to a mean of 260 pg/mL on day 1 after restimulation), while the production of IFNγ was almost doubled (from 27×103 to 45×103 pg/mL on day 1 after restimulation) (Supplementary Fig. S3).
FIG. 4.

MSCs modulate the secretion of IFNγ and IL-10, and the expression of their receptors on allogeneic stimulated CD4+ T-cells. (A) IFNγ and (B) IL-10 concentrations were measured in the supernatants of resting and stimulated CD4+ T-cells in the presence and absence of MSCs. Expression of (C) IFNγR and (D) IL-10R was evaluated by flow cytometry. Values were normalized based on the control condition (resting CD4+ T-cells). n=4 (A, B), n=8 (C, D). *p≤0.05, **p≤0.01, and ***p≤0.005. (A, B): Mann–Whitney test; (B, C): paired t-test. MFI=mean fluorescence intensity; IL-10, interleukin-10; IFNγ, interferon γ.
MSCs inhibit the upregulation of IFNγR expression in stimulated CD4+ T-cells
Since MSCs induce immunosuppression, but at the same time induce IFNγ and IL-10 production, we measured by flow cytometry the expression of IFNγR and IL-10R in CD4+ T-cells stimulated by allogeneic mDCs. We observed that in comparison to resting cells, IFNγR expression was upregulated in stimulated CD4+ T-cells (MFI fold-increase=+1.56), while this effect was attenuated in the presence of MSCs (MFI fold-increase=+0.85) (Fig. 4C). The expression of IL-10R was unaffected by the presence of MSCs during CD4+ T-cell stimulation (Fig. 4D). To test the biological consequences of the alteration of the receptor expression, we tested the phosphorylation of STAT1 and STAT3 molecules (which are events downstream of IFNγ and IL-10 stimulation, respectively) (Supplementary Fig. S4). For STAT1-p induced by IFNγ stimulation, cells previously stimulated in the presence of MSCs showed a reduced, but still positive, response as compared to cells stimulated without MSCs, in accordance with the fact that the receptor displayed the same level of expression as in resting cells. For STAT3-p induced by IL-10, we repeatedly observed that when cells were stimulated in the presence of MSCs, 2 cell populations could be detected.
MSCs induce the coexpression of IFNγ and IL-10 in a fraction of the CD4+ T-cells undergoing allogeneic mDC stimulation
MSC-induced coexpression of IFNγ and IL-10 by CD4+ T-cells was also evaluated by cytofluorimetric analysis. As shown in Fig. 5A and B, the percentage of IFNγ/IL-10 double-positive CD4+ T-cells increased significantly after 6 days of coculture with allogeneic mDCs in the presence of MSCs (on average from 0.7% in stimulated CD4+ T-cells in the absence of MSCs to 3.5% in stimulated CD4+ T-cells in the presence of MSCs). Almost all of these double-positive cells were also CD69+ (Fig. 5C). To measure the dynamics of the generation of this subpopulation, we harvested the cells every 24 h for 6 days and tested the coexpression of the 2 cytokines in the CD4+ T-cells. As shown in Fig. 5D, the double-positive cells could be observed by day 4, and their percentage increased over time. We also tested for the presence of these double-positive cells among CD4+ T-cells isolated from the different culture conditions and restimulated for 1, 2, and 3 days with allogeneic mDCs, and we observed a slight increase in their percentage over time (Supplementary Fig. S5).
FIG. 5.

MSCs induce an increase in the percentage of CD4+ T-cells coexpressing IL-10 and IFNγ during allogeneic stimulation. Purified CD4+ T-cells were stimulated for 6 days by allogeneic mDCs in the presence and absence of MSCs. In (A), the cytofluorimetric analysis of a representative donor is shown. In (B, C), results on day 6 from 10 donors are shown. (C) Expression of CD69 gated on IFNγ+ IL-10+ CD4+ cells (n=10, analysis on day 6). (D) Time course analysis of the percentage of IFNγ+ IL-10+ CD4+ cells (n=3). All presented data were gated on CD4+ T-cells. *p≤0.05, **p≤0.01, and ***p≤0.005 (paired t-test).
The inhibition of the proliferation of stimulated CD4+ T-cells induced by MSCs is largely reversed by blocking the activity of the IFNγR
As shown in Fig. 6, the proliferation of CD4+ T-cells in response to allogeneic mDCs was inhibited by the presence of MSCs, and this effect was almost completely reversed (80%) by adding an anti-IFNγR-neutralizing antibody to the culture. In the same setting, the addition of an anti-IL-10R-neutralizing antibody did not induce a significant modulation of T-cell proliferation. These data suggest that IFNγ plays a prominent role in MSC-mediated inhibition of CD4+ T-cell proliferation. We also observed that CD4+ T-cells stimulated in the presence of MSCs were able to proliferate if isolated from their culture condition and restimulated with allogeneic mDCs (Supplementary Fig. S6A). Further, this ability to be restimulated was not influenced by the effect of the treatment with the IFNγR-blocking antibody during the first stimulation (Supplementary Fig. S6B).
FIG. 6.

Treatment with blocking anti-IFNγR antibodies largely restores T-cell proliferation in the presence of MSCs. CD4+ T-cells were stimulated with allogeneic mDCs for 6 days in the presence and absence of MSCs. Where indicated, blocking anti-IL-10R and/or anti-IFNγR antibodies were added everyday to the culture (20 μg/mL each). Data are expressed as the percentage of CD4+ T-cells negative for CFSE. n=4. *p≤0.05, **p≤0.01, paired t-test, 2 tails.
Allogeneic-stimulated CD4+ T-cells cultured in presence of MSCs decrease the proliferation of autologous cells stimulated in absence of MSCs
We evaluated whether MSCs could confer immunomodulatory properties to CD4+ T-cells. To test this, CD4+ T-cells stimulated with mDCs in the presence of MSCs were harvested on day 6 and added to a second allogeneic stimulation in which no MSCs were present (ratio of fresh CD4+ T-cells to CD4+ T-cells from the previous culture of 1:1). Both responder and target cells were from the same donors in the 2 stimulations. As shown in Fig. 7, CD4+ T-cells obtained after 6 days of coculture with allogeneic DCs and MSCs were able to inhibit the cellular proliferation in the second allogeneic stimulation as measured by [3H]-thymidine incorporation. On the other hand, transfer of cell supernatant from the first to the second culture did not induce any significant change in cell proliferation (data not shown), suggesting that the inhibition that occurred in the second T-cell stimulation was dependent on the presence of cytokine-producing cells and/or cell contact.
FIG. 7.

CD4+ T-cells previously cocultured with allogeneic mDCs and MSCs induce the inhibition of cellular proliferation of autologous CD4+ T-cells stimulated by allogeneic mDCs. After 6 days of culture in the presence of allogeneic mDCs and MSCs, CD4+ T-cells were harvested and added to a second culture where fresh autologous CD4+ T-cells were stimulated by the same allogeneic mDCs. The second culture was carried for 4 days. Where indicated, neutralizing antibodies blocking the activity of the IL-10R or IFNγR were added during the 4 days of the second stimulation. n=3 independent experiments. Statistics: paired t-test, *p≤0.05, **p≤0.01.
We further showed that this inhibition of the second allogeneic stimulation by CD4+ T-cells could be partially, but significantly, reversed by the addition of an anti-IL-10R-neutralizing antibody, whereas the addition of an anti-IFNγR-neutralizing antibody had no effect (Fig. 7). This suggests that the inhibition seen upon transfer of CD4+ cells and observed in the absence of MSCs was partially IL-10 dependent and not IFNγ dependent, and that this inhibition was different from the one induced by the presence of MSCs during the first stimulation.
Interestingly, by transferring CD4+ T-cells stimulated for 6 days in the presence of DCs and MSCs and a blocking IFNγR antibody to a second MLR where CD4+ T-cells were stimulated by fresh DCs (same donors as during the first stimulation), we still observed an inhibition of T-cell proliferation (Supplementary Fig. S7A). This suggests once more that the inhibition of the proliferation of CD4+ T-cells in the presence of MSCs that occurs during the first stimulation is not caused by the same mechanism as the inhibition of CD4+ T-cells that occurs during the second stimulation in the absence of MSCs. This further suggests that the induction of a regulatory population during the first stimulation by MSCs is not dependent on IFNγ. Also, we observed that blocking IFNγR during the first MLR attenuated the increase in IFNγ+ IL-10+ double-positive cells (from 2.9% to 1.2% on average), but that was still significantly increased as compared to the unstimulated cells (0.1%) (Supplementary Fig. S7B).
Discussion
The use of MSCs as an alternative/additive strategy for the treatment of GvHD, as well as for autoimmune diseases, has been proposed by a number of groups [6,26–30]. These cells are clinically attractive, as they show very low immunogenicity, and they can induce immunosuppression in vitro and in vivo [15], and available data from clinical trials indicate that they are safe and have shown some efficacy in ameliorating GvHD and autoimmune disease outcome in patients [2,4–6,26–30]. However, their mechanism of action is still poorly understood.
Immune regulation involves a very complex network of interactions among cells and can be mediated through direct cell–cell contact as well as by soluble factors. It is known that T-cells can modify their properties and functions in the periphery after their differentiation and selection in the thymus. Their ability to switch from an effector (IFNγ-expressing cells) to a regulatory function (IFNγ and IL-10 coexpressing cells) has been demonstrated in humans both in vitro and in vivo [16,22]. Herein, our major finding is that MSCs can induce IL-10-producing Th1 cells in a subpopulation of effector CD4+ T-cells. This was mainly observed when CD4+ T-cells were stimulated by allogeneic mDCs in the presence of MSCs and resulted in the concomitant production of IFNγ and IL-10, cytokines known for having opposite effects on the immune reaction.
IL-10-producing Th1 cells differ from naturally occurring Tregs, since they do not express FoxP3, and differ from T-regulatory type 1 (Tr1) cells, since they produce high levels of IFNγ and express T-bet (TBX21) [16]. Meiler et al. [22] demonstrated in vivo that beekeepers develop tolerance to bee venom after repetitive exposure to antigen as a result of a switch from IFNγ-producing Th1 clones to cells coproducing IFNγ and IL-10. Based on our data, we cannot confirm that the observed IFNγ+ IL-10+ double-positive subpopulation is generated from a switched Th1 population, since we cannot trace single T-cell clones, and alternatively, the same cellular distribution could be due to Th1 cell death or either a cell survival advantage or selective expansion of IL-10-producing cells. Our observation that the major induction by MSCs of this particular T-cell phenotype occurred in the presence of allogeneic antigen-presenting cells is evidence for the commonly accepted notion that a proinflammatory environment favors the suppressive function of MSCs (the so-called licensing process) both in vivo and in vitro [31–33].
Interestingly, we found that while in the presence of MSCs the production of both IFNγ and IL-10 increased concomitantly, the expression of their cognate receptors was differentially regulated. Indeed, CD4+ T-cells activated in the presence of MSCs lacked the typical IFNγR upregulation showed by activated Th1 cells, while expression of the IL-10R was statistically unaffected. This suggests that although the cells keep producing IFNγ (indeed to a much higher level compared to Th1 cells), they may become less responsive to this very potent and potentially dangerous stimulating cytokine [34,35]. By evaluating the phosphorylation status of STAT1 and STAT3 molecules in response to IFNγ and IL-10, respectively, we observed that CD4+ T-cells stimulated by allogeneic mDCs in the presence of MSCs are still sensitive to both cytokines, even if less so than cells previously stimulated in the absence of MSCs. This is in agreement with the fact that IFNγR expression is reduced, but not shut off. Our data support the use of MSCs for the treatment of GvHD, because it suggests that T-cells could still respond to cytokines in the presence of MSCs, and therefore that MSCs could inhibit the GvHD effect without inhibiting the graft versus leukemia (GvL) effect.
Unexpectedly, we observed that MSCs were able to induce such a peculiar T-cell population by simply being in contact with T-cells, although the presence of a proinflammatory microenvironment due to the ongoing T-cell stimulation amplified this effect in an IFNγ-dependent manner.
From our gene expression analysis, we found that, as expected, CD4+ T-cells activated by allogeneic mDCs upregulate CSF2, IL-12R, and IL-18R (all molecules involved in DC-CD4+ T-cell cross-talk) together with the expression of IFNγ-related genes (IRF4, IFNγ, STAT1, SOCS1, JAK2, and IRF1), suggesting a Th1 polarization. The addition of MSCs to the stimulated CD4+ T-cells (CD4+ T-cells + mDCs + MSCs) induced a downregulation of IL-2 expression (as confirmed by the decreased expression of CD25 on the cell surface; data not shown) and increased the simultaneous expression of IFNγ, IL-10, and transcription factors, CEBPB and MAF.
We also confirmed these data by analyzing the cytokine profile of the supernatant taken from cultures of CD4+ T-cells stimulated by allogeneic mDCs in the presence of MSCs. In stimulated CD4+ T-cells cocultured with MSCs, IL-6 was also strongly upregulated at the protein, but not mRNA, level in the CD4+ T-cells, suggesting that the main producers of this cytokine were not the CD4+ T-cells, but rather MSCs. Indeed, the level of IL-6 was also high in the supernatant from cultures of unstimulated CD4+ T-cells in the presence of MSCs. This is in agreement with the possible role that IL-6 plays in MSC-induced immunosuppression, as suggested by Najar et al. [36]. Moreover, IL-6 can promote IL-10 production [37].
By flow cytometry analysis, we observed that almost all the T-cells coexpressing IFNγ and IL-10 were also CD69+ (Fig. 5C). This observation is particularly interesting due to the regulatory role recently attributed to cells expressing CD69 [38,39]. Nevertheless, this increase in CD69 expression was not restricted to T-cells coexpressing IFNγ and IL-10, since it was also expressed in about 40% of CD4+ Foxp3− CD25− cells (Fig. 1C).
By intracellular staining, we were able to identify a small fraction (2%–3%) of CD4+ T-cells coexpressing IFNγ and IL-10 in the presence of MSCs. We noticed that this population could be detected as early as day 4 of the culture. This is interesting since this is also the time point at which, in the activated condition, T-cells start to actively proliferate (according to our test based on CFSE dilution; data not shown). In cell-transfer experiments, we observed that allogeneic mDC-stimulated CD4+ T-cells cultured in the presence of MSCs were able to inhibit cellular proliferation when added to wells in which syngeneic CD4+ T-cells were stimulated by allogeneic mDCs, strongly suggesting that they had acquired a regulatory function.
Interestingly, blocking the IFNγR, but not the IL-10R, largely reversed the inhibitory effect of MSCs on T-cell proliferation. It is noteworthy that despite previously published data suggesting the importance of IL-10 in MSC-mediated immunosuppression [40–42], to our knowledge, no one has yet demonstrated that the putative effects of IL-10 could be reversed by blocking the IL-10 pathway. Such a discrepancy may not only be explained by the redundancy of MSC-induced inhibitory mechanisms [43–45], but also by the simple fact that while IL-10+ IFNγ+ T-cells are being generated during the first stimulation by the presence of MSCs, their accumulation occurs too late to have any effect. On the contrary, when cells are transferred into a second allogeneic stimulation, they are already activated and of sufficient number to block autologous T-cell proliferation in an IFNγ-independent manner. The regulatory potential of these cells is such that when a blocking antibody was used to neutralize the activity of the IFNγR during the first stimulation, reducing the number of double-positive cells to that observed after coculture of MSCs and T-cells, transferred cells were still able to inhibit a second stimulation. This phenomenon has also been observed for different types of regulatory cells that could be generated/expanded during a first stimulation (where their effect was not fully appreciable) and then used as inhibitory cells in a second stimulation involving autologous responder cells [46,47]. In support of this hypothesis, we observed that the inhibition of cellular proliferation induced by the transfer of effector cells that were stimulated in the presence of MSCs to a second allogeneic stimulation could be partially reversed by the presence of antibodies blocking the IL-10R.
Our data suggest that MSCs act by different mechanisms, a direct one that involves IFNγ and an indirect one that involves the differentiation of an IFNγ+ IL-10+ T-cell subpopulation that is not strictly IFNγ dependent, although IFNγ increases their proliferation, and whose effect can only be detected in a second stimulation, because a functionally significant number of IFNγ+ IL-10+ T-cells have arisen during the first stimulation. Moreover, the fact that neutralizing the IL-10R did not completely restore the observed T-cell proliferation during the second stimulation implies that during the first stimulation, MSCs confer to T-cells additional features, opening up interesting avenues for future studies.
The lack of increase in classical Tregs during T-cell activation in the presence of MSCs confirms previously reported observations according to which BM-derived MSCs were able to induce a regulatory function in total PBMCs that did not require the presence of classical CD25+ FoxP3+ Tregs [20]. It could be argued that all of the data reported in the present work are only applicable to our specific CB-derived MSC line. For this reason, we also used freshly isolated BM-derived MSCs to test their ability to modulate the CD4+ T-cell allogeneic response. We confirmed the ability of these BM-derived MSCs to inhibit T-cell proliferation without inducing an increase in the classical CD25+ FoxP3+ Tregs. Moreover, treatment with the IFNγ-blocking antibody was able to restore T-cell proliferation in the presence of BM-MSCs (Supplementary Fig. S8).
The possibility of inhibiting T-cell activation by the simple transfer of cells previously cocultured with MSCs in the presence or absence of an allogeneic stimulus opens up interesting prospects for the therapeutic application of MSCs. Indeed, the infusion of autologous PBMCs pretreated with MSCs would be a safe and potentially efficacious strategy to reduce GvHD.
In summary, our data suggest that MSCs induce a subset of responder T-cells to coproduce IFNγ and IL-10 (IL-10-producing Th1 cells), contributing to the immunosuppressive effect of MSCs on allogeneic stimulated T-cells. At the same time, our data regarding the role of IFNγ signaling suggest that MSCs can employ different concomitant mechanisms of immunosuppression, which involve secreted cytokines or MSC–DC interactions as proposed by others [48–50]. Nevertheless, the identification of this MSC-induced T-cell subpopulation provides new insight into the mechanism by which MSCs contribute to immunosuppression and at the same time adds to the recent scientific debate surrounding this newly described IFNγ/IL-10 double-positive CD4+ T-cell subset.
Supplementary Material
Acknowledgments
This work was funded by La Fondation CHU Sainte-Justine, La Fondation Charles-Bruneau, and a grant from the FRQS, Fonds de la Recherche en Santé du Québec (Fonds de recherches en médecine transfusionnelle, en greffe et en biovigilance 2010–2013). S.S. received a scholarship from La Fondation CHU Sainte-Justine and from the Pediatric Immunodeficiency Treatment Consortium (PIDTC, grant no. U54AI082973). E.H. is a scholar of the FRQS.
Author Disclosure Statement
No competing financial interests exist.
References
- 1.Bernardo ME. Pagliara D. Locatelli F. Mesenchymal stromal cell therapy: a revolution in Regenerative Medicine? Bone Marrow Transplant. 2012;47:164–171. doi: 10.1038/bmt.2011.81. [DOI] [PubMed] [Google Scholar]
- 2.Baron F. Lechanteur C. Willems E. Bruck F. Baudoux E. Seidel L. Vanbellinghen JF. Hafraoui K. Lejeune M, et al. Cotransplantation of mesenchymal stem cells might prevent death from graft-versus-host disease (GVHD) without abrogating graft-versus-tumor effects after HLA-mismatched allogeneic transplantation following nonmyeloablative conditioning. Biol Blood Marrow Transplant. 2010;16:838–847. doi: 10.1016/j.bbmt.2010.01.011. [DOI] [PubMed] [Google Scholar]
- 3.Kebriaei P. Isola L. Bahceci E. Holland K. Rowley S. McGuirk J. Devetten M. Jansen J. Herzig R, et al. Adult human mesenchymal stem cells added to corticosteroid therapy for the treatment of acute graft-versus-host disease. Biol Blood Marrow Transplant. 2009;15:804–811. doi: 10.1016/j.bbmt.2008.03.012. [DOI] [PubMed] [Google Scholar]
- 4.Ringden O. Uzunel M. Rasmusson I. Remberger M. Sundberg B. Lonnies H. Marschall HU. Dlugosz A. Szakos A, et al. Mesenchymal stem cells for treatment of therapy-resistant graft-versus-host disease. Transplantation. 2006;81:1390–1397. doi: 10.1097/01.tp.0000214462.63943.14. [DOI] [PubMed] [Google Scholar]
- 5.Weng JY. Du X. Geng SX. Peng YW. Wang Z. Lu ZS. Wu SJ. Luo CW. Guo R, et al. Mesenchymal stem cell as salvage treatment for refractory chronic GVHD. Bone Marrow Transplant. 2010;45:1732–1740. doi: 10.1038/bmt.2010.195. [DOI] [PMC free article] [PubMed] [Google Scholar]
- 6.Le Blanc K. Frassoni F. Ball L. Locatelli F. Roelofs H. Lewis I. Lanino E. Sundberg B. Bernardo ME, et al. Mesenchymal stem cells for treatment of steroid-resistant, severe, acute graft-versus-host disease: a phase II study. Lancet. 2008;371:1579–1586. doi: 10.1016/S0140-6736(08)60690-X. [DOI] [PubMed] [Google Scholar]
- 7.Nauta AJ. Fibbe WE. Immunomodulatory properties of mesenchymal stromal cells. Blood. 2007;110:3499–3506. doi: 10.1182/blood-2007-02-069716. [DOI] [PubMed] [Google Scholar]
- 8.Di Nicola M. Carlo-Stella C. Magni M. Milanesi M. Longoni PD. Matteucci P. Grisanti S. Gianni AM. Human bone marrow stromal cells suppress T-lymphocyte proliferation induced by cellular or nonspecific mitogenic stimuli. Blood. 2002;99:3838–3843. doi: 10.1182/blood.v99.10.3838. [DOI] [PubMed] [Google Scholar]
- 9.Krampera M. Glennie S. Dyson J. Scott D. Laylor R. Simpson E. Dazzi F. Bone marrow mesenchymal stem cells inhibit the response of naive and memory antigen-specific T cells to their cognate peptide. Blood. 2003;101:3722–3729. doi: 10.1182/blood-2002-07-2104. [DOI] [PubMed] [Google Scholar]
- 10.Le Blanc K. Tammik L. Sundberg B. Haynesworth SE. Ringden O. Mesenchymal stem cells inhibit and stimulate mixed lymphocyte cultures and mitogenic responses independently of the major histocompatibility complex. Scand J Immunol. 2003;57:11–20. doi: 10.1046/j.1365-3083.2003.01176.x. [DOI] [PubMed] [Google Scholar]
- 11.English K. Mahon BP. Allogeneic mesenchymal stem cells: agents of immune modulation. J Cell Biochem. 2011;112:1963–1968. doi: 10.1002/jcb.23119. [DOI] [PubMed] [Google Scholar]
- 12.Di Ianni M. Del Papa B. De Ioanni M. Moretti L. Bonifacio E. Cecchini D. Sportoletti P. Falzetti F. Tabilio A. Mesenchymal cells recruit and regulate T regulatory cells. Exp Hematol. 2008;36:309–318. doi: 10.1016/j.exphem.2007.11.007. [DOI] [PubMed] [Google Scholar]
- 13.Selmani Z. Naji A. Zidi I. Favier B. Gaiffe E. Obert L. Borg C. Saas P. Tiberghien P, et al. Human leukocyte antigen-G5 secretion by human mesenchymal stem cells is required to suppress T lymphocyte and natural killer function and to induce CD4+CD25highFOXP3+ regulatory T cells. Stem Cells. 2008;26:212–222. doi: 10.1634/stemcells.2007-0554. [DOI] [PubMed] [Google Scholar]
- 14.Salem HK. Thiemermann C. Mesenchymal stromal cells: current understanding and clinical status. Stem Cells. 2010;28:585–596. doi: 10.1002/stem.269. [DOI] [PMC free article] [PubMed] [Google Scholar]
- 15.Gregoire-Gauthier JL. Selleri S. Fontaine FO. Dieng MM. Patey N. Despars GV. Beaus Jour CM. Haddad L. Therapeutic efficacy of cord blood-derived mesenchymal stromal cells for the prevention of acute graft-versus-host disease in a xenogenic mouse model. Stem Cells Dev. 2012;21:1616–1626. doi: 10.1089/scd.2011.0413. [DOI] [PubMed] [Google Scholar]
- 16.Cope A. Le Friec G. Cardone J. Kemper C. The Th1 life cycle: molecular control of IFN-gamma to IL-10 switching. Trends Immunol. 2011;32:278–286. doi: 10.1016/j.it.2011.03.010. [DOI] [PubMed] [Google Scholar]
- 17.Mazza G. Sabatos-Peyton CA. Protheroe RE. Herman A. Campbell JD. Wraith DC. Isolation and characterization of human interleukin-10-secreting T cells from peripheral blood. Hum Immunol. 2010;71:225–234. doi: 10.1016/j.humimm.2009.12.003. [DOI] [PMC free article] [PubMed] [Google Scholar]
- 18.Haringer B. Lozza L. Steckel B. Geginat J. Identification and characterization of IL-10/IFN-gamma-producing effector-like T cells with regulatory function in human blood. J Exp Med. 2009;206:1009–1017. doi: 10.1084/jem.20082238. [DOI] [PMC free article] [PubMed] [Google Scholar]
- 19.English K. Ryan JM. Tobin L. Murphy MJ. Barry FP. Mahon BP. Cell contact, prostaglandin E(2) and transforming growth factor beta 1 play non-redundant roles in human mesenchymal stem cell induction of CD4+CD25(High) forkhead box P3+ regulatory T cells. Clin Exp Immunol. 2009;156:149–160. doi: 10.1111/j.1365-2249.2009.03874.x. [DOI] [PMC free article] [PubMed] [Google Scholar]
- 20.Prevosto C. Zancolli M. Canevali P. Zocchi MR. Poggi A. Generation of CD4+ or CD8+ regulatory T cells upon mesenchymal stem cell-lymphocyte interaction. Haematologica. 2007;92:881–888. doi: 10.3324/haematol.11240. [DOI] [PubMed] [Google Scholar]
- 21.Mougiakakos D. Jitschin R. Johansson CC. Okita R. Kiessling R. Le Blanc K. The impact of inflammatory licensing on heme oxygenase-1-mediated induction of regulatory T cells by human mesenchymal stem cells. Blood. 2011;117:4826–4835. doi: 10.1182/blood-2010-12-324038. [DOI] [PubMed] [Google Scholar]
- 22.Meiler F. Zumkehr J. Klunker S. Ruckert B. Akdis CA. Akdis M. In vivo switch to IL-10-secreting T regulatory cells in high dose allergen exposure. J Exp Med. 2008;205:2887–2898. doi: 10.1084/jem.20080193. [DOI] [PMC free article] [PubMed] [Google Scholar]
- 23.Saraiva M. Christensen JR. Veldhoen M. Murphy TL. Murphy KM. O'Garra A. Interleukin-10 production by Th1 cells requires interleukin-12-induced STAT4 transcription factor and ERK MAP kinase activation by high antigen dose. Immunity. 2009;31:209–219. doi: 10.1016/j.immuni.2009.05.012. [DOI] [PMC free article] [PubMed] [Google Scholar]
- 24.Saraiva M. O'Garra A. The regulation of IL-10 production by immune cells. Nat Rev Immunol. 2010;10:170–181. doi: 10.1038/nri2711. [DOI] [PubMed] [Google Scholar]
- 25.Selleri S. Deola S. Pos Z. Jin P. Worschech A. Slezak SL. Rumio C. Panelli MC. Maric D, et al. GM-CSF/IL-3/IL-5 receptor common beta chain (CD131) expression as a biomarker of antigen-stimulated CD8+ T cells. J Transl Med. 2008;6:17. doi: 10.1186/1479-5876-6-17. [DOI] [PMC free article] [PubMed] [Google Scholar]
- 26.Garcia-Olmo D. Garcia-Arranz M. Herreros D. Pascual I. Peiro C. Rodriguez-Montes JA. A phase I clinical trial of the treatment of Crohn's fistula by adipose mesenchymal stem cell transplantation. Dis Colon Rectum. 2005;48:1416–1423. doi: 10.1007/s10350-005-0052-6. [DOI] [PubMed] [Google Scholar]
- 27.Dryden GW. Overview of stem cell therapy for Crohn's disease. Expert Opin Biol Ther. 2009;9:841–847. doi: 10.1517/14712590902956615. [DOI] [PubMed] [Google Scholar]
- 28.Dahlke MH. Hoogduijn M. Eggenhofer E. Popp FC. Renner P. Slowik P. Rosenauer A. Piso P. Geissler EK, et al. Toward MSC in solid organ transplantation: 2008 position paper of the MISOT study group. Transplantation. 2009;88:614–619. doi: 10.1097/TP.0b013e3181b4425a. [DOI] [PubMed] [Google Scholar]
- 29.Karussis D. Karageorgiou C. Vaknin-Dembinsky A. Gowda-Kurkalli B. Gomori JM. Kassis I. Bulte JW. Petrou P. Ben-Hur T. Abramsky O. Slavin S. Safety and immunological effects of mesenchymal stem cell transplantation in patients with multiple sclerosis and amyotrophic lateral sclerosis. Arch Neurol. 2010;67:1187–1194. doi: 10.1001/archneurol.2010.248. [DOI] [PMC free article] [PubMed] [Google Scholar]
- 30.Davatchi F. Abdollahi BS. Mohyeddin M. Shahram F. Nikbin B. Mesenchymal stem cell therapy for knee osteoarthritis. Preliminary report of four patients. Int J Rheum Dis. 2011;14:211–215. doi: 10.1111/j.1756-185X.2011.01599.x. [DOI] [PubMed] [Google Scholar]
- 31.Polchert D. Sobinsky J. Douglas G. Kidd M. Moadsiri A. Reina E. Genrich K. Mehrotra S. Setty S. Smith B. Bartholomew A. IFN-gamma activation of mesenchymal stem cells for treatment and prevention of graft versus host disease. Eur J Immunol. 2008;38:1745–1755. doi: 10.1002/eji.200738129. [DOI] [PMC free article] [PubMed] [Google Scholar]
- 32.Prasanna SJ. Gopalakrishnan D. Shankar SR. Vasandan AB. Pro-inflammatory cytokines, IFNgamma and TNFalpha, influence immune properties of human bone marrow and Wharton jelly mesenchymal stem cells differentially. PLoS One. 2010;5:e9016. doi: 10.1371/journal.pone.0009016. [DOI] [PMC free article] [PubMed] [Google Scholar]
- 33.Groh ME. Maitra B. Szekely E. Koc ON. Human mesenchymal stem cells require monocyte-mediated activation to suppress alloreactive T cells. Exp Hematol. 2005;33:928–934. doi: 10.1016/j.exphem.2005.05.002. [DOI] [PubMed] [Google Scholar]
- 34.Bernabei P. Allione A. Rigamonti L. Bosticardo M. Losana G. Borghi I. Forni G. Novelli F. Regulation of interferon-gamma receptor (INF-gammaR) chains: a peculiar way to rule the life and death of human lymphocytes. Eur Cytokine Netw. 2001;12:6–14. [PubMed] [Google Scholar]
- 35.Refaeli Y. Van Parijs L. Alexander SI. Abbas AK. Interferon gamma is required for activation-induced death of T lymphocytes. J Exp Med. 2002;196:999–1005. doi: 10.1084/jem.20020666. [DOI] [PMC free article] [PubMed] [Google Scholar]
- 36.Najar M. Rouas R. Raicevic G. Boufker HI. Lewalle P. Meuleman N. Bron D. Toungouz M. Martiat P. Lagneaux L. Mesenchymal stromal cells promote or suppress the proliferation of T lymphocytes from cord blood and peripheral blood: the importance of low cell ratio and role of interleukin-6. Cytotherapy. 2009;11:570–583. doi: 10.1080/14653240903079377. [DOI] [PubMed] [Google Scholar]
- 37.Stumhofer JS. Silver JS. Laurence A. Porrett PM. Harris TH. Turka LA. Ernst M. Saris CJ. O'Shea JJ. Hunter CA. Interleukins 27 and 6 induce STAT3-mediated T cell production of interleukin 10. Nat Immunol. 2007;8:1363–1371. doi: 10.1038/ni1537. [DOI] [PubMed] [Google Scholar]
- 38.Gandhi R. Farez MF. Wang Y. Kozoriz D. Quintana FJ. Weiner HL. Cutting edge: human latency-associated peptide+ T cells: a novel regulatory T cell subset. J Immunol. 2010;184:4620–4624. doi: 10.4049/jimmunol.0903329. [DOI] [PMC free article] [PubMed] [Google Scholar]
- 39.Han Y. Guo Q. Zhang M. Chen Z. Cao X. CD69+ CD4+ CD25− T cells, a new subset of regulatory T cells, suppress T cell proliferation through membrane-bound TGF-beta 1. J Immunol. 2009;182:111–120. doi: 10.4049/jimmunol.182.1.111. [DOI] [PubMed] [Google Scholar]
- 40.Soleymaninejadian E. Pramanik K. Samadian E. Immunomodulatory properties of mesenchymal stem cells: cytokines and factors. Am J Reprod Immunol. 2012;67:1–8. doi: 10.1111/j.1600-0897.2011.01069.x. [DOI] [PubMed] [Google Scholar]
- 41.Giuliani M. Fleury M. Vernochet A. Ketroussi F. Clay D. Azzarone B. Lataillade JJ. Durrbach A. Long-lasting inhibitory effects of fetal liver mesenchymal stem cells on T-lymphocyte proliferation. PLoS One. 2011;6:e19988. doi: 10.1371/journal.pone.0019988. [DOI] [PMC free article] [PubMed] [Google Scholar]
- 42.Gieseke F. Bohringer J. Bussolari R. Dominici M. Handgretinger R. Muller I. Human multipotent mesenchymal stromal cells use galectin-1 to inhibit immune effector cells. Blood. 2010;116:3770–3779. doi: 10.1182/blood-2010-02-270777. [DOI] [PubMed] [Google Scholar]
- 43.Ryan JM. Barry F. Murphy JM. Mahon BP. Interferon-gamma does not break, but promotes the immunosuppressive capacity of adult human mesenchymal stem cells. Clin Exp Immunol. 2007;149:353–363. doi: 10.1111/j.1365-2249.2007.03422.x. [DOI] [PMC free article] [PubMed] [Google Scholar]
- 44.Francois M. Romieu-Mourez R. Li M. Galipeau J. Human MSC suppression correlates with cytokine induction of indoleamine 2,3-dioxygenase and bystander M2 macrophage differentiation. Mol Ther. 2012;20:187–195. doi: 10.1038/mt.2011.189. [DOI] [PubMed] [Google Scholar]
- 45.Beyth S. Borovsky Z. Mevorach D. Liebergall M. Gazit Z. Aslan H. Galun E. Rachmilewitz J. Human mesenchymal stem cells alter antigen-presenting cell maturation and induce T-cell unresponsiveness. Blood. 2005;105:2214–2219. doi: 10.1182/blood-2004-07-2921. [DOI] [PubMed] [Google Scholar]
- 46.Levitsky J. Miller J. Leventhal J. Huang X. Flaa C. Wang E. Tambur A. Burt RK. Gallon L. Mathew JM. The human “Treg MLR”.: immune monitoring for FOXP3+ T regulatory cell generation. Transplantation. 2009;88:1303–1311. doi: 10.1097/TP.0b013e3181bbee98. [DOI] [PMC free article] [PubMed] [Google Scholar]
- 47.Daniel V. Sadeghi M. Wang H. Opelz G. CD4(+)CD25(+)Foxp3(+)IFNgamma(+) Treg are immunosuppressive in vitro and increase with intensity of the alloresponse in pretransplant MLC. Transpl Immunol. 2012;27:114–121. doi: 10.1016/j.trim.2012.08.003. [DOI] [PubMed] [Google Scholar]
- 48.Aggarwal S. Pittenger MF. Human mesenchymal stem cells modulate allogeneic immune cell responses. Blood. 2005;105:1815–1822. doi: 10.1182/blood-2004-04-1559. [DOI] [PubMed] [Google Scholar]
- 49.Djouad F. Charbonnier LM. Bouffi C. Louis-Plence P. Bony C. Apparailly F. Cantos C. Jorgensen C. Noel D. Mesenchymal stem cells inhibit the differentiation of dendritic cells through an interleukin-6-dependent mechanism. Stem Cells. 2007;25:2025–2032. doi: 10.1634/stemcells.2006-0548. [DOI] [PubMed] [Google Scholar]
- 50.Spaggiari GM. Abdelrazik H. Becchetti F. Moretta L. MSCs inhibit monocyte-derived DC maturation and function by selectively interfering with the generation of immature DCs: central role of MSC-derived prostaglandin E2. Blood. 2009;113:6576–6583. doi: 10.1182/blood-2009-02-203943. [DOI] [PubMed] [Google Scholar]
Associated Data
This section collects any data citations, data availability statements, or supplementary materials included in this article.