Abstract
The mechanical environment plays an important role in musculoskeletal tissue development. The present study characterized changes in supraspinatus muscle due to removal of mechanical cues during postnatal development. An intramuscular injection of botulinum toxin type A (BTX) was used to induce and maintain paralysis in the left shoulders of mice since birth while the right shoulders received saline and served as contralateral controls. A separate group of animals was allowed to develop normally without any injections. Muscles were examined postnatally at various time points. The maximum isometric tetanic force generated by the muscle was significantly reduced in the BTX group compared to saline and normal groups. The paralyzed muscles were smaller and showed significant muscle atrophy and fat accumulation on histologic evaluation. Myogenic genes myogenin, myoD1, myf5, myf6 and fast type II myosin heavy chain (MHC) isoform were significantly upregulated while slow type I MHC isoform was significantly downregulated in the BTX group. Adipogenic genes C/EBPα, PPARγ2, leptin and lipoprotein lipase were significantly upregulated in the BTX group. Results indicate that reduced muscle loading secondary to BTX-induced paralysis leads to fat accumulation and muscle degeneration in the developing muscle. Understanding the molecular and compositional changes in developing supraspinatus muscles may be useful for identifying and addressing the pathological changes that occur in shoulder injuries such as neonatal brachial plexus palsy.
INTRODUCTION
Mechanical loading is critical for the development and maintenance of musculoskeletal tissues such as tendon, bone and muscle. In the absence of loading, muscles undergo atrophy and degeneration in addition to alteration in composition and mechanical properties.1,2 Shoulder paralysis in infants due to neonatal brachial plexus palsy leads to atrophy and fat accumulation of the rotator cuff muscles and shoulder joint deformities that manifest during early childhood development.3,4 We previously developed an animal model of neonatal brachial plexus palsy using botulinum toxin A induced shoulder muscle paralysis in neonatal mice.5,6 Paralysis of neonatal mouse shoulders by botulinum toxin type A resulted in delay in tendon entheses maturation, bone and joint deformities of the shoulder and elbow, and atrophy and fat accumulation in the developing supraspinatus muscle. Muscle unloading due to surgical denervation, physical immobilization or chemodenervation lead to activation of myogenic and adipogenic differentiation programs.7–9 In addition, a decrease in fiber diameter, increase in fat content and change in fiber type in juvenile and adult muscles has also been observed.10,11 However, few studies have tried to characterize the progression of postnatal physiological and molecular changes during postnatal rotator cuff muscle pathology associated with conditions such as neonatal brachial plexus palsy. The objective of this study was to evaluate the effect of chemodenervation on the postnatal development of the supraspinatus muscle of the shoulder. We hypothesized that supraspinatus muscle unloading resulting from botulinum toxin induced paralysis would lead to morphological, functional, and compositional changes in the muscle. We further hypothesized the paralysis would activate molecular signaling pathways to downregulate myogenic differentiation and upregulate adipogenic differentiation during postnatal development.
METHODS
Animal model
All procedures were approved by the Division of Comparative Medicine at Washington University. Ninety five CD-1 strain mice were used for this study. The supraspinatus muscle of the left shoulders of 67 neonatal CD-1 mice were injected with 10µL of 0.2U of Botulinum toxin A (Allergan Inc) using a 30-gauge needle. The first dose was administered within 24 hours of birth (‘BTX’ muscles). Subsequently, the injections were repeated twice a week for the first 28 days and once a week thereafter until sacrifice. This dosing regimen was based on previous work defining recovery time after single Botulinum toxin A injection in neonatal muscle.6 The supraspinatus muscle of the right shoulders received injections with an equal volume of saline and served as paired contralateral controls (‘Saline’ muscles). A separate group of 28 animals was allowed to develop without any treatment (‘Normal’ muscles). Animals were euthanized via CO2 narcosis followed by a thoracotomy.
Assessment of muscle paralysis
Contractile force of the supraspinatus muscle was measured at 28 day and 56 days (N=6–7 per group) for BTX, Saline and Normal muscles ex vivo using standard techniques.12 With the animal under isofluorane anesthesia, the supraspinatus muscle was dissected keeping its broad origin in the supraspinatus fossa of the scapula intact. Muscles were weighed and the resting length (LR) was measured with digital calipers. Silk sutures (6-0) were used to make loops on the distal end (attached to the tendon) and on the proximal end (attached to part of the scapula) and the muscle was aligned vertically in between the arms of a platinum electrode in a double-chambered tissue bath system (Radnoti Glass Technology, CA) filled with oxygenated Ringer’s lactate solution (6g/L NaCl, 3.1 g/L C3H5NaO3, 0.3g/L KCl and 0.2g/L CaCl2·2H2O) at 37°C. The muscle was stimulated by a square wave pulse stimulator (Model S48, Grass Technologies, RI). Isometric force was measured using a force transducer (Model FT03, Grass Technologies, RI) with an amplifier (Model P11T, Grass Technologies, RI). Measurements were performed at the optimal muscle length (LO) and using supramaximal stimulation voltage. A range of stimulus intensities (10–150 Hz) was used to determine the mechanical response of the BTX, Saline, and Normal supraspinatus muscles, with one minute of rest between stimulations. The maximum isometric tetanic forces of the BTX, Saline, and Normal muscles were obtained from the peak of the force-frequency curves. All results are expressed as mean ± standard deviation.
Real-time PCR
Animals were sacrificed at 7, 14, 21, 28 and 56 days postnatally for mRNA expression studies. The supraspinatus muscles were dissected, frozen immediately using liquid nitrogen (N=6 for BTX and Saline and N=3 for Normal muscles), and stored at −80°C. Total RNA was isolated using the TRIspin method.13 Briefly, the muscles were homogenized in Trizol (Invitrogen, CA) and RNA was extracted using an RNeasy mini kit and DNase I (Qiagen, CA). RNA yield was quantified using a spectrophotometer (NanoDrop, Thermo Scientific, DE) and quality analysis was performed using gel electrophoresis. One µg RNA was reverse transcribed to cDNA (Retroscript RT kit, Ambion, TX). Real time PCR reactions were performed using Sybr Green chemistry (7300, Applied Biosystems, CA). Forward and reverse primers for real-time PCR were custom designed and sequenced (Table 1). The target genes examined are summarized in Table 1. Results were expressed as fold change (BTX/Saline) and were calculated using the Delta Delta Ct method. Comparison of gene expression of BTX and Saline muscles to Normal muscles was also performed and the data is presented in the supplemental document. All results are expressed as mean ± standard deviation.
Table 1.
Forward and reverse sequences of primers for myogenic and adipogenic genes used for RT-PCR.
| Gene category | Gene name | Accession # | Primer sequence |
|---|---|---|---|
| Myogenic transcription factors | Myogenin | D90156 | F: ACCGTTTGAGAGACATGAGTGCC |
| R: ACAAAGCACTGGAAGGTTCCCAAG | |||
| MyoD1 | M18779 | F: GTGCATTCCAACCCACAGAACCTT | |
| R: TGCTGTCTCAAAGGAGCAGAGAGA | |||
| Myf5 | NM_008656 | F: CCCGAAAGAACAGCAGCTTTGACA | |
| R: AGACGTGATCCGATCCACAATGCT | |||
| Myf6 | NM_008657 | F: AAATCAACGAAGCCTTTGAGGCCC | |
| R: AGCTCCTGCATCTTCTCTTGCTGA | |||
| GEFT | AF487515 | F: TTAAGTTGCCTACGACCTGCACCT | |
| R: TCGGATGCTTTCCTCTCCGTCTTT | |||
| Muscle fiber type | Myh4 (fast type IIb) | NM_010855 | F: TTTCTTTAAAGCCGGCCTGTTGGG |
| R: TTTCACATTCATGAAGGCGCGGAC | |||
| Myh7 (slow type I) | NM_080728 | F: ACAAGAAGGAGGGCATTGAGTGGA | |
| R:TCGAGGCTTCTGGAAGTTGTTGGA | |||
| Adipogenic transcription factors | C/EBPα | NM_007678 | F: AAAGCCAAGAAGTCGGTGGACAAG |
| R: TGCGTTGTTTGGCTTTATCTCGGC | |||
| PPARγ2 | U01664 | F: ACATAAAGTCCTTCCCGCTGACCA | |
| R: AAATTCGGATGGCCACCTCTTTGC | |||
| Adipogenic markers | Lipoprotein Lipase | NM_008509 | F: ATGCAACATTGGAGAAGCCATCCG |
| R: TTGGAGTTGCACCTGTATGCCTTG | |||
| Leptin | NM_008493 | F: TGCTGAAGTTTCAAAGGCCACCAG | |
| R: ATGCCTTTGGATGGGTGGTCTACA | |||
| GLUT4 | AF098634 | F: TCGTGGCCATATTTGGCTTTGTGG | |
| R: TAAGGACCCATAGCATCCGCAACA | |||
| Housekeeping gene | GAPDH | NM_008509 | F: TCAACAGCAACTCCCACTCTTCCA |
| R: ACCCTGTTGCTGTAGCCGTATTCA |
Histology and Immunohistochemistry
Supraspinatus muscles were weighed, fixed in 4% paraformaldehyde, embedded in OCT, and sectioned on a cryostat (5 µm). Sections were stained with Hematoxylin and Eosin for qualitative assessment of muscle fibers. Oil red O was used to assess the presence of fat. Masson’s trichrome stain was used to identify fibrotic tissue. Immunohistochemistry was performed for fast type II MHC isoform, slow type I MHC isoform, and C/EBPα using fluorescence labeling methods. Laminin was used to visualize muscle fiber outlines. Muscle sections were heated in sodium citrate buffer for 10 minutes (97°C) in a decloaking chamber to facilitate epitope retrieval. Sections were incubated with blocking solution (10% goat serum) for 1 hour followed by a primary antibody for fast type II MHC isoform (mouse-anti-human Myh4, 1:25 dilution, sc-58797, Chemicon International), slow type I MHC isoform (mouse-anti-human Myh7, 1:50 dilution, cat# M8421, Sigma) or C/EBPα (rabbit-anti-human, 1:50 dilution, sc-61; Chemicon International) overnight. After washing, sections for type I and type II MHC isoforms were incubated with DyLight 549-conjugated goat-anti-mouse IgG (1:100 dilution, 115-505-146, Jackson Immunoresearch) and sections for C/EBPα were incubated with DyLight 488-conjugated goat-anti-rabbit IgG (1:100 dilution, 111-485-144, Jackson Immunoresearch) for 1 hour. The sections were then incubated with rabbit-anti-mouse primary antibody for laminin (1:100 dilution, AB2034, Millipore) for 1 hour, washed, and then incubated with DyLight 488-conjugated goat-anti-rabbit IgG (1:100 dilution, 111-485-144, Jackson Immunoresearch) for 1 hour. All sections were then counterstained with 4',6-diamidino-2-phenylindole (DAPI, D1306, Invitrogen) to visualize cell nuclei. Fluorescent microscopy was used to visualize immunofluorescence.
Statistical methods
Statistical analyses were performed using SYSTAT 12 (Systat Software Inc, IL). An analysis of variance (ANOVA) followed by Fisher’s least square differences post-hoc analysis was performed to compare BTX, Saline and Normal muscles. Paired t-tests were used to compare BTX and contralateral Saline muscles within a group. To test for a significant trend over time, the natural logarithm of the fold change in gene expression (ratio of BTX to Saline) was used to perform an ANOVA with planned polynomial contrasts. Significance for all outcome measures was set at p<0.05.
RESULTS
Effect of sustained paralysis on muscle development and function
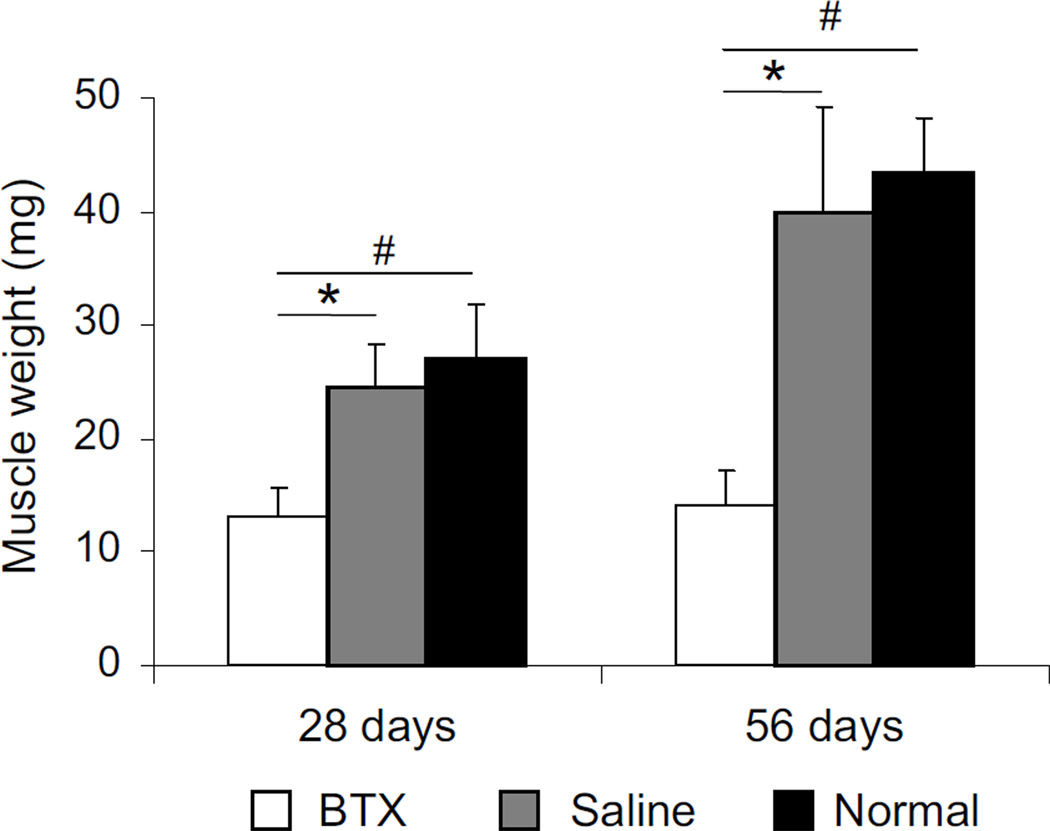
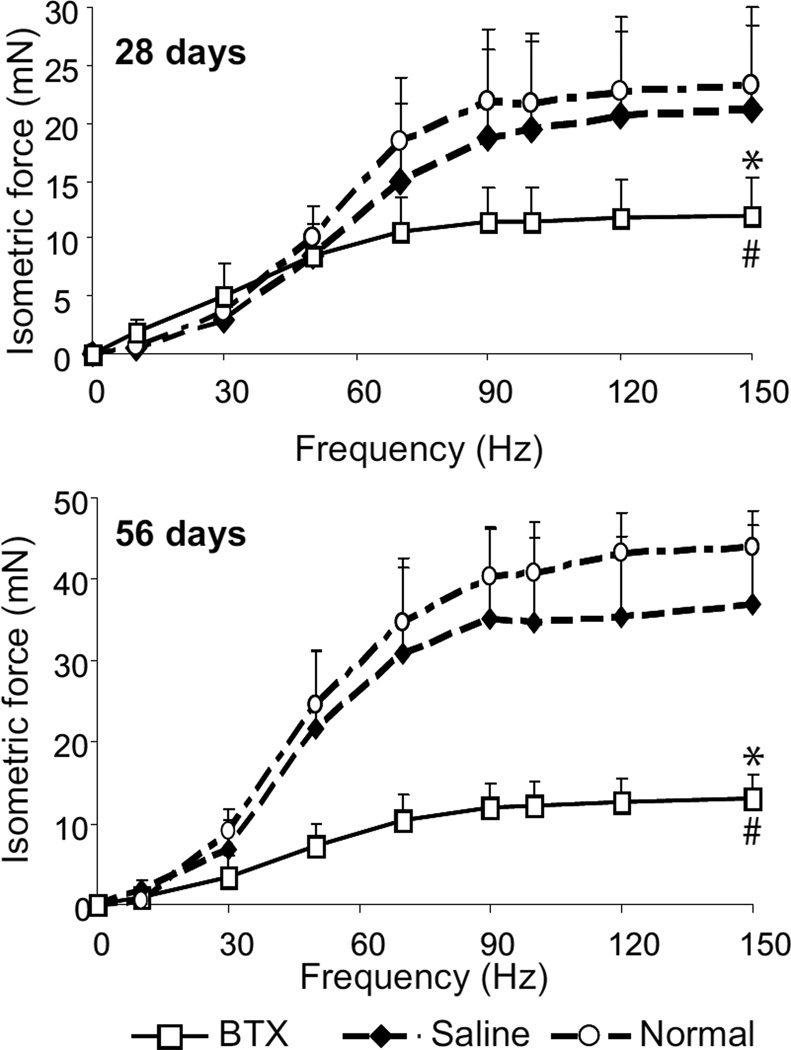
The botulinum toxin A injected shoulders (BTX) showed signs of paralysis within twelve hours of injection, evidenced by decreased ranges of motion of abduction and external rotation. The average weight of the BTX muscles was 46.5% and 51.2% at 28 days and 64.2% and 67.2% lower at 56 days than contralateral Saline muscles and Normal muscles, respectively (p<0.001) (Figure 1). Muscle weight increased significantly over time in Saline and Normal muscles (p<0.001) but not in the BTX muscles. The maximum isometric tetanic force generated by the BTX muscles was 43.7% and 48.8% lower, respectively, than Saline and Normal muscles at 28 days postnatally (p<0.001) (Figure 2). At 56 days, the maximum isometric tetanic force of the BTX muscles was 64.3% and 70% lower, respectively than Saline muscles and Normal muscles (p<0.01), indicating progressively weaker contractile activity of muscle fibers over time. The force was not significantly different between Saline and Normal muscles at either timepoint. The force generated by the Saline and Normal muscles were significantly higher at 56 days compared to 28 days (p<0.05), but no increase in force was observed for the BTX muscles.
Figure 1.
Muscle weights were significantly lower for the BTX muscles compared to Saline (S) and Normal (N). (* p <0.05, paired t-test, BTX vs. Saline; # p <0.05, BTX or Saline vs. Normal).
Figure 2.
Maximum isometric tetanic force of BTX muscles was significantly lower compared to Saline and Normal. (* p <0.05, paired t-test, BTX vs. Saline; # p <0.05, BTX or Saline vs. Normal).
Effect of sustained paralysis on gene expression
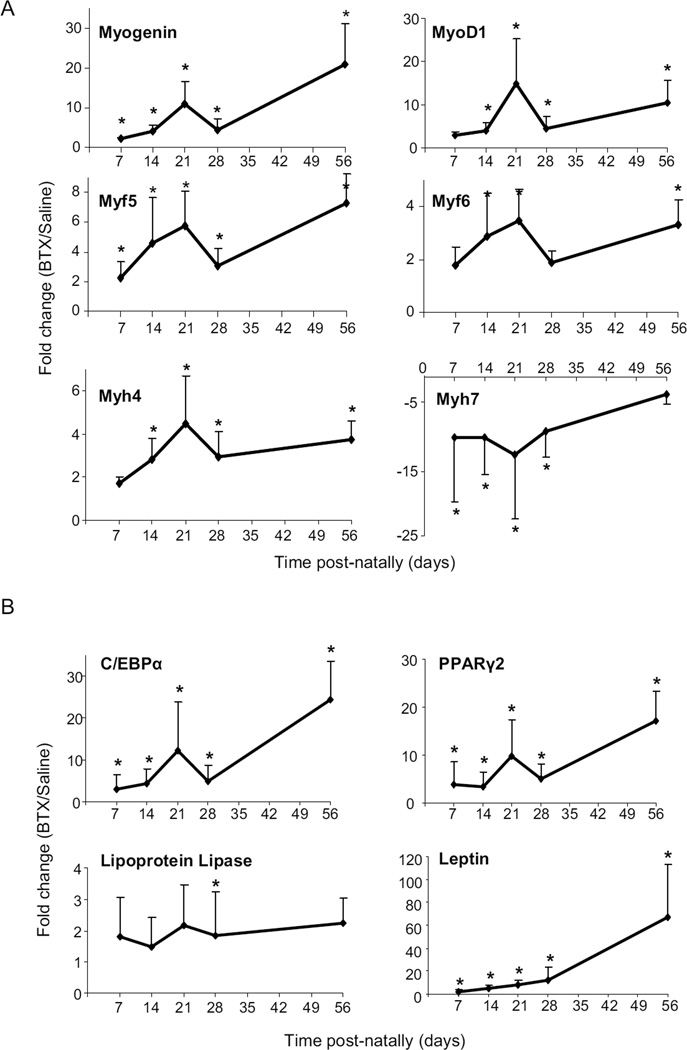
Data comparing BTX and Saline muscles to Normal muscles can be found in the supplemental document. Myogenic transcription factors myogenin and Myf5 were upregulated by several fold in the BTX muscles compared to Saline muscles (Figure 3a) and Normal muscles at all time points (p<0.01). MyoD1 and Myf6 were upregulated in the BTX muscles compared to Saline and Normal muscles at most timepoints (p<0.05). The fast type II MHC isoform was significantly downregulated (indicated by negative fold change) in the BTX muscles at 14–56 days postnatally (p<0.01) while the slow type I MHC isoform was significantly upregulated in the BTX muscles at the same timepoints compared to Saline muscles (Figure 3a) (p<0.05). When comparing Saline and Normal muscles, myogenin was upregulated in Saline muscles from 21 day onwards, while the fast type II MHC isoform was downregulated in Saline muscles at 28 and 56 days (p<0.05). The expression of MyoD1, Myf5 and Myf6 were significantly upregulated in Saline muscles compared to Normal muscles at 28 days. The expression of slow type I MHC isoform was significantly upregulated in Saline muscles compared to Normal muscles at 14 days. The expression of all myogenic genes except slow type I MHC isoform showed a significant trend for increasing over time in the BTX muscles compared to Saline muscles (p<0.01). No change in expression of GEFT was detected.
Figure 3.
Myogenic transcription factors were significantly upregulated in BTX muscles compared to Saline at all timepoints. Myh4 was significantly downregulated while Myh7 was significantly upregulated in BTX muscles compared to Saline (a). Adipogenic transcription factors and markers were significantly upregulated in BTX muscles compared to Saline muscles at all time points (b). (* p <0.05, paired t-test, BTX vs. Saline).
Adipogenic transcription factors C/EBPα and PPARγ2 were significantly upregulated in the BTX muscles compared to the Saline muscles (Figure 3b) at all time points (p<0.001). C/EBPα expression was 25-fold higher at 56 days in BTX muscles compared to Saline muscles. Similarly, PPARγ2 expression was 4.5-fold higher at 7 days and 15-fold at 56 days in BTX muscles. When compared to Normal muscles, C/EBPα was significantly upregulated at most timepoints in the BTX muscles. The adipogenic marker Leptin was significantly upregulated in the BTX muscles compared to Saline muscles (Figure 3b) at all time points and at Days 14, 28 and 56 compared to Normal muscles (p<0.05). Although expression of Lipoprotein lipase was slightly elevated in BTX muscles, it was not significantly different from Saline or Normal muscles except at 28 days (p<0.05). Expression of C/EBPα, PPARγ2, Leptin and Lipoprotein lipase were not significantly different in Saline muscles compared to Normal muscles. Expression of all adipogenic genes except Lipoprotein lipase showed a significant trend for increasing over time in the BTX muscles compared to contralateral Saline muscles (p<0.01). No changes were detected in GLUT4 expression. The expression of the housekeeping gene GAPDH did not change with either time or treatment.
Effect of sustained paralysis on muscle morphology and protein expression
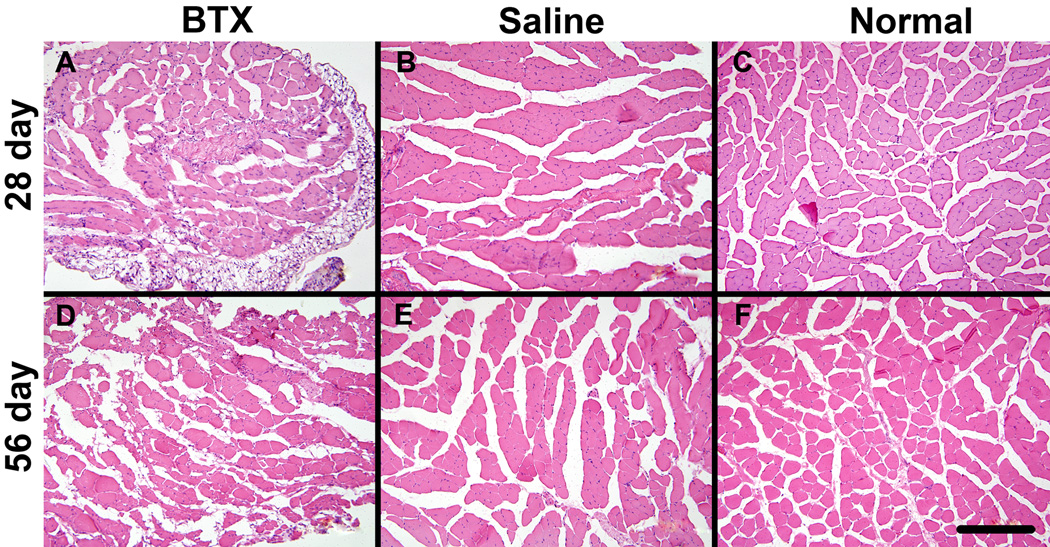
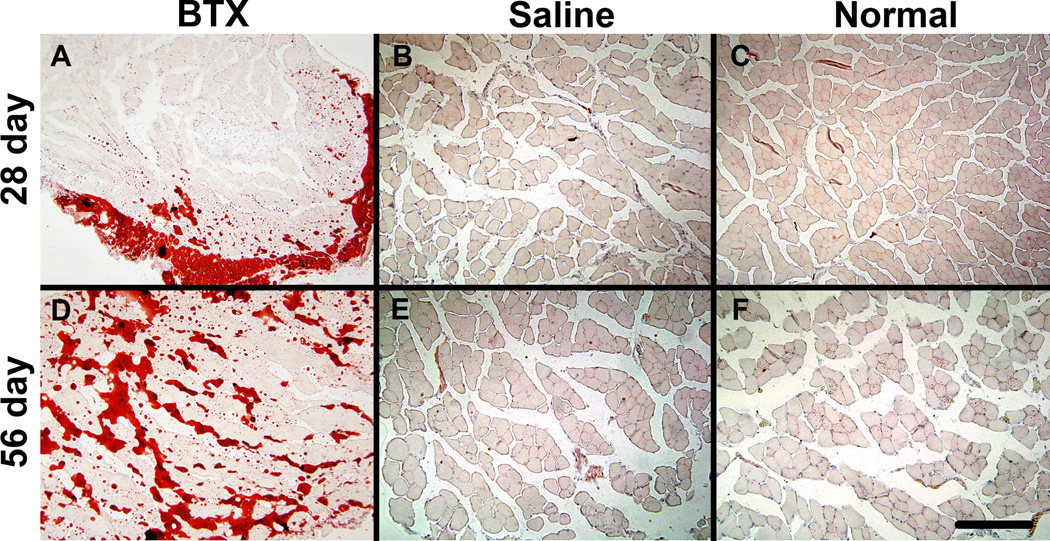
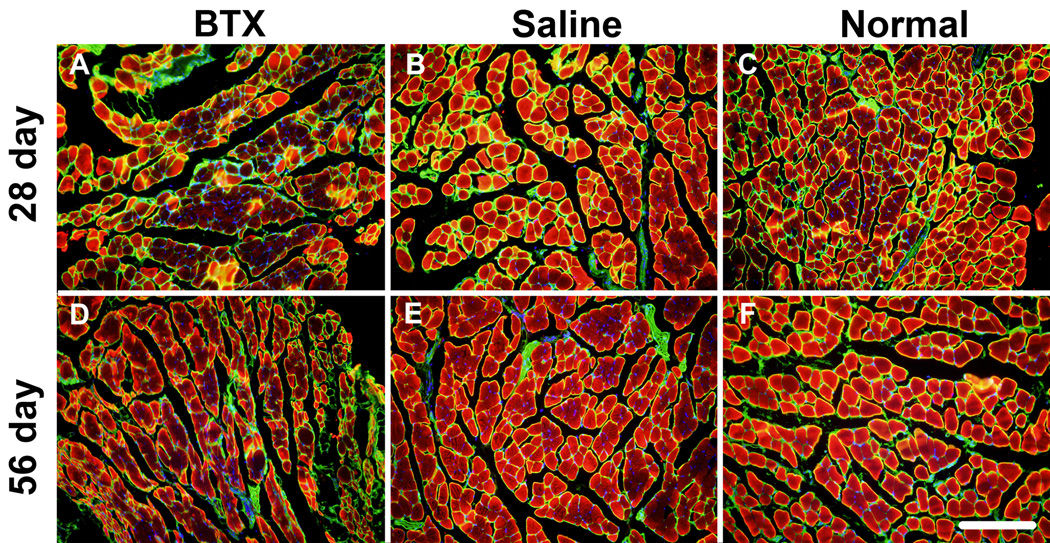
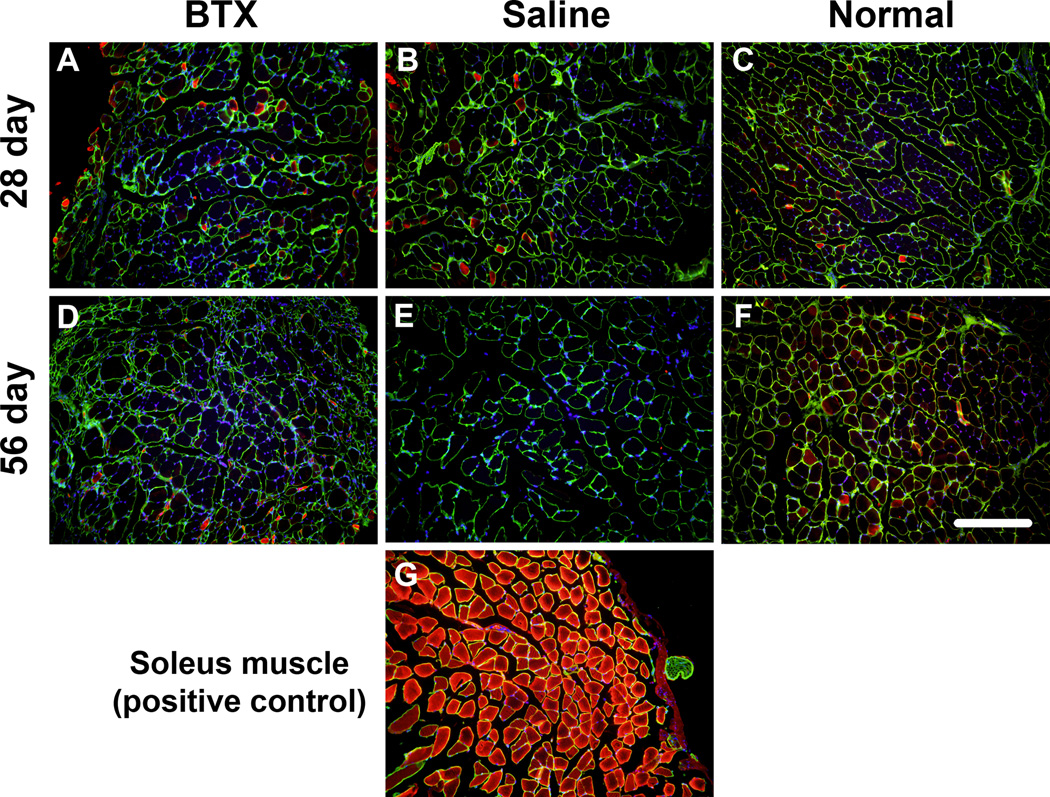
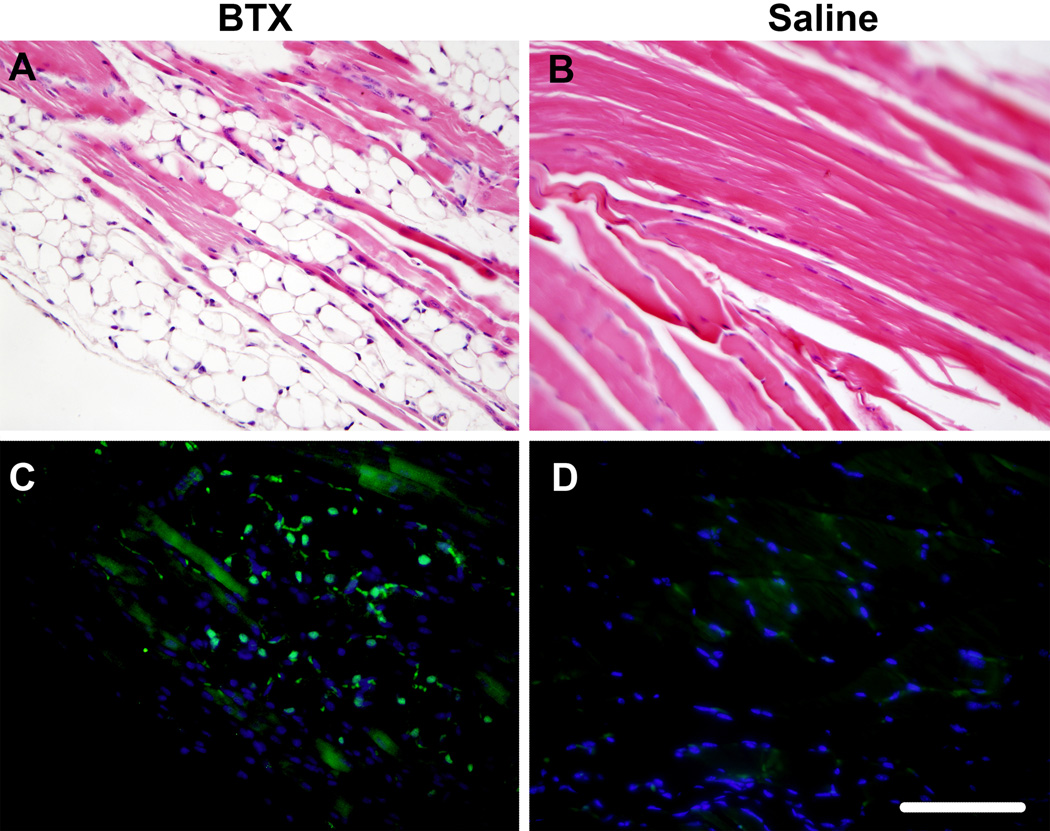
The BTX muscles exhibited severe atrophy compared to the Saline and Normal muscles (Figure 4). Evidence of fibrotic tissue was seen within the BTX muscles. The BTX muscles showed presence of adipocytes and oil red O staining revealed accumulation of fat in the perimysial and endomysial spaces (Figure 5). Levels of atrophy, fibrotic, and fat increased with time. Immunofluorescence staining for fast type II MHC isoform showed fewer positive fibers in the BTX muscles compared to the Saline and Normal muscles (Figure 6). Minimal staining for slow type I MHC isoform was observed in the Normal and Saline muscles (Figure 7). A few fibers in the BTX muscles were positive for slow type I MHC isoform at 56 days. A positive control for type I MHC isoform using the same primary and secondary antibodies (mouse soleus muscle, ~50% type I fibers14) verified the specificity of the staining. These results indicate a higher ratio of fast-twitch type II fibers to slow twitch type I fibers in the developing mouse supraspinatus muscle. Immunofluorescence staining for C/EBPα showed its nuclear localization in adipocytes in the BTX muscles at 56 days (Figure 8), whereas no C/EBPα expression was detected in the Saline muscles.
Figure 4.
BTX muscles (A, D) showed significant atrophy at 28 days (top panel) and 56 days (bottom panel) compared to Saline (B, E) and Normal muscles (C, F) in cross-sections of muscles stained with hematoxylin and eosin (20× objective, scale bar = 200 µm).
Figure 5.
Oil Red O staining indicated fat accumulation in the BTX muscles (A, D) at 28 days (top panel) and 56 days (bottom panel) compared to Saline (B, E) and Normal muscles (C, F) Note the dark staining fat in the BTX group at the periphery of the muscle at 28 days and between muscle fibers at 56 days (20× objective, scale bar = 200 µm).
Figure 6.
Fewer muscle fibers stained for fast-twitch Myh4 (type IIb) protein in BTX muscles (A, C) compared to Saline (B, E) and Normal muscles (C, F) at 28 days (top panel) and 56 days (bottom panel) (Myh4 – red, Laminin – green, nuclei – blue) (20× objective, scale bar = 200 µm).
Figure 7.
Supraspinatus muscles did not indicate presence of slow-twitch Myh7 (type I) in the BTX (A, C), Saline (B, E) and Normal muscles (C, F) at 28 days (top panel) and 56 days (bottom panel). The same antibody stained Myh7 fibers in the mouse soleus muscle (G) (Myh7 – red, Laminin – green, nuclei – blue) (20× objective, scale bar = 200 µm).
Figure 8.
C/EBPα protein (green) was localized to the nuclei of adipocytes in the perimyseal space of BTX muscles (C). Saline muscles (D) did not express C/EBPα. Hematoxylin and eosin sections of the same regions in brightfield are shown in the top panel (A, B) (40× objective, scale bar = 100 µm).
DISCUSSION
Previous studies showed that botulinum toxin induced supraspinatus muscle paralysis in neonatal mice successfully simulated the clinical condition of neonatal brachial plexus palsy.5,6 Removal of loading by paralysis of the supraspinatus muscle impaired bone formation, prevented the formation of a fibrocartilaginous transition region between tendon and bone and resulted in a number of shoulder joint deformities.5 It was also noted that sustained paralysis of neonatal muscles led to a significant decrease in muscle size and the accumulation of fat.6 In the present study, we showed that chemodenervation of the neonatal supraspinatus muscle significantly affected the development of the muscle and induced pathological changes in muscle consistent with those observed in neonatal brachial plexus palsy.15 Muscle atrophy, intramuscular accumulation of fat, and changes in gene expression followed similar trends to those after surgical denervation of the neonatal supraspinatus muscle16.
Sustained local paralysis of the botulinum toxin A injected shoulders was observed at all time points since birth, while the contralateral saline injected shoulders were fully functional. The pharmacokinetics of botulinum toxin A in neonatal mice is different than that in adult mice.17 The duration of the effect in our studies lasted approximately 3 to 7 days in neonatal mice.5,6 The reason for this shortened effect of toxin in neonatal mice is not known, but studies suggest that it could be the result of more rapid generation of new nerve terminals in younger animals.17 Therefore, repeated injections of botulinum toxin A were necessary to maintain shoulder paralysis in the mice of the current study. The paralysis led to decreased muscle weight (i.e., atrophy) leading to reduced force generation, consistent with other studies.17–19
There were dramatic molecular changes associated with the paralysis of the supraspinatus muscle. Upregulation of both adipogenic and myogenic programs was observed in the BTX muscles. The molecular and cellular mechanisms during embryonic myogenesis and muscle regeneration have been well documented.20,21 Myogenic regulatory factors (MRFs) play an important role in lineage determination of multipotential mesodermal stem cells into myocytes. Upregulation of Myogenin and MRF4 by satellite cells have been observed after surgical denervation or chemodenervation of skeletal muscles.22,23 More recently, a study investigating the effect of surgical denervation of neonatal shoulder muscles showed a dramatic increase in the expression of Myogenin, MyoD1, Myf5 and Myf6.16 These genes influence downstream pathways such as expression of nAChR and MuSK to promote neuromuscular junction stabilization. The upregulation of these myogenic regulatory factors in the BTX muscles could be an indication of activation of cellular mechanisms to promote muscle repair and functional recovery. The current study showed a dramatic downregulation in signals for fast type II MHC isoform in the developing supraspinatus muscle and a slight elevation in expression of slow type I MHC isoform, consistent with observations from surgical denervation of the developing supraspinatus muscle.16 The protein expression of fast type II MHC isoform was also lower in BTX muscles compared to Saline and Normal muscles. A recent study showed that changes in function of the acetylcholine receptors could induce shifts in muscle fiber composition.24 We did not examine the proportion of other types of MHC isoforms (for example, type IIa, IId, IIx, neonatal) in the supraspinatus muscle in this study. However, it has been shown that normal rat supraspinatus muscle is composed primarily of fast type IIb fibers in the superficial layers and a mixture of type IIb, type IIa/x and type I fibers in the deep layers.10
Upregulation in adipogenic transcription factors and markers in the developing supraspinatus muscle in our study indicates that botulinum toxin induced paralysis activates adipogenic pathways in the muscle. Progressive fat accumulation has also been observed in surgically denervated supraspinatus muscle16 and in other myopathies such as Duchenne muscular dystrophy.25 The dramatic increase in mRNA expression for C/EBPα and PPARγ2 in the BTX muscles is indicative of activation of an adipogenic differentiation program in the muscle. Although the exact origin of cells that increase mRNA expression of these adipogenic transcription factors was unclear, we speculate that satellite cells within the muscle could play an important role. Satellite cells have been shown to exhibit myogenic, adipogenic, and osteogenic differentiation potential.26 C/EBPα and PPARγ2 in turn, activate expression of several other adipocyte-specfic genes such as aP2 promoter gene and FABP4 and increase preadipocyte proliferation and differentiation into adipocytes.9 However, the exact mechanisms of adipogenic transcriptional regulation and the origin of the adipocytes in the denervated muscles remain unclear.
The presence of adipocytes and fat in the muscles injected with Botulinum toxin was apparent in stained histologic sections. We noted that the distribution of fat in the muscle was primarily in the perimysial space of the muscle with some fat present in the endomysial space as well. Although the location of adipocytes can be easily identified, it is unclear whether they differentiated from activated satellite cells present within the muscle or from other precursor cells that migrated into the area. The nuclear localization of C/EBPα indicates that the adipogenic differentiation program was well under way, as its expression is induced in the later stages of adipocyte differentiation. C/EBPα expression therefore confirms the presence of cells undergoing terminal differentiation into adipocytes in the perimysial space of BTX muscles.
There are a number of limitations to our study. First, the physiological cross-sectional area of supraspinatus muscles was not used to normalize muscle force. Supraspinatus muscle has a complex architecture with varying pennation angles of fibers throughout the muscle.27 In addition, the muscle cross-sections in the BTX group had significant amounts of adipose and fibrotic tissue. A simple force normalization using tissue cross-sectional area would therefore be inappropriate. Second, although the study examines the molecular changes in the developing supraspinatus muscle, the cellular localization of the myogenic and adipogenic markers remains unclear. We did not look at the activity of satellite cells and their role in the myogenic and adipogenic pathways during postnatal muscle development. In order to maintain muscle paralysis in the developing muscles, repeated injections of botulinum toxin were necessary. However, the injections themselves were not physically damaging, as the Saline muscles, which were also injected repeatedly, did not show any significant changes compared to Normal muscles.
In conclusion, our study demonstrated important roles for innervation and mechanical loading during supraspinatus muscle development in the shoulder. Paralyzed supraspinatus muscles displayed atrophy and fat accumulation leading to reduced force generation capacity. These changes were due, in part, to changes in myogenic and adipogenic gene expression secondary to paralysis. Understanding the mechanisms of muscle degeneration due to denervation and unloading in developing muscles may be useful for addressing the pathological changes that occur in the shoulder in conditions such as neonatal brachial plexus palsy.
Supplementary Material
ACKNOWLEDGMENTS
The authors thank Dr. Chanteak Lim and Weichi Chen for assistance with the muscle force experiments. This study was supported by a grant from the National Institutes of Health (R01 AR055580).
REFERENCES
- 1.Guillot C, Steinberg JG, Delliaux S, et al. Physiological, histological and biochemical properties of rat skeletal muscles in response to hindlimb suspension. J Electromyogr Kinesiol. 2008;18:276–283. doi: 10.1016/j.jelekin.2006.10.001. [DOI] [PubMed] [Google Scholar]
- 2.Ohira Y, Yoshinaga T, Ohara M, et al. The role of neural and mechanical influences in maintaining normal fast and slow muscle properties. Cells Tissues Organs. 2006;182:129–142. doi: 10.1159/000093963. [DOI] [PubMed] [Google Scholar]
- 3.Hoeksma AF, Ter Steeg AM, Dijkstra P, et al. Shoulder contracture and osseous deformity in obstetrical brachial plexus injuries. J Bone Joint Surg Am. 2003;85-A:316–322. doi: 10.2106/00004623-200302000-00020. [DOI] [PubMed] [Google Scholar]
- 4.Poyhia TH, Koivikko MP, Peltonen JI, et al. Muscle changes in brachial plexus birth injury with elbow flexion contracture: an MRI study. Pediatr Radiol. 2007;37:173–179. doi: 10.1007/s00247-006-0374-0. [DOI] [PubMed] [Google Scholar]
- 5.Kim HM, Galatz LM, Patel N, et al. Recovery potential after postnatal shoulder paralysis. An animal model of neonatal brachial plexus palsy. J Bone Joint Surg Am. 2009;91:879–891. doi: 10.2106/JBJS.H.00088. [DOI] [PubMed] [Google Scholar]
- 6.Thomopoulos S, Kim HM, Rothermich SY, et al. Decreased muscle loading delays maturation of the tendon enthesis during postnatal development. J Orthop Res. 2007;25:1154–1163. doi: 10.1002/jor.20418. [DOI] [PubMed] [Google Scholar]
- 7.Hyatt JK, Roy RR, Baldwin KM, Edgerton VR. Nerve activity-independent regulation od skeletal muscle atrophy: role of MyoD and myogenin in satellite cells and myonuclei. Am J Physiol Cell Physiol. 2003;285:1161–1173. doi: 10.1152/ajpcell.00128.2003. [DOI] [PubMed] [Google Scholar]
- 8.Hyatt JK, Roy RR, Baldwin KM, et al. Activity-unrelated neural control of myogenic factors in slow muscle. Muscle Nerve. 2006;33:49–60. doi: 10.1002/mus.20433. [DOI] [PubMed] [Google Scholar]
- 9.Wagatsuma A. Upregulation of gene encoding adipogenic transcriptional factors C/EBPalpha and PPARgamma2 in denervated muscle. Exp Physiol. 2006;91:747–753. doi: 10.1113/expphysiol.2006.033662. [DOI] [PubMed] [Google Scholar]
- 10.Barton ER, Gimbel JA, Williams GR, Soslowsky LJ. Rat supraspinatus muscle atrophy after tendon detachment. J Orthop Res. 2005;23:259–265. doi: 10.1016/j.orthres.2004.08.018. [DOI] [PubMed] [Google Scholar]
- 11.Legerlotz K, Matthews KG, McMahon CD, Smith HK. Botulinum toxin-induced paralysis leads to slower myosin heavy chain isoform composition and reduced titin content in juvenile rat gastrocnemius muscle. Muscle Nerve. 2009;39:472–479. doi: 10.1002/mus.21247. [DOI] [PubMed] [Google Scholar]
- 12.Lynch GS, Hinkle RT, Faulkner JA. Power output of fast and slow skeletal muscles of mdx (dystrophic) and control mice after clenbuterol treatment. Exp Physiol. 2000;85:295–299. [PubMed] [Google Scholar]
- 13.Reno C, Marchuk L, Sciore P, et al. Rapid isolation of total RNA from small samples of hypocellular, dense connective tissues. Biotechniques. 1997;22:1082–1086. doi: 10.2144/97226bm16. [DOI] [PubMed] [Google Scholar]
- 14.Asmussen G, Marechal G. Maximal shortening velocities, isomyosins and fibre types in soleus muscle of mice, rats and guinea-pigs. J Physiol. 1989;416:245–254. doi: 10.1113/jphysiol.1989.sp017758. [DOI] [PMC free article] [PubMed] [Google Scholar]
- 15.Poyhia TH, Nietosvaara YA, Remes VM, et al. MRI of rotator cuff muscle atrophy in relation to glenohumeral joint incongruence in brachial plexus birth injury. Pediatr Radiol. 2005;35:402–409. doi: 10.1007/s00247-004-1377-3. [DOI] [PubMed] [Google Scholar]
- 16.Kim HM, Galatz LM, Das R, et al. Musculoskeletal deformities secondary to neurotomy of the superior trunk of the brachial plexus in neonatal mice. J Orthop Res. 2010 doi: 10.1002/jor.21128. Epub ahead of print. [DOI] [PMC free article] [PubMed] [Google Scholar]
- 17.Bambrick LL, Gordon T. Comparison of the effects of botulinum toxin in adult and neonatal rats: neuromuscular blockade and toxicity. Can J Physiol Pharmacol. 1989;67:879–882. doi: 10.1139/y89-137. [DOI] [PubMed] [Google Scholar]
- 18.Billante CR, Zealear DL, Billante M, et al. Comparison of neuromuscular blockade and recovery with botulinum toxins A and F. Muscle Nerve. 2002;26:395–403. doi: 10.1002/mus.10213. [DOI] [PubMed] [Google Scholar]
- 19.Stone AV, Ma J, Whitlock PW, et al. Effects of Botox and Neuronox on muscle force generation in mice. J Orthop Res. 2007;25:1658–1664. doi: 10.1002/jor.20450. [DOI] [PubMed] [Google Scholar]
- 20.Grefte S, Kuijpers-Jagtman AM, Torensma R, Von den Hoff JW. Skeletal muscle development and regeneration. Stem Cells Dev. 2007;16:857–868. doi: 10.1089/scd.2007.0058. [DOI] [PubMed] [Google Scholar]
- 21.Tajbakhsh S, Buckingham M. The birth of muscle progenitor cells in the mouse: spatiotemporal considerations. Curr Top Dev Biol. 2000;48:225–268. doi: 10.1016/s0070-2153(08)60758-9. [DOI] [PubMed] [Google Scholar]
- 22.Shen J, Ma J, Lee C, et al. How muscles recover from paresis and atrophy after intramuscular injection of botulinum toxin A: Study in juvenile rats. J Orthop Res. 2006;24:1128–1135. doi: 10.1002/jor.20131. [DOI] [PubMed] [Google Scholar]
- 23.Adams L, Carlson BM, Henderson L, Goldman D. Adaptation of nicotinic acetylcholine receptor, myogenin, and MRF4 gene expression to long-term muscle denervation. J Cell Biol. 1995;131:1341–1349. doi: 10.1083/jcb.131.5.1341. [DOI] [PMC free article] [PubMed] [Google Scholar]
- 24.Jin TE, Wernig A, Witzemann V. Changes in acetylcholine receptor function induce shifts in muscle fiber type composition. Febs J. 2008;275:2042–2054. doi: 10.1111/j.1742-4658.2008.06359.x. [DOI] [PubMed] [Google Scholar]
- 25.Dulor JP, Cambon B, Vigneron P, et al. Expression of specific white adipose tissue genes in denervation-induced skeletal muscle fatty degeneration. FEBS Lett. 1998;439:89–92. doi: 10.1016/s0014-5793(98)01216-2. [DOI] [PubMed] [Google Scholar]
- 26.Asakura A, Komaki M, Rudnicki M. Muscle satellite cells are multipotential stem cells that exhibit myogenic, osteogenic, and adipogenic differentiation. Differentiation. 2001;68:245–253. doi: 10.1046/j.1432-0436.2001.680412.x. [DOI] [PubMed] [Google Scholar]
- 27.Roh MS, Wang VM, April EW, et al. Anterior and posterior musculotendinous anatomy of the supraspinatus. J Shoulder Elbow Surg. 2000;9:436–440. doi: 10.1067/mse.2000.108387. [DOI] [PubMed] [Google Scholar]
Associated Data
This section collects any data citations, data availability statements, or supplementary materials included in this article.


