Abstract
Nanoscale wells have been fabricated in a chip to construct a photonic crystal that is used for enhanced immunoassays of a common food-borne toxin, Staphylococcal enterotoxin B (SEB). The nanostructure of the photonic crystal (PC) in the array enhanced the fluorescent signal due to a guided mode resonance. Nanoparticles were used as the solid substrate for attachment of capture antibodies; the particles were then isolated in individual wells of the chip by using an electrophoretic particle entrapment system (EPES). The standard curve generated from the chip consisted of two log-linear regions: the first region with a greater sensitivity, limited by the Kd of the antibody, resembling the 96-well plate ELISA and the other that shows greater than six order of linearity extending to attomolar concentrations, which is unique to the device we have developed. SEB dissolved in phosphate buffered saline was resolved to levels as low as 35 aM with 106-fold better limit of detection than a conventional 96-well-ELISA. Different concentrations of SEB spiked into milk were tested to assess the reliability of the device and the efficacy of the extended log-linear regime in a “real” food matrix. The presence of the milk did not significantly alter the limit of detection. With very low amounts of sample (less than 10 µL) and fast read-out time, the PC-based system shows great promise for the detection of a wide range of target molecules with close to a single molecule level of sensitivity.
Keywords: nanowells, staphylococcal enterotoxin B (SEB), photonic crystal (PC), nanoparticle, guided mode resonance
INTRODUCTION
Food poisoning caused by bacterial toxins has been a persistent threat to human health. Staphylococcal enterotoxin B (SEB) is the most common bacterial toxin associated with food-related illness.1 SEB is one of the emetic enterotoxins excreted by the Staphylococcus aureus bacterium.2 The clinical symptoms after exposure to a threshold concentration of SEB (e.g. effective dose50 ~ 0.4 ng/mL) can be differentiated based on the route of exposure. Ingestion causes gastroenteritis, vomiting and diarrhea.3 Inhalation results in respiratory failure.4 In a severe case, SEB causes death when inhaled at very high doses (e.g. lethal dose50 ~ 20 ng/mL).5 Furthermore, SEB can be used as a biological warfare agent because it can be easily made into an aerosol; it is stable; and it can cause wide spread systemic damage.6 SEB may persist in contaminated foods even after the originating bacteria are killed by sterilization methods such as heating. For these reasons, there is a pressing need for a very sensitive, yet simple and portable, measurement system that can detect the presence of SEB.
Several methods have demonstrated the detection of SEB: piezo-crystal biosensors with limit of detection (LOD) of 2.5 µg/mL;7 surface plasmon resonance (LOD 0.5 ng/mL);8 latex agglutination assay (LOD 0.5 ng/mL);9 enzyme linked immunosorbent assay (ELISA; LOD 0.2 ng/mL);10 capillary biosensor with waveguide (LOD 30–50 pg/mL).11 Based on these reported measures of performance, the currently available biosensing methods have not shown significant enhancement compared to conventional laboratory-based immunoassays (e.g. ELISA) – the sensitivity of the methods has been limited to low pico-molar concentrations (based on the molecular weight of SEB of 28.5 kDa).12 For further enhancement in sensitivity, a piezoelectric-excited millimeter-sized cantilever sensor demonstrated an LOD of 2.5 fg/mL which corresponds to an attomolar level of detection.2 However, the cantilever sensor with gold surface needs to be changed after each experiment, and the method requires frequent calibration of the sensor. It also requires a self-assembled monolayer (SAM) process to coat biological reagents to the gold surface, rendering this particular technology unsuitable for a simple, rugged, fast and economical SEB sensor.
Fluorescence-based assays can offer good sensitivity – their sensitivity can be improved by using new advances in nanotechnology. A photonic crystal (PCs) is a nanostructured array that is able to boost the fluorescent signal from an immunocomplex, leading to a high signal to noise ratio. By engineering an array with a high refractive index-substrate and periodic modulation, an array with a PC-structure can enhance the excitation of fluorophores and extraction of the emitted signal simultaneously.13
In our previous study,14 we developed an advanced type of PC-nanostructured array with optimized phase matching by building a nanoparticle-based immunoplatform onto the surface of the PC. Sub-100 nm particles in nanowells are able to fully exploit the enhanced fluorescence excitation and extraction. We successfully demonstrated the ability to locate nanoparticles conjugated with biological reagent into their corresponding nano-scaled well based on their size by using an electrophoretic particle entrapment system.
In this study, we describe detection of SEB at attomolar levels in buffer by using 40 nm-particles with structured PC-array. To show reliability of the PC-nanostructured array for early detection of the target in a real food sample with ultrahigh sensitivity, the results obtained from SEB spiked in milk are compared with those obtained from SEB in buffer at low concentration (atto- to pico-molarity).
EXPERIMENTAL SECTION
Materials
Forty-nm, fluorescent, carboxylated polystyrene (PS)-nanoparticles (F-8789; ex: 660 nm/em: 680 nm) were purchased from Invitrogen (Carlsbad, CA). Whole milk was purchased from a local grocery store. Indium tin oxide (ITO) coated glass wafers (CG-81N-1515; resistance: 30–60 H) were purchased from Delta Technologies (Stillwater, MN). All chemicals used for fabrication of the arrays were obtained from the University of California Davis Northern California Nanotechnology Center: Acetone (Sigma-Aldrich, St. Louis, MO), lift off layer (LOL)-2000 (MicroChem, Newton, MA), 2% 950 polymethyl methacrylate (PMMA) A2 (MicroChem), 1:3 methyl isobutyl ketone (MIBK, Sigma-Aldrich), isopropyl alcohol (IPA, Mallinckrodt Baker) and CD-26 (tetramethylammonium hydroxide, MicroChem). 100 X-Infinity corrected objective lens (M Plan APO; NA: 0.7; working distance: 6.0 mm; focal length: 2mm) was purchased from Mitutoyo (Kawasaki; Japan). The beam-splitter (FF545/650-Dio1), 532 nm-long pass filter (BLP01-532R-25), 532 nm notch filter (NF01-532U-25) and 633 nm notch filter 9NF02-633S-25) were purchased from Semrock (Rochester, NY). The single photon counting-avalanche photodiode (SPAD; SPCMAQRH-13; dark count: 500 counts/s max) was purchased from PerkinElmer (Waltham, MA). SEB, mouse anti-SEB monoclonal antibody, rabbit anti-SEB polyclonal antibody were purchased from Toxin Technology, Inc. (Sarasota, FL). Bovine serum albumin and goat anti-rabbit antibody-horseradish peroxidase (HRP) were purchased from Sigma-Aldrich (St. Louis, MO). Alexa Fluor® 532 monoclonal antibody labeling kit was obtained from Invitrogen (Carlsbad, CA). Alexa 532 was conjugated to the rabbit anti-SEB antibody following the manufacturers’ instructions.
Photonic nanostructured array fabrication
Details of the procedure were previously described by Han et al.15 Briefly, LOL-2000 was spin-coated onto the indium tin oxide (ITO) coated glass wafer. 2% 950 PMMA A2 was spin-coated on the LOL-ITO-glass wafer. Eventually the bi-layer coating procedure made a total 240 nm thickness coating. The coated wafer was cut into 37.5 mm × 25 mm chips. The chip was patterned by using e-beam nanolithography.
Preparation of immunoassays
One mL of 0.05 % fluorescent carboxylated polystyrene particles were coated with mouse anti-SEB monoclonal antibody in pure water by passive adsorption for 2 hours at room temperature with gentle shaking. The amount of the antibody for full coverage was estimated by using a protocol provided by the vendor (Bangs Laboratories, TechNote 205). After trapping the particle-anti SEB complex into nanowells corresponding to their size, 10 µL of target SEB dissolved in phosphate buffered saline (PBS) was dropped onto the area where a total of nine arrays (the distance between the arrays was 250 µm) were located. The target molecules in 10 µL were thereby shared among the individual arrays. The arrays were then incubated for 20 min at room temperature followed by removal of the solution. Finally, 10 µL of 10 µg/mL rabbit anti-SEB antibody-Alexa 532 dissolved in PBS was dropped onto the arrays. The chip was then incubated for another 20 min followed by removal of the solution. Concentrations of the target were varied from 10−9 µg/mL to 100 µg/mL while the concentration of fluorescently labeled antibody was fixed.
In addition, to demonstrate practical performance of the nanoparticle based PC-array for highly sensitive detection of SEB in a food matrix, SEB spiked into milk was used. Initially SEB spiked milk solutions were further diluted by 1:100 using PBS. The final concentrations of SEB in spiked milk were 10−9, 10−7, 10−5 and 10−3 µg/mL. For a negative control, milk containing no SEB with 1/100 dilution by PBS was used. To remove the proteins from the surface of the array, an additional rinsing procedure with 10 µl of deionized water was performed. The method for removal of the deionized water was the same as that of bio-reagents.
Single photon counting detection system
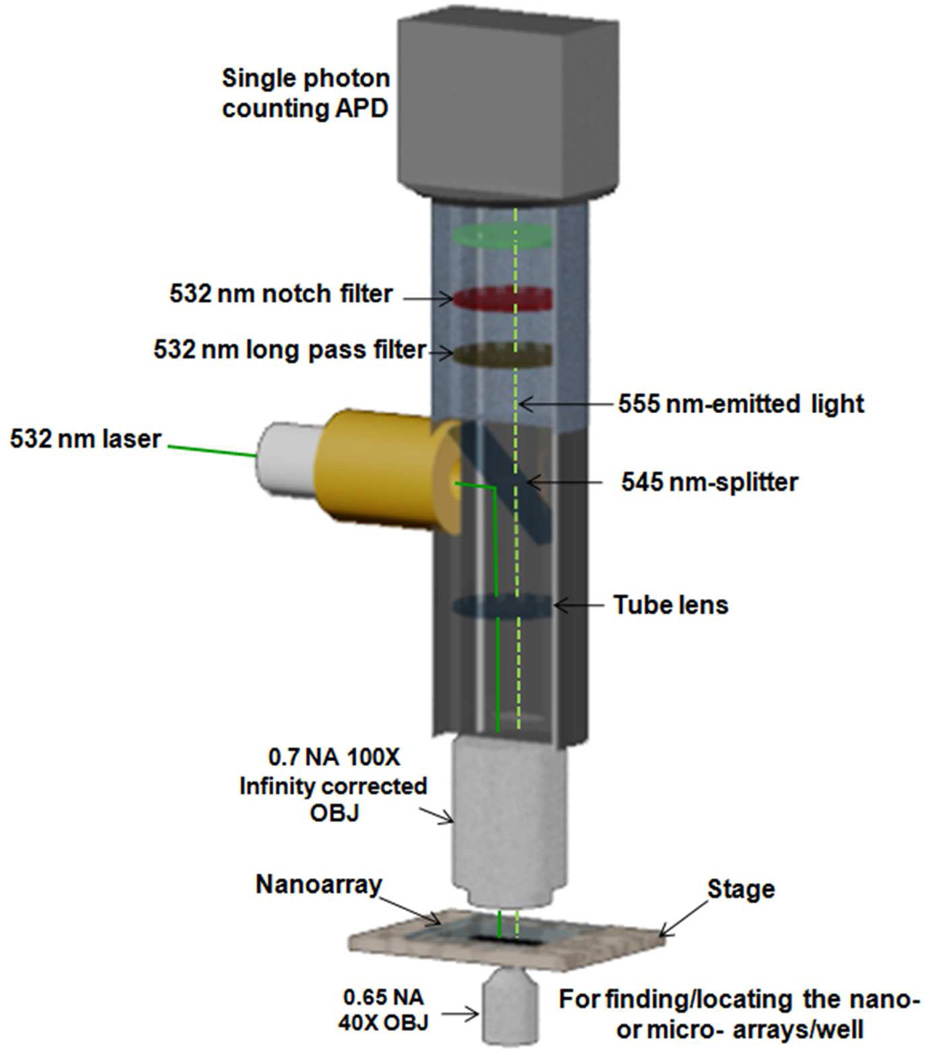
As shown in Figure 1, the fluorescent signal emitted from the immunocomplex located in the nanowells was detected with a 100 X-infinity corrected objective lens. A 532 nm continuous wave (CW) laser was used to excite the fluorescent probes of the immunocomplex. The fluorescence emission was filtered to eliminate the background at 532 nm (mostly stray laser light scattering) by using a 532 nm-long pass filter and 532 nm notch filter. The photons of light emitted from the immunocomplex were then collected by the SPAD which generated one pulse per photon. The pulses were counted by using an oscilloscope (WavePro 7000; Lecroy, Chestnut Ridge, NY).
Figure 1.
Schematic of the single photon counting detection system. The photons of light emitted from the immunocomplex were detected by the single photon counting avalanche photodiode which generated a single pulse per photon. The pulses were counted by an oscilloscope (picture was not shown). One datum point on the curve was obtained from an averaged number of pulses during 20 seconds.
SEB ELISA
A 96-well-ELISA plate was coated with a mouse anti- SEB monoclonal antibody (10 µg/mL) during 2 h incubation at 37 °C. The plate was blocked with 3% BSA in PBS with 1 h incubation at 37 °C. One hundred µl of various concentrations of SEB diluted in PBS were added to wells followed by 1 h incubation at room temperature. After four washings with PBST (PBS with 0.05% Tween 20), 100 µl of rabbit anti-SEB antibody (1 µg/mL) was added to the wells. The plate was incubated for 1 h at room temperature. After four washings with PBST, 100 µl of goat anti-rabbit antibody conjugated with HRP (1/5000 dilution in PBS) was added with the plate incubated for 1 h at room temperature. 100 µL of substrate solution was added and the reaction was stopped after 15 min by adding 50 µL of 2 M H2SO4. Absorbance was obtained utilizing a plate reader (Molecular Device, Sunnyvale, USA) at 450 nm.
RESULTS AND DISCUSSION
Photonic crystal with nanowells in an array
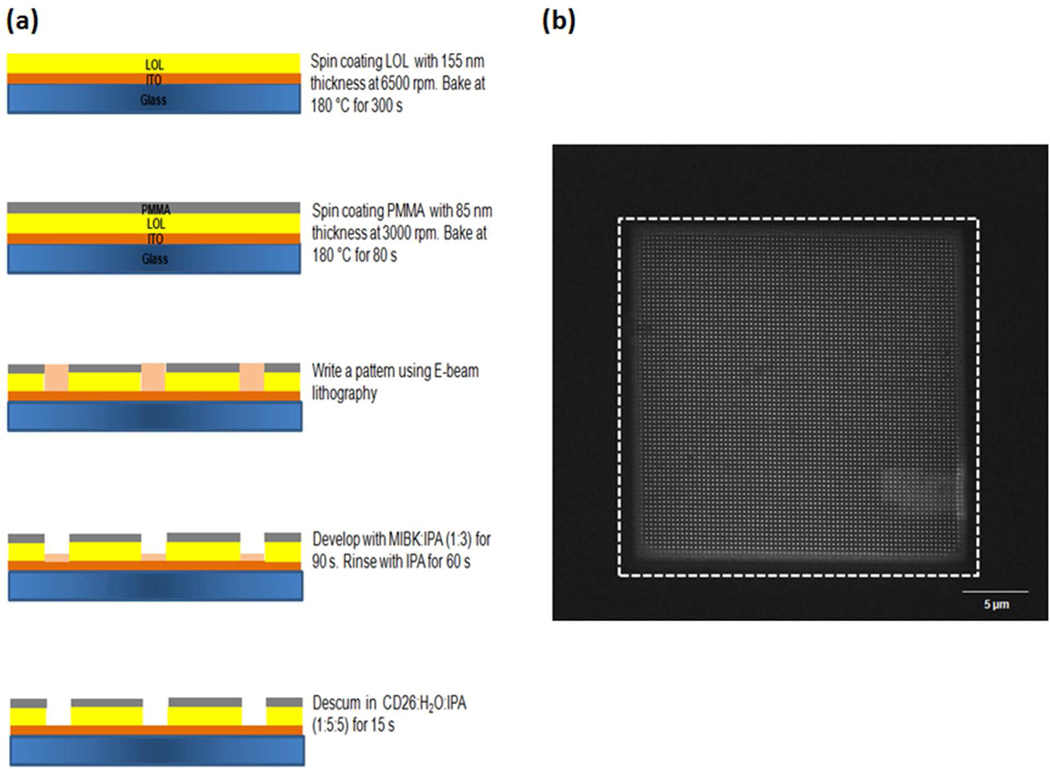
Figure 2 shows (a) the fabrication steps of the PC-nanowells/array and (b) a scanning electron microscope (SEM) image of the array. The depth of the periodic structure (i.e. 240 nm) must satisfy the relation λG/2>ℓ>λG/4 for first order diffraction, where λG is the wavelength of the light experiencing the guided mode resonance. The width of the wells was designed to be 60 nm in order to trap a 40 nm-particle-capture antibody complex without double occupancy. Due to phase matching, the incident wavelength on a periodic structure can be a guided mode when the wave vector in free space is less than that in the periodic structure.16 This condition is satisfied for first order diffraction when the periodicity of the structure was 350 nm. The optimized guided mode resonances in superstrate (PMMA) and substrate (ITO/glass) around the immunocomplexes amplified the fluorescent excitation.
Figure 2.
Photonics crystal (PC)-nanowells/array. (a) fabrication of PC-nanowells/array and (b) scanning electron microscope (SEM) image of the PC-nanowells/array; width of the well: 60 nm; periodicity: 350 nm; coating thickness: 240 nm (85 nm-PMMA and 155 nm-LOL), white dashed line: signal collecting area (25 µm×25 µm) by a single photon counting detection system.
The dashed line indicates the area of the array (25 µm×25 µm) from which the fluorescent signal was collected. Carboxylated polystyrene particles (40 nm) conjugated with capture antibody for immunoassays were trapped into the PC structure engineered into a PMMA-LOL 2000-ITO-glass slide by using an electrophoretic particle entrapment system (EPES). Detail procedures for trapping nanoparticles into the nanowells using the EPES have been previously reported.15
Detection of SEB in buffer using PC-nanostructured array
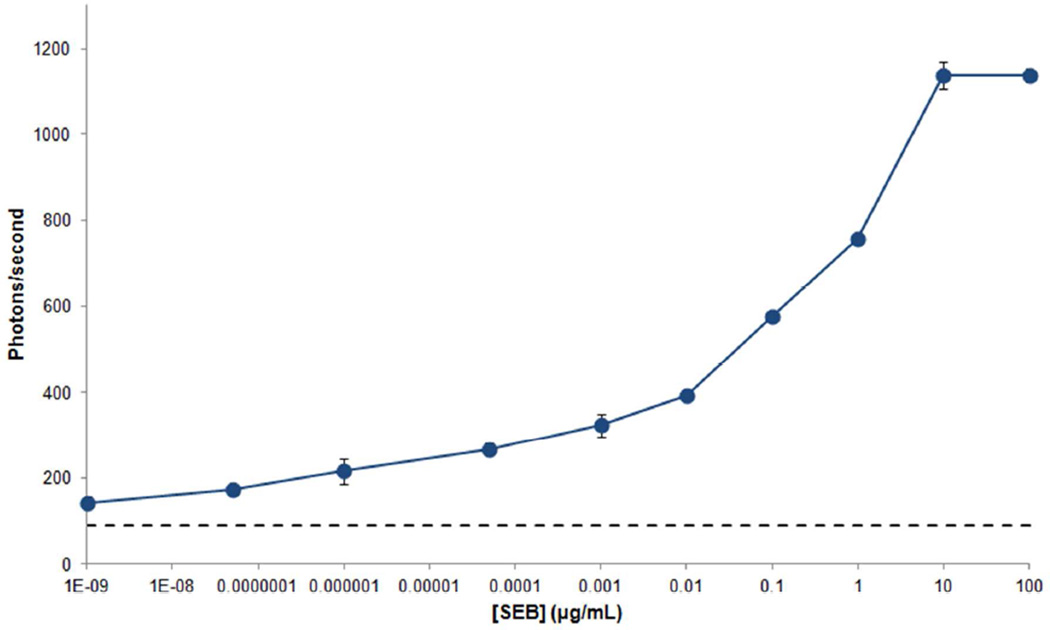
The single photon counting system (Figure 1) was used for detection with excitation from a 532 nm-laser and collection of 555 nm-emitted light from the immunocomplexes on the detection area of the array. Figure 3 shows the standard curve for quantifying the concentration of SEB dissolved in PBS. Each point on the curve was obtained by averaging the photon count over a period of 20 seconds using a high speed digital oscilloscope. Ten different concentrations of SEB dissolved in PBS were measured with a sandwich immunoassay: 10−9, 5×10⁻⁸, 10−6, 5×10⁻⁵, 10−3, 0.01, 0.1, 1, 10 and 100 µg/mL. An anti-SEB-Alexa 532 conjugate was used as a fluorescently labeled detection antibody at a concentration of 10 µg/mL. Background noise that originated from the 532 nm laser was measured by shining the laser on the arrays in the absence of particles and immunoassay reagents. The result was 83±3 photons/second. Non specific binding could result from attachment of the fluorescently labeled secondary antibody to either the particles in the absence of target or to the PMMA substrate. To assess the extent of non specific binding, a solution of detection antibody-Alexa 532 was added to the array with particle-capture antibody complexes trapped in the wells - in the absence of target molecules. The signal arising from non- specific binding was 99±4 photons/second (background noise included). The data points on the standard curve were corrected by subtracting non-specific binding (with background noise excluded- 16 photons) from the total signals to avoid a false positive result.
Figure 3.
Detection of SEB in buffer. Ten different concentrations of SEB dissolved in PBS were detected using a sandwich immunoassay: 10−9, 5×10⁻⁸, 10−6, 5×10⁻⁵, 10−3, 0.01, 0.1, 1, 10 and 100 µg/mL. LODs were determined from the mean plus three standard deviations of the background noise (dash lines). Error bars are based on the standard deviation of three replicates.
The measured limit of detection (LOD) was 10−9 µg/mL, corresponding to 35 aM concentration based on the molecular weight of the SEB (28.5 kDa). The LOD was defined as the concentration of SEB in buffer that produced three standard deviations higher than the signal of background noise. Two distinct log-linear detection ranges with different slopes were found at a high concentration (0.01 µg/mL to 10 µg/mL; R2: 0.96) and at a low concentration (10−9 µg/mL to 0.01 µg/mL; R2: 0.96). Our approach to using electrophoretic trapping of the particle-antibody complexes required us to use passive adsorption of the capture antibodies onto the particles in order to preserve sufficient electric charge and hence sufficient electric mobility in our applied electrostatic filed. With passive adsorption, the antibody is randomly oriented on the surface of the particle. Some of the antibodies will be oriented correctly to capture a target molecule, others will not be, leading to an inhomogeneous distribution of affinities over the nanoparticles in the wells. Adsorption to a surface that exhibits randomly distributed affinities can be described in terms of a Temkin isotherm. The Temkin isotherm provides a plausible model to explain the relatively less steep log-linear region at low concentrations. Such relative insensitivity precludes the possibility of discerning single molecule binding events.14 As an alternative strategy, covalent attachment of antibodies to the particles would result in a much more homogeneous distribution of affinities but this approach requires the use of magnetophoresis on magnetic nanoparticles to trap them into wells; current research is exploring this possibility.
In general, food samples that contain a target analyte need to be pre-treated (e.g. sample extraction and purification) using laboratory-based procedures for detection, a procedure that is far from the concept of a point-of-use biosensor. Although liquid-based food samples can be directly applied to a biosensor, the sample ideally benefits from further dilution with buffer to reduce the matrix effect which is a major factor that causes false positive signals in a sensor. Successful quantification of the analyte after further dilution thus needs much better detection limits than is often achievable with current technologies. Our PC-based sensor can tolerate substantial dilution of a sample because of the excellent limit of detection, down to low attomolar levels. In addition, the use of very small amounts of sample (10 µL) and short incubation times (less than an hour) are important characteristics of the PC-array that can be attributed to the miniaturization of the device to the nanometer scale.
Comparison of sensitivity between the PC-nanostructured array and standard ELISA
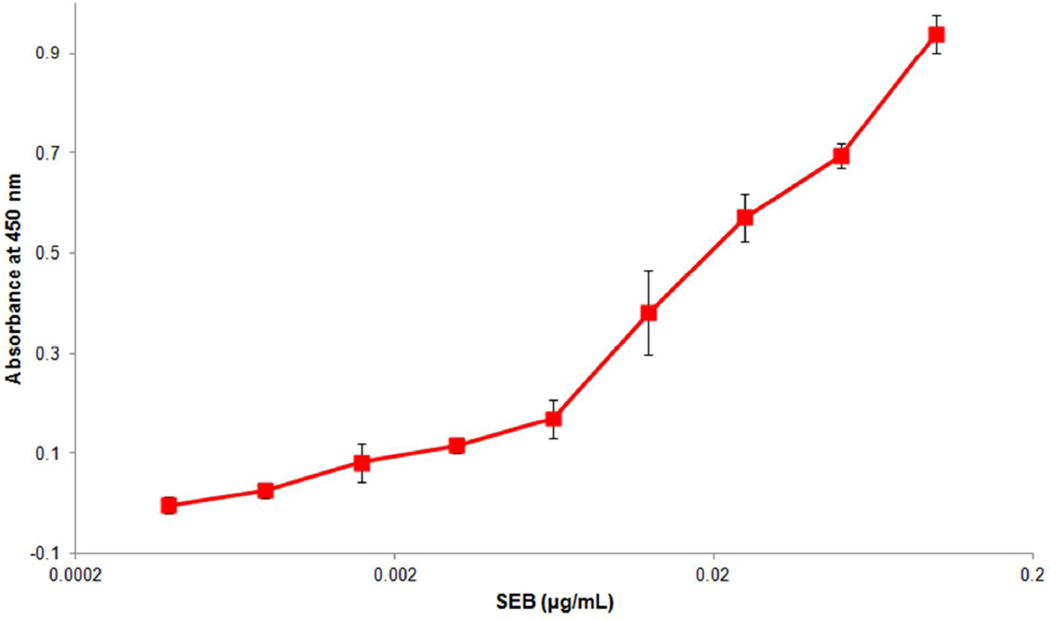
We performed a standard ELISA to compare the assay sensitivity to that of the PC-array sensor. As shown in Figure 4, the ELISA achieved a LOD of approximately 10−3 µg/mL; the LOD was defined as the concentration of SEB that produced a signal three standard deviations higher than the signal from blank wells with no SEB. This result indicates that our PC-array sensor is 106-fold more sensitive than the ELISA. The ultra sensitive PC array sensor enables accurate measurements in food samples by simply diluting samples prior to analysis to remove matrix effects. Significant dilution of samples is not suitable for ELISA because the concentration of analyte in the diluted samples would be below the limit of detection by the ELISA.
Figure 4.
Detection of SEB using conventional 96-well plate-ELISA; Absorbance test using HRP and substrate. Concentrations of 0, 4×10⁻⁴, 8×10⁻⁴, 16×10−4, 31×10−4, 63×10−4, 125×10−4, 25×10−3, 0.05, 0.1 µg/mL. LOD was 10−3 µg/mL. Error bars represent one standard deviation based on four replicates.
Detection of SEB in milk
Dairy products are a significant source of risk for exposure to SEB.17 Therefore, our detection system was tested by spiking SEB into whole milk to evaluate the reliability of the PC-nanostructured array in a real food sample. Four different concentrations of SEB-spiked milk were prepared: 10−7, 10−5, 0.001 and 0.1 µg/mL (0.001 µg/mL corresponds to 35 pM based on the molecular weight of SEB) so that 150 pM of SEB, which is the threshold for symptoms in an adult (1 µg of SEB in 8 oz-milk),5 can be included within the range of concentrations tested. One hundred-fold dilution of the three spiked solutions was then performed to reduce the matrix effect from other kinds of proteins, fats and carbohydrates present in milk.2 The final concentrations were thus 10−9, 10−7, 10−5 and 0.001 µg/mL which fell within the low concentration range of the standard curve that was developed with SEB in buffer. For a negative control, non-spiked milk with 1/100 dilution was used. The signal from the negative control (signal from non-specific binding of the detection antibody-Alexa 532 was excluded) was 94±4 photons/second. The signal difference between the negative control and background noise was 11 photons/second. The measured LOD was 10−9 µg/mL - the same as that of SEB-buffer.
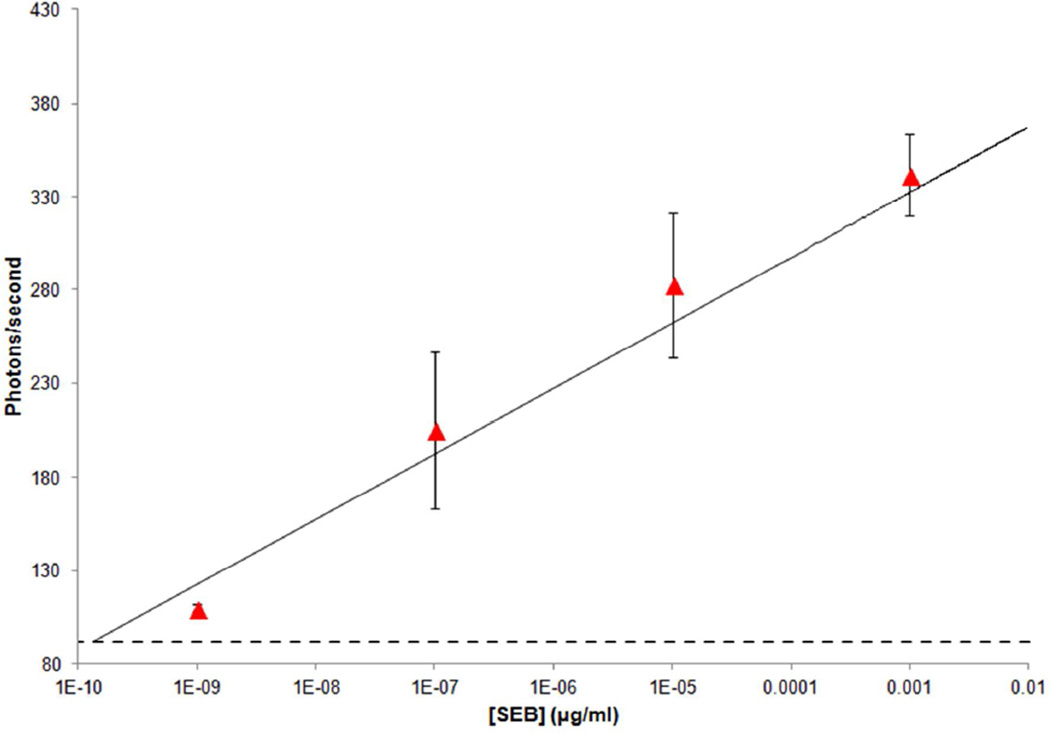
The known concentrations of SEB in milk were compared to the concentrations estimated from the standard curve for SEB that was attained in PBS at atto- to picomolar concentrations (Table 1). The difference between the measured and expected signals averaged 13±5 photons/second. The estimated concentrations corresponding to the measured signals in milk using the low concentration range of the log-linear standard curve (solid line in Figure 5; R2: 0.96) for SEB in buffer were 4.3×10⁻¹⁰, 2.3×10⁻⁷, 3.7×10⁻⁵ and1.8×10−3 µg/mL respectively compared to actual concentrations of 10−9, 10−7, 10−5 and 10−3 µg/mL. Relative standard deviations (RSD) of the measured signals were 2, 20, 14 and 6% respectively (Table 1). The variation of the RSD in both buffer and milk solution could be due to the sample handling and the manner is which we apply sample to the PC array. In addition, a T-test was performed to statistically assess the difference between the expected and measured signals and concentrations. The results showed that the data obtained from SEB spiked into milk are statistically indistinguishable from those obtained from SEB in PBS at alpha 0.05.. Given the linearity and the statistical confidence, SEB in buffer data can itself be employed as a standard curve for estimation and testing of real milk samples.
Table 1.
Comparison of SEB-milk after 1:100 dilution to SEB-buffer.
| SEB spiked into milk concentration after 1:00 dilution (µg/mL)a |
Expected signal from the standard curve (photons/s)b |
Measured signal (photons/s)c |
Estimated Concentration from the standard curve (µg/mL) |
RSD (%) |
Recovery (%) |
|---|---|---|---|---|---|
| 10−3 | 332 | 342±22 | 1.8×10⁻³ | 6 | 184 |
| 10−5 | 262 | 283±39 | 3.7×10⁻⁵ | 14 | 378 |
| 10−7 | 193 | 205±42 | 2.3×10⁻⁷ | 20 | 227 |
| 10−9 | 123 | 110±2 | 4.3×10⁻¹⁰ | 2 | 44 |
Known concentration of SEB-milk after 100-fold dilution.
Expected signals were obtained from the standard curve that was developed for SEB spiked into PBS.
Mean±S.D. (n=5).
Figure 5.
Measured results of SEB in milk (▲) compared to the standard curve (solid line, R2: 0.96) of SEB in PBS. Final concentrations after 100-fold dilution with buffer were 10−9, 10−7, 10−5 and 0.001 µg/mL. Error-bar: standard deviation determined from five replicates.
However, given the excessive recovery rates (Table 1) from SEB in milk, despite statistical agreement between the known and estimated concentrations, there is a need to address concerns such as non-specific binding or false positive results.
To determine non-specific binding of SEB to the particles or surface of the PC-nanoarray chip, we used 10 and 0.001 µg/mL of SEB in buffer directed against the particles conjugated with goat-anti rabbit IgG in the PC-nanoarray- this is a different antibody from the one used for detecting SEB. The result of the non-specific binding test showed that the signals were 83±7 and 78±2 photons/second for the 10 and 0.001 µg/mL, respectively (excluding the non-specific binding of detection antibody-Alexa 532). Thus, the non-specific binding of SEB was indistinguishable from the background noise (83 photons/second).
The potential for false positive in the milk matrix was assessed by diluting non-spiked milk by 1:1000. The signal was 79±3 photons/second (non-specific binding of detection antibody-Alexa 532 was excluded), very close to the expected background noise. With the exception of the lowest concentration of 10−9 µg/mL, the systematic difference between the measured signals from diluted milk sample versus the SEB standard curve measured in PBS can be attributed to the matrix of the milk, leading to a systematic overestimation of the SEB concentration in milk.
CONCLUSIONS
The superiority of the PC-nanoparticle-based array originates from the ultrahigh sensitivity associated with the unique photonic behavior of the device. In addition, its simplicity and affordability in terms of fabrication and performance of immunoassay are essential in a point-of-use biosensor. SEB detection in both buffer and milk described in this study shows the reliability of the array/EPES for early detection of harmful biological reagents in a “real” matrix. Our PC-nanowells-in an array/EPES is a novel prototype of an array-based immunoplatform that has the potential to replace conventional protein- or DNA-microarrays or other biosensors.
ACKNOWLEDGEMENT
The authors thank the Northern California Nanotechnology Center at the University of California Davis for the facilities used in the fabrication of PC-nanowells/array. The project described was supported by the National Institute of Environmental Health Sciences (NIEHS) Superfund Basic Research Program, award number P42ES004699. The content is solely the responsibility of the authors and does not necessarily represent the official views of the National Institute of Environmental Health Sciences or the National Institutes of Health. This work was also supported by grant R56 AI089460 from NIAID, NIH. Additional support was provided by the National Research Initiative of the USDA Cooperative State Research, Education and Extension Service, grant number 2009-35603-05070. Dr. Bruce D. Hammock is a George and Judy Marcus Senior Fellow of the American Asthma Society.
REFERENCES
- 1.Walt DR, Franz DR. Anal. Chem. 2000;72:738A–746A. doi: 10.1021/ac003002a. [DOI] [PubMed] [Google Scholar]
- 2.Maraldo D, Mutharasan R. Anal. Chem. 2007;79:7636–7646. doi: 10.1021/ac070589l. [DOI] [PubMed] [Google Scholar]
- 3.Evenson ML, Hinds MW, Bernstein RS, Bergdoll MS. Int. J. Food Microbiol. 1988;7:311–316. doi: 10.1016/0168-1605(88)90057-8. [DOI] [PubMed] [Google Scholar]
- 4.Franz DR, Jahrling PB, Friedlander AM, McClain DJ, Hoover DL, Bryne WR, Pavlin JA, Christopher GW, Eitzen EM. JAMA. 1997;278:399–411. doi: 10.1001/jama.278.5.399. [DOI] [PubMed] [Google Scholar]
- 5.Haes AJ, Terray A, Collins GE. Anal. Chem. 2006;78:8412–8420. doi: 10.1021/ac061057s. [DOI] [PubMed] [Google Scholar]
- 6.Ligler FS, Taitt CR, Shiriver-Lake LC, Sapsford KE, Shubin Y, Golden JP. Anal. Bioanal. Chem. 2003;377:469–477. doi: 10.1007/s00216-003-1992-0. [DOI] [PubMed] [Google Scholar]
- 7.Lin HC, Tsai W-C. Biosens. Bioelectron. 2003;18:1479–1483. doi: 10.1016/s0956-5663(03)00128-3. [DOI] [PubMed] [Google Scholar]
- 8.Homola J, Dostalek J, Chen S, Rasooly A, Jiang S, Yes SS. Int. J. Food Microbiol. 2002;75:61–69. doi: 10.1016/s0168-1605(02)00010-7. [DOI] [PubMed] [Google Scholar]
- 9.Pinto AD, Forte VT, Ciccarese G, Conversano MC, Tantillo GM. J. Food Saf. 2004;24:231–238. [Google Scholar]
- 10.Pimbley DW, Patel PD. J. Appl. Microbiol. 1998;84:84S–109S. doi: 10.1046/j.1365-2672.1998.0840s198s.x. [DOI] [PubMed] [Google Scholar]
- 11.Ligler FS, Breimer M, Golden JP, Nivens DA, Dodson JP, Green TM, Hader DP, Sadik OA. Anal. Chem. 2002;74:713–719. doi: 10.1021/ac015607s. [DOI] [PubMed] [Google Scholar]
- 12.Shyu R-H, Tang S-S, Chiao D-J, Hung Y-W. Food Chem. 2010;118:462–466. [Google Scholar]
- 13.Ganesh N, Zhang W, Mathias PC, Chow E, Soares JAMT, Malyarchuk V, Smith AD, Cunningham BT. Nat. Nanotechnol. 2007;2:515–520. doi: 10.1038/nnano.2007.216. [DOI] [PubMed] [Google Scholar]
- 14.Han J-H, Sudheendra L, Kim H-J, Gee SJ, Hammock BD, Kennedy IM. ACS Nano. 2012;6:8570–8582. doi: 10.1021/nn301656c. [DOI] [PMC free article] [PubMed] [Google Scholar]
- 15.Han J-H, Kim H-J, Sudheendra L, Hass EA, Gee SJ, Hammock BD, Kennedy IM. Biosens. Bioelectron. 2012;41:302–308. doi: 10.1016/j.bios.2012.08.042. [DOI] [PMC free article] [PubMed] [Google Scholar]
- 16.Jackson DR, Chen J, Qiang R, Capolino F, Oliner AA. Opt. Exp. 2008;16:21271–21281. doi: 10.1364/oe.16.021271. [DOI] [PubMed] [Google Scholar]
- 17.Carmo LSd, Dias RSS, Linardi VR, Sena MJd, Santos DAd, Faria MEd, Pena EC, Jett M, Heneine LG. Food Microbiol. 2002;19:9–14. [Google Scholar]


