

Abstract
Objectives
To characterize the dose distribution for a range of cone beam CT (CBCT) units, investigating different field of view sizes, central and off-axis geometries, full or partial rotations of the X-ray tube and different clinically applied beam qualities. The implications of the dose distributions on the definition and practicality of a CBCT dose index were assessed.
Methods
Dose measurements on CBCT devices were performed by scanning cylindrical head-size water and polymethyl methacrylate phantoms, using thermoluminescent dosemeters, a small-volume ion chamber and radiochromic films.
Results
It was found that the dose distribution can be asymmetrical for dental CBCT exposures throughout a homogeneous phantom, owing to an asymmetrical positioning of the isocentre and/or partial rotation of the X-ray source. Furthermore, the scatter tail along the z-axis was found to have a distinct shape, generally resulting in a strong drop (90%) in absorbed dose outside the primary beam.
Conclusions
There is no optimal dose index available owing to the complicated exposure geometry of CBCT and the practical aspects of quality control measurements. Practical validation of different possible dose indices is needed, as well as the definition of conversion factors to patient dose.
Keywords: cone beam computed tomography, radiation dosimetry, thermoluminescent dosimetry, quality control
Introduction
Cone beam CT (CBCT) is an imaging modality which has been applied to various fields in medicine, and has recently been introduced into dentistry. Compared with traditional dental radiography techniques, CBCT offers high resolution three-dimensional images at a relatively low radiation dose.1 There is an increasing number of manufacturers of CBCT units offering a large variety of devices with considerable differences in exposure parameters, such as field of view (FOV) size, beam quality (tube voltage and filtration), X-ray exposure (milliampere seconds) and rotation angle. Various studies have pointed out the wide range of effective doses for CBCT devices, and many authors have indicated that the exposure used for different types of patients should be adjusted based on patient size, image quality requirements and field size requirements.2-7 Such optimizations require a standardized dose index that allows for dose characterization, device comparison and estimation of patient risk.
In single- and multi-detector CT (MDCT) scanners, the computed dose index (CTDI) is the international dose assessment metric (IEC 60601-2-44 2002)8 that is used to quantify the radiation output of the scanners. CTDI100 is the 100 mm long integral of the dose profile along a line perpendicular to the axial (xy) plane divided by the beam collimation. It can be determined using a 100 mm long ionization chamber either free in air or in CT dosimetry phantoms. The weighted CTDI (CTDIw) can be calculated by combining central and peripheral measurements and represents the average dose in the scan plane. CTDI measurements are part of standardized quality assurance protocols and are generally used for dose optimization in CT. Moreover, CTDI allows for the estimation of the effective dose to the patient using conversion factors.9 The use of the CTDI100 has been under investigation lately for both CBCT and MDCT.9-16 It has been shown by different authors that the increasing beam width used by modern MDCT scanners leads to a significant underestimation of the axial (z-axis) dose when measuring the CTDI100, as the scatter tails are not fully measured by the 100 mm pencil ion chamber.10-13 In addition, there are commercially available dental CBCT units that offer FOVs that exceed the length of the 100 mm pencil ionization chamber. Different solutions for capturing the entire scatter tail have been proposed, and the current state of the technology leads to believe that a small-volume ion chamber is currently the best option to measure an appropriate dose index for MDCT in the field.10
CBCT devices used in dentistry are inherently different from MDCT scanners, and it has been pointed out before that the CTDI is not applicable for CBCT.11,16 Because of its particular exposure geometry, a separate dose index needs to be defined which is applicable to all dental CBCT devices. There are a few factors distinguishing CBCT from MDCT which need to be taken into account before adapting or defining a suitable dose index. Dental CBCT devices exhibit a wide range of FOV sizes, ranging from a few centimetres in diameter and height to an FOV which can cover the entire head. It can be expected that dose distributions vary considerably for different FOV sizes.17 In addition, the isocentre (i.e. the centre of the FOV) can be positioned centrally or peripherally in the patients head, affecting the dose distribution to all head and neck organs.16 Another source of asymmetrical dose distribution is a partial exposure along a rotation arc ranging between 180° and 200°, which is implemented by different CBCT manufacturers. Furthermore, a number of devices use a “half beam” scanning technique, resulting in an overlapping exposed region surrounding the isocentre, leading to further inhomogeneities in dose distribution.
As an alternative dose index for CBCT, the dose–area product (DAP) measured with a transmission ionization chamber has been proposed.16,18-20 The DAP provides an estimation of the tube output in terms of dose and field size. However, the use of DAP as a dose index is limited because it does not take any of the specific geometric exposure issues in dental CBCT into account. It is possible for two CBCT exposure protocols to have the exact same DAP value, despite having considerable differences for all exposure factors mentioned above (i.e. beam quality, milliampere seconds, FOV size, FOV position, rotation arc, half beam). As all of these factors determine the actual distribution of dose throughout the patient, it is not possible at this moment to link DAP values to patient dose.
All of these pieces of information must be considered when developing a dose index for dentomaxillofacial CBCTs. An improved knowledge of the complex dose distributions associated with available CBCT systems would aid the definition of a dose index that can be measured during routine quality control and is relevant for patient dose estimation. The aim of this study, therefore, was to perform dose distribution measurements on a range of CBCT devices using cylindrical phantoms and different dosimetric methods.
Materials and methods
Two types of phantoms were used for dose measurements: a cylindrical water phantom and a customized cylindrical polymethyl methacrylate (PMMA) phantom. Both phantoms allowed different types of dose measurements to be undertaken. Measurements were made on eight dental CBCT units, across the axial, coronal and sagittal planes and for a range of FOVs, isocentre positions and rotation arcs. The co-ordinate system and definitions used throughout this article are illustrated in Figure 1. Table 1 provides an overview of the different CBCT devices that were involved and the different exposure protocols that were investigated.
Figure 1.
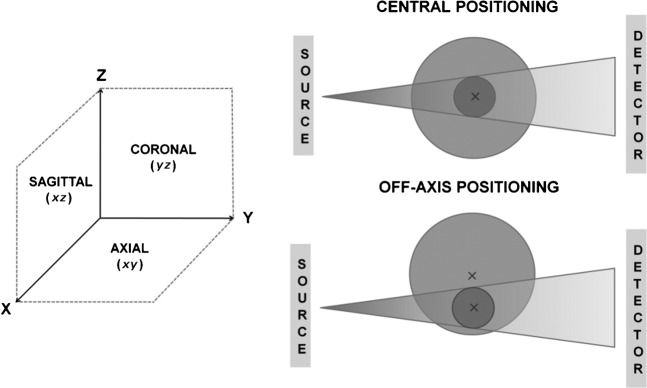
Co-ordinate system and terminology used for dose measurements
Table 1. Exposure factors used for water and polymethyl methacrylate (PMMA) phantom measurements.
| Device | Rotation | Phantom positioning | kVp | mAs | FOV size (cm)a |
| Ion chamber measurements in water phantom, xz plane | |||||
| SCANORA® 3D | 360 | Central | 85 | 30 | 10 × 7.5 |
| TLD measurements in water phantom, xz plane and yz plane | |||||
| SCANORA 3D | 360 | Central | 85 | 30 | 10 × 7.5 |
| SCANORA 3D | 360 | Off axis | 85 | 36 | <>6 × 6 |
| 3D Accuitomo XYZ | 360 | Off axis | 80 | 70 | 4 × 3 |
| TLD measurements in water and PMMA phantoms, xy plane | |||||
| GALILEOS™ | 200 | Off axis | 85 | 28 | 15 × 15 |
| SCANORA 3D | 360 | Off axis | 85 | 30 | 10 × 7.5 |
| ILUMA® Elite | 360 | Central | 120 | 76 | 21 × 14 |
| ILUMA Elite | 360 | Off axis | 120 | 76 | 21 × 14 |
| NewTom® VG | 360 | Central | 110 | 9.6 | 23 × 23 |
| NewTom VG | 360 | Off axis | 110 | 6.1 | 23 × 23 |
| 3D Accuitomo™ 170 | 360 | Central | 90 | 87.5 | 4 × 4, 6 × 6, 8 × 8, 14 × 5, 14 × 10 |
| 3D Accuitomo 170 | 360 | Off axis | 90 | 87.5 | 4 × 4 |
| 3D Accuitomo 170 | 180 | Central | 90 | 45 | 10 × 10 |
| i-CAT® N.G. | 360 | Central | 120 | 18.5 | 8 × 8, 16 × 6 |
| i-CAT N.G. | 360 | Off axis | 120 | 18.5 | 8 × 8, 16 × 6 |
| i-CAT N.G. | 180 | Central | 120 | 9.3 | 8 × 8 |
| ProMax™ 3D | 200 | Central | 84 | 17.1 | 8 × 5, |
| ProMax 3D | 200 | Off axis | 84 | 17.1 | 8 × 5 |
FOV, field of view; TLD, thermoluminescent dosemeter.
SCANORA 3D, Soredex, Tuusula, Finland; 3D Accuitomo XYZ, J Morita Mfg. Corp., Kyoto, Japan; 3D Accuitomo 170, J Morita Mfg. Corp., Kyoto, Japan; GALILEOS, Sirona Dental Systems, Bensheim, Germany; ILUMA Elite, IMTEC, St Paul, MN; NewTom VG, Quantitative Radiology, Verona, Italy; i-CAT N.G., Imaging Sciences International, Hatfield, PA; ProMax 3D, Planmeca Oy, Helsinki, Finland.
aDiameter × height.
Phantoms and dosemeters
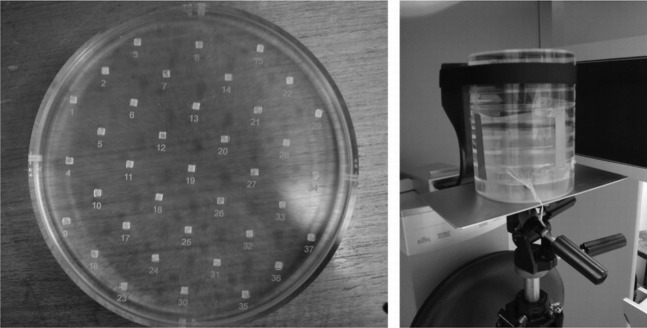
A water phantom was used for measuring the dose distributions across all planes. The phantom consists of a plastic cylinder, 15 cm in diameter and 25.5 cm in height, which was filled with water, enabling measurements at various positions using thermoluminescent dosemeters (TLDs) and an ionization chamber (Figure 2). Additionally, a PMMA phantom (SedentexCT DI; Leeds Test Objects Ltd, Boroughbridge, UK) was developed for measuring the dose distributions along the xy plane using TLDs and radiochromic film. It consists of seven interchangeable slices of 16 cm diameter and 2.8 cm thickness (Figure 3). Two dedicated slices were manufactured to accommodate TLDs and films. An extra disc positioned at the top of the phantom was designed to allow alignment of the phantom with the laser beams of the CBCT units.
Figure 2.

Thermoluminescent dosemeter (TLD) measurement in water phantom with central field of view (FOV) positioning, using a 14 × 11 TLD grid positioned along the yz plane. Left: phantom positioned in the SCANORA® 3D (Soredex, Tuusula, Finland), showing TLD grid. Right: axial (xy) maximum intensity projection image of the reconstructed scan, superposing all TLDs within the FOVs. The distribution of the TLDs in the xy plane was within a 3 mm margin
Figure 3.
Polymethyl methacrylate phantom for dose distribution. Left: slice loaded with thermoluminescent dosemeters. Right: phantom in position for measurement
Two types of TLDs (Harshaw Thermo Fisher Scientific Inc, Waltham, MA) were used in this study: TLD-100 (LiF: Mg, Ti) at Leuven and TLD-100H (LiF: Mg, Cu, P) at Manchester. The TLD-100 were calibrated in the SCANORA® 3D CBCT (Soredex, Tuusula, Finland) at 85 kVp using an ionization chamber with a calibration factor traceable to a Secondary Standard Dosimetry Laboratory (SSDL, Gent, Belgium). The TLD-100H was individually calibrated against an ionization chamber with calibration traceable to national standards (National Physical Laboratory, London, UK), using a conventional diagnostic X-ray tube at 80 kVp. The calibration error for all TLDs was less than 10%. For both TLD types, a selection was performed by repeating the calibration process and discarding TLDs if the read-out value from the repeated exposures varied more than 3%. Furthermore, a series of comparison measurements was performed to ensure consistency between the measurements from the two TLD types.
For ionization chamber measurements a 0.6 cm3 chamber (Farmer FC65-G; IBA Dosimetry, Schwarzenbruck, Germany) was used, which was calibrated in a RQR5 diagnostic beam. Radiochromic films (XR-QA, GafchromicTM; Ashland Specialty Ingredients Wayne, NJ) were used to visualize the two-dimensional axial dose distribution, but were not calibrated for absorbed dose as it is difficult to obtain accurate quantitative results from film measurements.21
Measurements in xz plane and yz plane
A first measurement was performed by placing 154 TLDs in the water phantom in a vertical grid pattern in the yz plane at 1 cm intervals (Figure 2). The grid contained 11 rows and 14 columns, spanning an area of 13 × 10 cm. It was attached to a sheet of transparent paper which was fixed in the cylindrical phantom. The grid was exposed with the SCANORA 3D unit, using the standard protocol for adult patients (Table 1) and placing the isocentre of the X-ray beam at the midpoint of the grid (both horizontally and vertically), which coincided with the midpoint of the cylinder. Using this scanning protocol and phantom set-up, rotational symmetry of the dose distribution can be assumed. Therefore, the angle of the grid could be chosen freely. The yz plane was selected to allow for accurate phantom and grid positioning. The placement of the grid was verified after scanning.
As a subsequent evaluation of scattered radiation along the z axis, ion chamber measurements were performed on the SCANORA 3D (Table 1) at 1 cm intervals along the z axis at four different x co-ordinates corresponding to a central, peripheral and two mid-peripheral positions in the FOV. Measurements were repeated for each position to check for consistency, and corrected for temperature and pressure.
Further measurements with TLDs were performed to completely visualize the scatter tails. Firstly, the SCANORA 3D's small FOV was used, using standard exposure settings (Table 1). The field was positioned non-centrally, with the isocentre placed 5 cm from the central point of the cylinder, simulating a dental examination (incisor/canine region). For this measurement, a grid of 76 TLDs was used. This grid contained 4 columns of 19 TLDs each, interspaced at 1 cm. Owing to z-axis symmetry, the columns were positioned on one side of the central xy plane, covering co-ordinates from z = 0 cm up to z = 18 cm. The four columns were positioned with variable intervals along the y axis: centrally in the FOV, 1.5 cm from the isocentre (on the midpoint between the isocentre and border of the FOV), and at 4.5 cm and 6 cm from the isocentre (both outside the FOV). For a further evaluation, the 3D Accuitomo™ XYZ (J Morita Mfg. Corp., Kyoto, Japan) was used. This device uses a small FOV of 4 × 3 cm. For this measurement, a TLD distribution was used similar to the previous with a grid of 76 TLDs divided into 4 columns with a 1 cm interspace along the z axis. The isocentre was placed at 5.5 cm from the centre of the cylinder. The placement of the columns was adapted to obtain the same relative positions as the previous measurement (i.e. at 0 cm, 1 cm, 3 cm and 4 cm from the isocentre).
Measurements in the xy plane
Two different measurement grids were used for the xy plane, using the water phantom and PMMA phantom. For the water phantom, 69 TLDs were used. The distance between adjacent TLDs in any row was 2 cm, and adjacent rows were shifted 1 cm. For the PMMA phantom, 37 TLDs were used, positioned 3 cm apart. Measured values were inserted into a matrix, and empty cells were interpolated. Measurements were performed on seven CBCTs, combining central and off-axis positioning as well as full and partial rotation arcs (Table 1). For all xy measurements, the beam was positioned at the vertical centre of the phantom, corresponding to the height of the TLD grid. As a result, all measurements were performed in the mid-axial plane.
Results
Measurements in the xz plane and the yz plane
Figure 4 shows a surface plot of the dose distribution in water measured by TLDs using a 14 × 11 grid in the yz plane and positioning the phantom centrally in the FOV. The position of the 154 TLDs within the yz plane was within a 3 mm margin inside the FOV (Figure 2). Doses are highest in the isocentre, and remain high along the x axis, also when measuring outside the reconstructed volume. Along the z axis, a clear drop in dose values is shown outside the primary beam area, although the evaluated area is not wide enough to get a clear view on the amount of scattered radiation.
Figure 4.
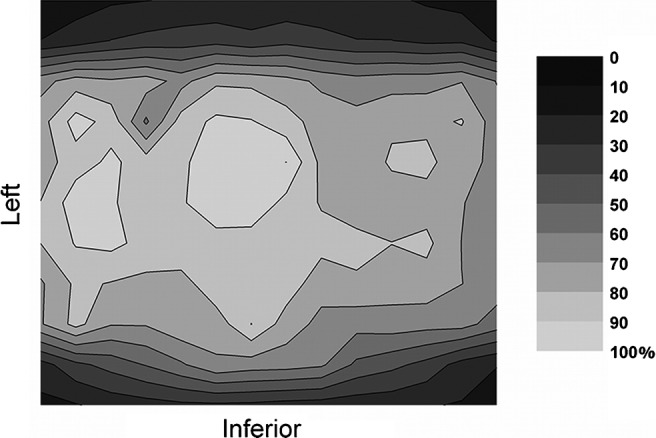
Relative dose distribution (%) at the yz plane from thermoluminescent dosemeter measurements in water, using the SCANORA® 3D (Soredex, Tuusula, Finland)
Figure 5 shows ion chamber dose values at different co-ordinates, using a central position of the SCANORA 3D device. A drop in dose values can be perceived when measuring at co-ordinates which are outside the primary beam. This drop is gradual because the ion chamber, which measures the dose of a certain volume, progressively moves out of the primary beam.
Figure 5.
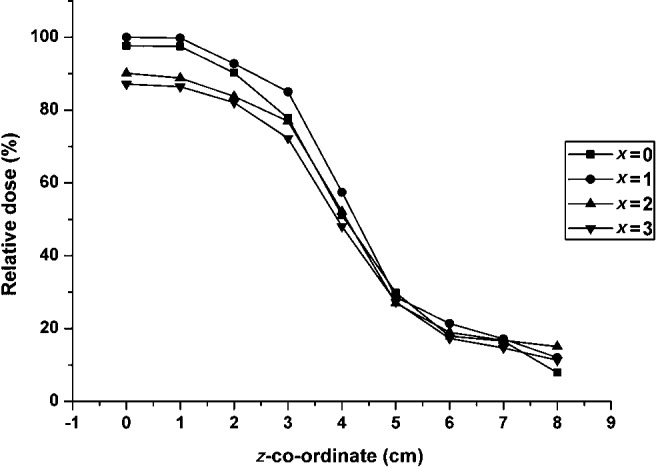
Relative dose (%) from ion chamber measurements in water, using the SCANORA® 3D (Soredex, Tuusula, Finland): isocentre at z = 0, nominal field of view border at 3.75 cm
Further scatter tail measurements using TLDs are depicted in Figure 6. Similar results can be observed for the SCANORA 3D and 3D Accuitomo XYZ. With the present set-up of TLDs the scatter tail is shown more extensively, demonstrating a clear but smooth drop in dose when measuring outside the primary beam. It is seen that there can be a noticable dose deposition just above or below the FOV. The scatter tails are shown to extend to a distance of twice or more the height of the FOV.
Figure 6.

Relative dose (%) from thermoluminescent dosemeter measurements in water, using the SCANORA 3D (Soredex, Tuusula, Finland) CBCT (isocentre at z = 0, nominal field of view (FOV) border at z = 3.75 cm) and 3D Accuitomo XYZ (J Morita Mfg. Corp., Kyoto, Japan) (isocentre at z = 0, nominal FOV border at z = 1.5 cm)
Measurements in the xy plane
Figure 7 shows all measurements performed in the xy plane using the water phantom, involving three CBCT devices. As shown on the graphs, the bottom of each two-dimensional distribution represents the front (anterior) side of the phantom, whereas the left side of the graph corresponds to the left side of the phantom. Only one scan shows a homogeneous distribution, as it is a 360° scan with central positioning and a large FOV. All others exhibit a gradient of dose (which can be higher or lower in the anterior region), owing to either a partial rotation or off-axis phantom positioning.
Figure 7.

Relative dose distributions (%) at the xy plane in water for different cone beam CT units and exposure settings
Figure 8 shows the dose distribution for three protocols of the ProMax™ 3D (Planmeca Oy, Helsinki, Finland). Dose distributions were non-uniform for all three measurements because the device scans using a 200° rotation. The dose distributions for the two FOVs are similar. The highest dose area is shifted to the back and right of the phantom with two hot spots at similar positions in the two set-ups. For off-axis positioning, the dose distribution was more uniform in the central region of the phantom than for the other two measurements but showed two hot spots at the front and back of the phantom.
Figure 8.

Relative dose distributions (%) at the xy plane in polymethyl methacrylate for the ProMax 3D (Planmeca Oy, Helsinki, Finland) and NewTom VG (Quantitative Radiology, Verona, Italy)
Dose distributions for the NewTom® VG (Quantitative Radiology, Verona, Italy) are shown in Figure 8. These distributions show a homogeneous dose distribution for central positioning, and a front–back dose gradient for off-axis positioning. Figure 9 shows the dose distributions for all 3D Accuitomo™ 170 protocols. Large differences can be seen between the different protocols, owing to variations in field size, rotation, and positioning. Dose distributions for all i-CAT™ NG (Imaging Sciences International, Hatfield, PA) protocols are displayed in Figure 9. Again, there is a clear change in dose distributions when scanning using half a rotation, or when scanning the phantom off axis.
Figure 9.

Relative dose (%) at the xy plane in polymethyl methacrylate for the 3D Accuitomo 170 (J Morita Mfg. Corp., Kyoto, Japan) and i-CAT NG (Imaging Sciences International, Hatfield, PA)
Film distributions obtained from various CBCT devices showed dose gradients corresponding to the obtained TLD dose distributions at a higher spatial resolution. These measurements were performed in parallel with the TLD measurements to investigate the applicability of film, but could not be calibrated for absolute dose values.
Discussion
In this study, the results of different types of dose distribution measurements in homogeneous phantoms are presented. A wide range of dose measurements, using different CBCT devices, exposure protocols, phantoms and dosemeters, have been carried out. A water phantom was used for measurements in the xy plane and yz plane and along the z axis using TLDs and a small-volume ion chamber. The PMMA phantom allowed for TLD measurements in the xy plane and the placement of radiochromic film. Although the use of film allowed for the visualization of dose distribution at a high spatial resolution, there are a few drawbacks that inhibit its application as a tool for dosimetry in this context. A highly sensitive film type is required to avoid the need for a large number of exposures. Furthermore, there are a number of measurement uncertainties associated with film.21 To obtain accurate quantitative results, a batch calibration is needed, or even individual film calibration, at beam energies corresponding to the CBCT exposure. In this study, film distributions were used as an additional visual analysis of dose gradients in the xy plane, but no quantitative assessment was made.
As shown by ion chamber and TLD measurements in water, the dose showed variations up to 20% along the z axis within the primary beam. For large-field FOVs (but especially for wide cone angles), the difference in dose will be more pronounced owing to a longer attenuation path for angled X-rays. When moving the measuring point outside the primary beam, distinctive scatter tails were observed. A few centimetres outside the primary beam, the dose showed a sharp drop to approximately 10% of the maximum dose, after which a gradual further decline can be seen. These scatter tails confirm the inadequacy of using a 100 mm pencil chamber as a dosimetry tool, as this type of ion chamber cannot cope with the wide range of beam widths used in dental CBCT.
In contrast to MDCT scanners, the dose distributions of CBCTs were asymmetrical in the xy plane when using off-axis positioning or partial rotation. For full rotation exposures using central positioning, the dose distribution was symmetrical and generally showed a central dose peak with a concentric dose gradient towards the periphery. For large FOVs, dose variations up to 20% were perceived, whereas small FOVs showed variability up to 40% as peripheral parts of the phantom were outside the primary beam for part of the rotation. A clear difference was observed between central and off-axis positioning, which is more pronounced for small FOVs. The general pattern of the dose distribution remains the same for different FOV positions, showing concentric (and left–right symmetrical) isodose curves around a dose peak in the isocentre. For off-axis positioning, this resulted in a semi-concentric dose gradient from the isocentre towards the opposing side of the phantom. Similar to central positioning, the magnitude of this gradient depended on the FOV diameter, but generally the dose dropped to 50% or less at the opposing side. Furthermore, it was shown that an exposure with a less than full rotation also influences the shape of the dose distribution. A gradient is apparent with dose values dropping to 20% and below, with the highest dose being found on the X-ray tube side of the phantom but keeping left–right symmetry.
The results show that there are three key factors determining the shape of the dose distribution as well as the magnitude of the dose gradient: the size and position of the FOV and the rotation arc. Another aspect which may lead to variations in distribution is the X-ray spectrum (voltage peak and filtration), as this determines the amount of attenuation and beam hardening. However, in this study, it was not possible to isolate the effect of the voltage peak. Most CBCT devices are found between 80 kVp and 120 kVp, and this value is usually fixed for each device. The only kilovoltage peak variation possible in practice was between 60 kVp and 90 kVp, which is not a relevant range. All of the exposure factors combined provides evidence that dental CBCT requires the definition of a specific dose index, which is able to cope with the different types of dose distributions depicted in the current study.
It has been shown in previous studies reporting TLD measurements in anthropomorphic phantoms that the effective dose and the individual organ absorbed doses can vary depending on the FOV size and positioning, and the amount and energy of exposure.6-8 It was also shown that the effective dose from a dental CBCT exposure is mainly defined by the absorbed dose of the salivary glands, thyroid gland, remainder tissues (especially oral mucosa and extrathoracic airways) and bone marrow. These findings suggest that the risk to the patient may be characterized by the absorbed dose at a few anatomical positions. This opens up the possibility for an anatomical dose index, which would be based on measurements performed at specific locations in a customized (head-like) phantom, and would provide an estimation of patient dose without a need for conversion. However, it is not feasible to put this type of index into routine practice. Therefore, the focus should be to establish a technical dose index as well as conversion factors linking it to patient dose.
Different dose indices can be proposed based on the results of this study. Although a variety of distribution patterns are observed for different exposure geometries, it should still be possible to define an index that is measured using a PMMA phantom and a small volume ion chamber. Owing to practical constraints (i.e. no possibility for fast rescanning), the number of measurements should be limited and focus on the mid-axial plane (z = 0) without measuring the scatter tails along the z axis. It was pointed out by Dixon and Boone15 that dose measurements in the central axial plane suffice for dose index determination, indicating that conversion factors relative to the height of the FOV can be applied when relating an index to patient dose. However, these findings cannot be directly applied to dental CBCT. For some devices, z-axis symmetry cannot be assumed, given that the beams can be tilted or shaped asymmetrically. This complicates the definition of a dose index using a limited number of measurements positions in the central axial plane. For CBCT devices using non-symmetrical beams, additional measurements may be needed along the z axis to verify dose symmetry and apply specific correction factors if needed. Furthermore, the xy dose distribution in MDCT can be described using a limited number of measurements, as the FOV always covers the entire object leading to a distribution with rotational symmetry. The xy distributions from the CBCTs presented in this study indicate that a different combination of measurement points is needed to the central and four peripheral points used for the CTDIw.
The CBCT dose index should be able to cope with different exposure geometries, meaning that it should be sensitive to differences in FOV diameter and positioning and non-full rotations. Based on the axial dose distributions in this study, two dose indices can be proposed. First of all, an index could be defined using a small-volume ion chamber, measuring centrally and at four peripheral positions in a cylindrical phantom. The FOV would have to be positioned centrally for these measurements at all times, as it would not be possible to measure the dose peak with the isocentre being positioned between the centre and the edge. The current results show rotational symmetry for small and large FOVs positioned centrally, indicating that four peripheral measurements would suffice. Front–back gradients due to partial rotations would be reflected by the difference in dose between the peripheral measurements. This index is similar to the CTDIw used in MDCT but should be interpreted as different because of the difference in exposure geometry between MDCT and CBCT. Conversion factors to patient dose could be determined separately for different FOV sizes. A second possibility for a dose index measured in a cylindrical phantom is to measure at different points along the diameter of the cylinder. Using this kind of index, the FOV can be positioned off axis (at one of the points along the diameter). By measuring at a number of additional positions between the centre and periphery, the gradient of doses owing to off-axis positioning and partial rotation would be reflected. The FOV positioning used for this index would reflect the clinical situation and facilitate conversion to patient dose. The index assumes left–right symmetry, which is seen in the xy dose distributions for the protocols involved in this study. To cope with potential left–right asymmetry, two additional peripheral measurements could be obtained.
A third possible dose index for dental CBCT is the DAP. Measurement of the DAP requires no customized phantom, and can be performed with a single exposure, which is of practical importance. Conversion coefficients between DAP and effective dose have been determined for intraoral, panoramic and cephalometric radiography.22-24 For CBCT, the conversion between DAP and effective dose is far more complicated, as the irradiated field size and positional factors need to be taken into account, which may complicate interpretation of this index.25 A study by Lofthag-Hansen et al16 converted DAP values to effective dose using conversion factors determined for panoramic radiography. However, before the DAP can be applied to estimate the effective dose for CBCT examinations, it is needed to determine specific conversion factors which take the entire exposure geometry into account. Monte Carlo simulations could be used to investigate the conversion between DAP and effective dose.18
The determination of an optimal dose index and conversion factors could lead to diagnostic reference levels (DRL) for dental CBCT. Specific DRLs will need to be defined for all patient groups undergoing CBCT examinations in dentistry. Combining DAP measurements from 41 CBCT units, Holroyd and Walker20 proposed an achievable DAP of 250 mGy cm2 for the placement of an implant in the upper molar region of an adult patient. This DRL was based on normalized values for a 4 × 4 cm field size, and is not achievable in practice as most CBCT devices have much larger minimal FOV sizes. Nonetheless, the proposed achievable DAP value, also recommended in the recent European guidelines,26 reflects the importance of FOV reduction for dose optimization in CBCT, and can be a useful starting point for the determination of achievable dose levels for other patient groups.
In conclusion, the variety of dose distributions for CBCT indicates the need for a specific dose index and appropriate conversion factors to link the index to effective patient dose. Further investigations should be made to assess the validity and practicality of dose indices using a small ion chamber and a suitable PMMA phantom and the use of DAP. Furthermore, the relationship between the dose indices and the effective dose should be investigated by defining conversion factors based on experimental results or dose simulations.
Footnotes
The research leading to the results in this study received funding from the European Atomic Energy Community's Seventh Framework Programme FP7/2007-2011, under grant agreement no. 212246 (SEDENTEXCT: Safety and Efficacy of a New and Emerging Dental X-ray Modality). The Manchester authors acknowledge the support of the NIHR Manchester Biomedical Research Centre.
References
- 1.Scarfe WC, Farman AG. What is cone-beam CT and how does it work? Dent Clin North Am 2008;52:707–730 [DOI] [PubMed] [Google Scholar]
- 2.Horner K, Islam M, Flygare L, Tsiklakis K, Whaites E. Basic principles for use of dental cone beam CT: consensus guidelines of the European Academy of Dental and Maxillofacial Radiology. Dentomaxillofac Radiol 2009;38:187–195 [DOI] [PubMed] [Google Scholar]
- 3.Scarfe WC, Farman AG, Sukovic P. Clinical applications of cone-beam computed tomography in dental practice. J Can Dent Assoc 2006;72:75–85 [PubMed] [Google Scholar]
- 4.Farman AG. ALARA still applies. Oral Surg Oral Med Oral Pathol Oral Radiol Endod 2005;100:395–397 [DOI] [PubMed] [Google Scholar]
- 5.Ludlow JB, Ivanovic M. Comparative dosimetry of dental CBCT devices and 64-slice CT for oral and maxillofacial radiology. Oral Surg Oral Med Oral Pathol Oral Radiol Endod 2008;106:106–114 [DOI] [PubMed] [Google Scholar]
- 6.Hirsch E, Wolf U, Heinicke F, Silva MA. Dosimetry of the cone beam computed tomography Veraviewepocs 3D compared with the 3D Accuitomo in different fields of view. Dentomaxillofac Radiol 2008;37:268–273 [DOI] [PubMed] [Google Scholar]
- 7.Pauwels R, Beinsberger J, Collaert B, Theodorakou C, Rogers J, Walker A, et al. Effective dose range for dental cone beam computed tomography scanners. Eur J Radiol 2012;81:267–271 [DOI] [PubMed] [Google Scholar]
- 8.International Electrotechnical Commission Medical electrical equipment, part 2–44: particular requirements for the safety of X-ray equipment for computed tomography. IEC publication no. 60601-2-44. Ed. 2. 1. Geneva, Switzerland: International Electrotechical Commission; 2002 [Google Scholar]
- 9.Fujii K, Aoyama T, Yamauchi-Kawaura C, Koyama S, Yamauchi M, Ko S, et al. Radiation dose evaluation in 64-slice CT examinations with adult and paediatric anthropomorphic phantoms. Br J Radiol 2009;82:1010–1018 [DOI] [PMC free article] [PubMed] [Google Scholar]
- 10.Dixon RL. A new look at CT dose measurement: beyond CTDI. Med Phys 2003;30:1272–1280 [DOI] [PubMed] [Google Scholar]
- 11.Mori S, Endo M, Nishizawa K, Tsunoo T, Aoyama T, Fujiwara H, et al. Enlarged longitudinal dose profiles in cone-beam CT and the need for modified dosimetry. Med Phys 2005;32:1061–1069 [DOI] [PubMed] [Google Scholar]
- 12.Nakonechny KD, Fallone BG, Rathee S. Novel methods of measuring single scan dose profiles and cumulative dose in CT. Med Phys 2005;32:98–109 [DOI] [PubMed] [Google Scholar]
- 13.Perisinakis K, Damilakis J, Tzedakis A, Papadakis A, Theocharopoulos N, Gourtsoyiannis N. Determination of the weighted CT dose index in modern multi-detector CT scanners. Phys Med Biol 2007;52:6485–6495 [DOI] [PubMed] [Google Scholar]
- 14.Dixon RL. Restructuring CT dosimetry—a realistic strategy for the future Requiem for the pencil chamber. Med Phys 2006;33:3973–3976 [DOI] [PubMed] [Google Scholar]
- 15.Dixon RL, Boone JM. Cone beam CT dosimetry: a unified and self-consistent approach including all scan modalities—with or without phantom motion. Med Phys 2010;37:2703–2718 [DOI] [PMC free article] [PubMed] [Google Scholar]
- 16.Lofthag-Hansen S, Thilander-Klang A, Ekestubbe A, Helmrot E, Gröndahl K. Calculating effective dose on a cone beam computed tomography device: 3D Accuitomo and 3D Accuitomo FPD. Dentomaxillofac Radiol 2008;37:72–79 [DOI] [PubMed] [Google Scholar]
- 17.Boone JM, Cooper VN, 3rd, Nemzek WR, McGahan JP, Seibert JA. Monte Carlo assessment of computed tomography dose to tissue adjacent to the scanned volume. Med Phys 2000;27:2393–2407 [DOI] [PubMed] [Google Scholar]
- 18.Vassileva J, Stoyanov D. Quality control and patient dosimetry in dental cone beam CT. Radiat Prot Dosim 2010;139:310–312 [DOI] [PubMed] [Google Scholar]
- 19.Thilander-Klang A, Helmrot E. Methods of determining the effective dose in dental radiology. Radiat. Prot. Dosim 2010;139:306–309 [DOI] [PubMed] [Google Scholar]
- 20.Holroyd JR, Walker A. Recommendations for the design of X-ray facilities and the quality assurance of dental cone beam CT (computed tomography) systems—a report of the HPA Working Party on dental cone beam CT. HPA-RPD-065. Didcot, UK: Health Protection Agency; March 2010 [Google Scholar]
- 21.Rampado O, Garelli E, Deagostini S, Ropolo R. Dose and energy dependence of response of Gafchromic XR-QA film for kilovoltage X-ray beams. Phys Med Biol 2006;51:2871–2881 [DOI] [PubMed] [Google Scholar]
- 22.Looe HK, Eenboom F, Chofor N, Pfaffenberger A, Sering M, Rühmann A, et al. Dose-area product measurements and determination of conversion coefficients for the estimation of effective dose in dental lateral cephalometric radiology. Radiat Prot Dosim 2007;124:181–186 [DOI] [PubMed] [Google Scholar]
- 23.Looe HK, Eenboom F, Chofor N, Pfaffenberger A, Steinhoff M, Rühmann A, et al. Conversion coefficients for the estimation of effective doses in intraoral and panoramic dental radiology from dose-area product values. Radiat Prot Dosim 2008;131:365–373 [DOI] [PubMed] [Google Scholar]
- 24.Helmrot E, Alm Carlsson G. Measurement of radiation dose in dental radiology. Radiat Prot Dosim 2005;114:168–171 [DOI] [PubMed] [Google Scholar]
- 25.Wise KN, Sandborg M, Persliden J, Alm Carlsson G. Sensitivity of coefficients for converting entrance surface dose and kerma-area product to effective dose and energy imparted to the patient. Phys Med Biol 1999;44:1937–1954 [DOI] [PubMed] [Google Scholar]
- 26.European Commission Cone beam CT for dental and maxillofacial radiology: evidence based guidelines, radiation protection publication 172. Luxembourg: European Commission; , 2012 [Google Scholar]