Abstract
Objectives
To determine the association between fitness and lifetime risk for cardiovascular disease (CVD).
Background
Higher levels of traditional risk factors are associated with marked differences in lifetime risks for CVD. However, data are sparse regarding the association between fitness and the lifetime risk for CVD.
Methods
We followed 11,049 men who underwent clinical examination at the Cooper Clinic in Dallas, TX before 1990 until the occurrence of CVD death, non-CVD death, or attainment of age 90 (281,469 person-years of follow-up, median follow-up 25.3 years, 1,106 CVD deaths). Fitness was measured by Balke protocol and categorized according to treadmill time into low-, intermediate-, and high- fitness with further stratification by CVD risk factor burden. Lifetime risk for CVD death determined by the National Death Index was estimated for fitness levels measured at ages 45-, 55-, and 65-years with non-CVD death as the competing event.
Results
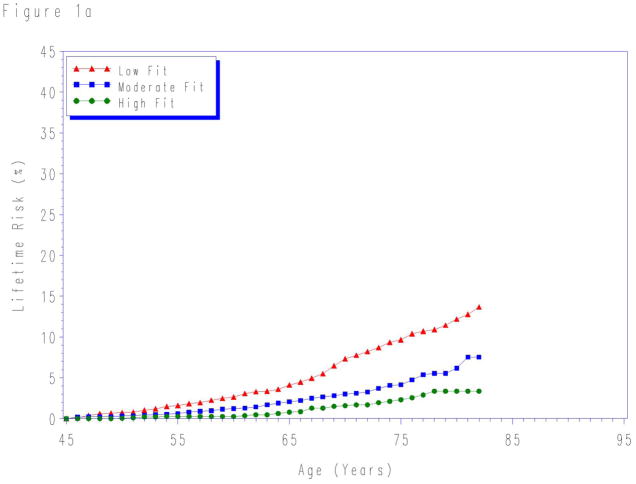
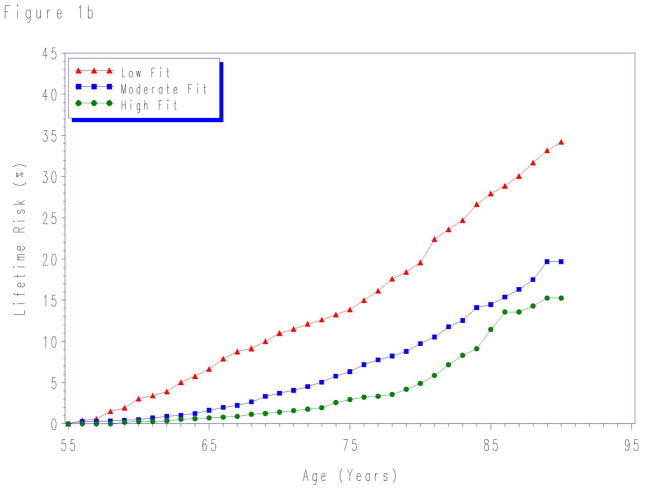
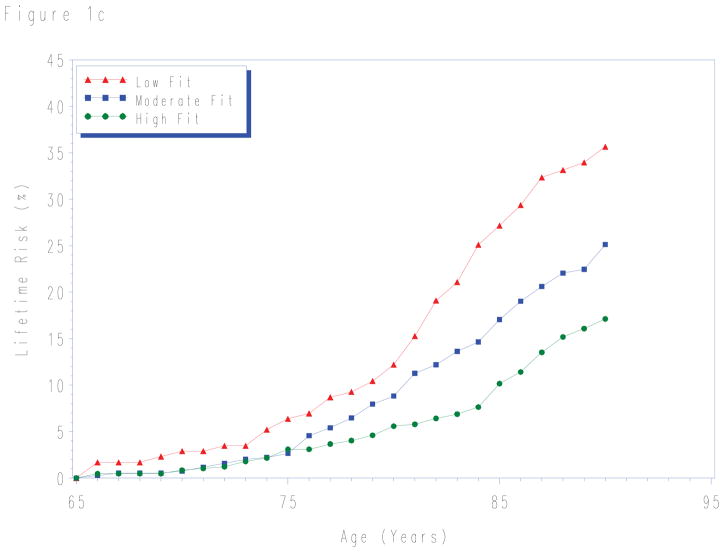
Differences in fitness levels (low- fitness versus high- fitness) were associated with marked differences in the lifetime risks for CVD death at each index age (age 45: 13.7% versus 3.4%; age 55: 34.2% versus 15.3%; age 65: 35.6% versus 17.1%). These associations were strongest among individuals with CVD risk factors.
Conclusions
A single measurement of low fitness in mid-life was associated with higher lifetime risk for CVD death, particularly among individuals with a high burden of CVD risk factors.
Keywords: cardiovascular disease, epidemiology, exercise testing, lifetime risk
INTRODUCTION
Despite a substantial decline in cardiovascular disease (CVD) death rates over the past three decades (1), CVD remains the leading cause of mortality in the United States. Moreover, recent data suggest that unfavorable lifestyle trends promoting weight gain are leading to an increase in some CVD risk factors such as diabetes, obesity, and metabolic syndrome, which may halt or even reverse the favorable trends in CVD death (1). For example, only 1 in 2 adults achieve recommended moderate or vigorous activity levels in a given week (2). Therefore, more effective public health and clinical strategies are needed to communicate the importance of lifestyle factors such as physical activity in preventing cardiovascular disease.
Prior research has demonstrated an independent, dose-dependent, inverse association between cardiorespiratory fitness and CVD outcomes among individuals with and without CVD at baseline (3–7). While the consistency of these data provide support for the protective role of fitness, the reporting of these associations as absolute or relative risk estimates has well-recognized limitations for risk communication strategies (8–11). Therefore, national guidelines suggest clinicians consider current risk factor burden within the context of long-term or lifetime risk for CVD (12–14).
We and others have reported the association between traditional risk factors (i.e. smoking, diabetes, cholesterol and blood pressure) and lifetime risks for CVD (15–17). However, it is unknown whether a single measurement of fitness in midlife is associated with lifetime risks for CVD many years later. In addition, the combined effect of fitness and traditional risk factors on lifetime risks for CVD mortality is also unknown.
Therefore, the purpose of the present study was to determine the association between fitness measured at ages 45-, 55-, and 65- years and the lifetime risks for CVD death using a well-characterized cohort from the Cooper Center Longitudinal Study (CCLS) with objectively measured fitness data. Because of the large sample size and long-term follow-up needed to create lifetime risk estimates, to our knowledge, this cohort represents one of the only available datasets to conduct such analyses.
METHODS
We included 11,049 men who underwent clinical examination at the Cooper Clinic in Dallas, TX, before 1990. Because of the long-term follow-up and large number of events required for lifetime risk analyses, we included men < 60 years with an initial examination prior to 1985 and men 60–69 years with an initial examination prior to 1990. These individuals were either self-referred or were referred by their employer or personal physician. Details of the clinical examination and the study cohort have been published previously (3–4). Participants completed a comprehensive clinical examination which included a self-reported personal and family history, standardized medical examination by a physician, fasting blood levels of total cholesterol, triglycerides, and glucose, as well as a maximal treadmill exercise test. Body mass index was calculated from measured height and weight. Participants signed an informed consent for the clinical examinations and follow-up, and the study was reviewed and approved annually by the institutional review board of the Cooper Institute as well as the University of Texas Southwestern Medical Center
Because the purpose of the present analysis is to determine the association between fitness levels and lifetime risks for CVD death, all participants were included in the study sample regardless of past medical history. In addition, no individual was excluded on the basis of their performance on the exercise treadmill portion of the examination. Women were not included in the present analysis because of the small numbers and low event rates, which precluded the possibility of creating reliable estimates of lifetime risk.
As reported previously (3–4), fitness was measured in the CCLS by a maximal treadmill exercise test using a Balke protocol. In this protocol, treadmill speed is set initially at 88 m/min. In the first minute, the grade is set at 0% followed by 2% in the second minute and an increase of 1% for every minute thereafter. After 25 minutes, the grade remains unchanged but the speed is increased 5.4 m/min for each additional minute until the test is terminated. Participants were encouraged not to hold onto the railing and were given encouragement to exert maximal effort. The test was terminated by volitional exhaustion reported by the participant or by the physician for medical reasons. As described previously, the test time using this protocol correlates highly with directly measured maximal oxygen uptake (r = 0.92) (18). Using well-characterized regression equations, treadmill times from the Balke protocol allow for estimation of fitness level in metabolic equivalents (METS) (18).
Mortality Surveillance
Study participants were followed up for mortality from the date of the initial, complete clinical examination through 2006. Before 1979, follow-up was completed by direct mail, telephone, contact with employer, and matching of records with Social Security Administration files. After the development of the National Death Index in 1979, all-cause mortality and deaths due to CVD (as indicated by ICD 9 codes 390.0 to 458.9, or equivalent codes from ICD-8 or 10) were included in the primary analysis. Additional details regarding follow-up of the CCLS cohort have been described previously in detail(3–4).
Statistical Analyses
We grouped participants according to fitness levels and risk factor levels as measured within ± 5 years from one of three index ages: 45-, 55-, and 65-years. For example, fitness levels and traditional risk factors measured between ages 40 and 49 years were included in the age 45 analyses. In order to estimate the lifetime risks of CVD mortality in different risk groups, participants were categorized according to (1) levels of fitness, (2) levels of traditional risk factors, and (3) combinations of fitness/traditional risk factor burden.
In accordance with standard approaches to the analysis of fitness data (3–4), treadmill times were compared with age- and sex-specific normative data on treadmill performance within the CCLS, allowing each individual’s treadmill time to be classified into an age- and sex-specific quintile of fitness. These quintiles of fitness measures were then combined into three, mutually exclusive fitness groupings: “low fitness”: quintile 1; “intermediate fitness”: quintiles 2–3; “high fitness”: quintiles 4–5. Where sample size allowed, additional analyses were performed among men with “very low fitness” defined as ≤ 6 METS.
Participants were stratified by baseline traditional risk factor burden using our previously published algorithm (16,19). Using this method, we stratified participants a priori into five mutually exclusive risk factor categories exclusive of medication data: all optimal risk factor levels, ≥1 not optimal risk factors, ≥1 elevated risk factors, 1 major risk factor only, or ≥2 major risk factors (see table 2 footnotes for details).
Table 2.
Comparison of Lifetime Risks* for Cardiovascular Disease Death (95% CI) by Traditional Risk Factor Burden Measured at Age 45-, 55-, and 65- years (Men) in the Cooper Center Longitudinal Study (CCLS) and the Cardiovascular Lifetime Risk Pooling Project (LRPP)(22)
| Risk Factor Status | |||||
|---|---|---|---|---|---|
| All Optimal RF | Not Optimal RF | ≥1 Elevated RF | 1 Major RF | ≥2 Major RF | |
| Age 45 Years | |||||
| Lifetime risks (CCLS) % | 0.46 (0–1.4) | 4.8 (1.8–7.5) | 7.5 (4.8–9.8) | 8.5 (6.9–10.0) | 12.5 (8.7–15.7) |
| Lifetime risks (LRPP) % | 9.1 (0–18.6) | 13.1 (9.9–16.3) | 15.3 (13.3–17.4) | 20.7 (19.4–22.2) | 32.5 (30.5–34.5) |
| Age 55 Years | |||||
| Lifetime risks (CCLS) % | 16.6 (0–33.1) | 17.0 (6.3–24.5) | 17.0 (11.3–21.3) | 23.3 (11.3–21.3) | 35.6 (27.6–41.7) |
| Lifetime risks (LRPP) % | 17.0 (6.8–27.3) | 20.7 (16.9–24.5) | 29.5 (27.2–31.8) | 32.3 (30.9–33.7) | 41.4 (39.6–43.2) |
| Age 65 Years | |||||
| Lifetime risks (CCLS) % | 23.2 (0–46.5) | 22.5 (13.3–30.2) | 20.6 (15.0–25.2) | 29.6 (23.3–34.9) | 37.1 (26.1–46.3) |
| Lifetime risks (LRPP) % | - | 18.4 (14.5–22.0) | 27.7 (25.3–30.2) | 33.6 (31.9–35.3) | 42.2 (40.0–44.4) |
Data are presented as percent (95% confidence interval). Empty cells in the table represent strata for which no reliable estimates of lifetime risks could be made secondary to small sample sizes.
“All Optimal RF” was defined as total cholesterol <180 mg/dL, blood pressure <120/<80 mm Hg, non-smoker, and non-diabetic. “Not Optimal RF” was defined as non-smoker and non-diabetic with total cholesterol 180 – 200 mg/dL, systolic blood pressure 120 – 140 mm Hg, or diastolic blood pressure 80 – 90 mm Hg. “Elevated RF” was defined as non-smoker and non-diabetic with total cholesterol 200 – 240 mg/dL, systolic blood pressure 140 – 160 mm Hg or diastolic blood pressure 90 – 100 mm Hg. “Major RF” was defined as current smoker or total cholesterol ≥ 240 mg/dL, systolic blood pressure ≥ 160 mm Hg, or diastolic blood pressure ≥ 100 mm Hg.
Lifetime risks to age 80-years (for age 45) and 90-years (for age 55- and 65-years).
LRPP: Cardiovascular Lifetime Risk Pooling Project; CCLS: Cooper Center Longitudinal Study; RF: risk factor; CI: confidence intervals
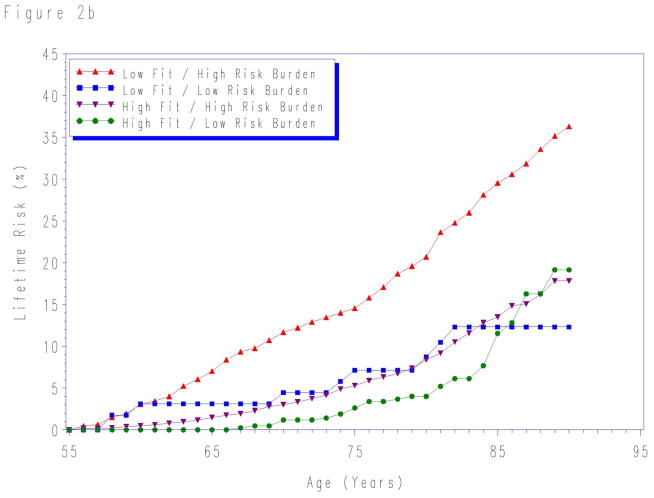
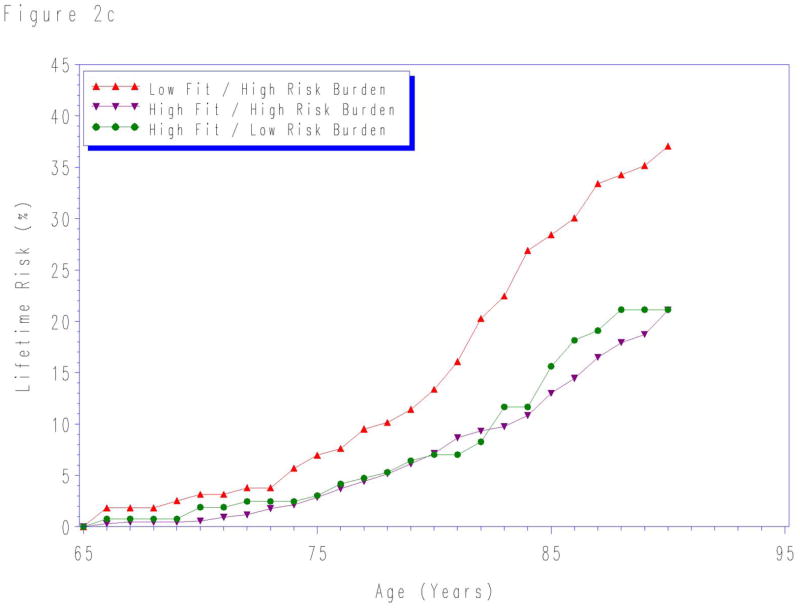
Participants were also stratified according to combinations of fitness and traditional risk factor burden as follows. First, fitness was categorized dichotomously as low fit (quintile 1) vs. high fit (quintile 2–5). Next, traditional risk factor burden was also analyzed categorically using our recently published algorithm, and classified for the purpose of these analyses as “high risk burden” (≥1 elevated risk factors, 1 major risk factor, or ≥2 major risk factors) and “low risk burden” (all optimal risk factor levels, ≥1 not optimal risk factors) (19). By combining traditional risk factor burden with the two levels of fitness, we were able to create four mutually exclusive risk groups at each index age: low risk burden/low fit; high risk burden/low fit; low risk burden/high fit; and high risk burden/high fit.
We calculated lifetime risk for CVD death for each risk group (as defined above) using a modified technique of survival analysis, as described previously (20–21). In this type of analysis, participants contributed information on the incidence of CVD and death free of CVD for each age they attained during follow up. Since the Kaplan-Meier cumulative incidence does not reflect the competing risk for death from other causes prior to development of CVD, adjustment was made for this competing risk to yield a true remaining lifetime risk for CVD. Therefore, significant differences between the lifetime risk estimate and the Kaplan-Meier estimate for CVD death suggest the importance of competing risks. Because of the unstable estimates that result when age-specific follow-up becomes limited, the follow-up period was truncated when weighted person-years were ≤ 90 for a given age of follow up.
In an effort to compare lifetime risks in the CCLS with prior lifetime risk estimates obtained from more representative cohorts, we compared lifetime risks for CVD death by traditional risk factor categories in the CCLS with lifetime risks for CVD death in the Cardiovascular Lifetime Risk Pooling Project (LRPP)(22). The LRPP represents a pooled analysis of 16 cohorts representing 64,907 participants from some of the most prominent observational cohorts in the US in the past 50 years. All statistical analyses were performed using SAS for Windows (release 9.2; SAS Institute, Inc., Cary, NC).
RESULTS
We included 11,049 men age 40–69 who had both traditional risk factor measurement and exercise treadmill tests performed prior to 1990. During 281,469 person-years of follow-up through 2006, there were 1,054 CVD deaths and 1,736 non-CVD deaths. The baseline characteristics of the study cohort stratified by levels of age and fitness are shown in Table 1. As expected, older age was associated with a higher prevalence of diabetes, a lower prevalence of current smoking, higher blood pressure, and generally lower total cholesterol levels. Within each age strata, higher levels of fitness were associated with lower levels of traditional risk factors. In addition, because we used age-specific cut-points for fitness levels, the mean METS within a given fitness level were higher at younger ages (i.e. age 45 (moderate fit): 10.8 METS versus age 65 (moderate fit): 8.3 METS.
Table 1.
Baseline Characteristics (Men) Stratified by Age and Fitness Level in the Cooper Center Longitudinal Study.
| Age 45 Years | Age 55 Years | Age 65 Years | |||||||
|---|---|---|---|---|---|---|---|---|---|
| Low Fit (N = 1,713) | Moderate Fit (N = 2,822) | High Fit (N = 1,912) | Low Fit (N = 802) | Moderate Fit (N = 1,492) | High Fit (N = 1,130) | Low Fit (N = 172) | Moderate Fit (N = 471) | High Fit (N= 535) | |
| Age (years) | 45.1 (2.6) | 44.9 (2.6) | 44.4 (2.5) | 54.8 (2.5) | 54.2 (2.5) | 54.1 (2.4) | 64.2 (2.4) | 63.7 (2.4) | 63.4 (2.2) |
| Systolic blood pressure (mm Hg) | 124.1 (14.5) | 120. (13.0) | 118.5 (12.4) | 129.2 (16.9) | 124.3 (14.6) | 123.6 (15.0) | 133.9 (16.4) | 130.4 (17.7) | 128.8 (17.6) |
| Total cholesterol (mmol/L) | 5.77 (1.0) | 5.60 (0.98) | 5.32 (0.90) | 5.93 (1.1) | 5.80 (0.97) | 5.59 (0.95 | 5.87 (1.27) | 5.71 (0.96) | 5.61 (1.02) |
| Body mass index (kg/m2) | 28.2 (4.2) | 26.1 (2.8) | 24.5 (2.2) | 28.1 (4.0) | 26.4 (2.9) | 26.4 (2.9) | 27.6 (4.3) | 26.7 (4.5) | 24.9 (2.6) |
| Smokers (%) | 37.0 | 21.4 | 10.7 | 29.6 | 21.9 | 9.8 | 20.4 | 12.5 | 7.9 |
| Diabetes (%) | 5.8 | 2.8 | 1.2 | 7.9 | 5.8 | 3.2 | 12.2 | 4.5 | 2.8 |
| METS | 8.4 (1.0) | 10.8 (0.7) | 13.9 (1.5) | 7.4 (0.9) | 9.6 (0.7) | 12.6 (1.5) | 5.9 (0.8) | 8.3 (0.7) | 11.2 (1.6) |
| CVD deaths, N (%) | 163 (9.5) | 115 (4.1) | 35 (1.8) | 212 (26.4) | 191 (12.8) | 85 (7.5) | 61 (35.5) | 110 (23.4) | 82 (15.3) |
Data are presented as mean (SD) or percentages. METS expressed as 3.5 ml O2 · kg−1 · min−1.
Lifetime Risks for CVD Death by Traditional Risk Factor Levels
In order to compare the lifetime risks in the CCLS with other cohorts, we determined the lifetime risks for CVD death stratified by traditional risk factor burden using our previously published algorithm(16,19). As expected, higher levels of traditional risk factors was associated with a higher lifetime risk for CVD death in the CCLS. Although the estimates were lower for men at age 45-years, the lifetime risk estimates for CVD death for men at age 55- and 65-years were overall quite similar to those estimates obtained from the LRPP, a pooled lifetime risk analysis of 16 unique study cohorts representing 64,907 individuals(22) (Table 2).
Lifetime Risks and Survival for CVD Death by Fitness Levels
Lifetime risks for CVD death to age 80- and 90-years stratified by fitness levels measured at each index age are shown in Table 3. For each age group, lower levels of fitness were associated with higher lifetime risks for CVD death. Although in the first 10 years the risk for CVD death was similar for all fitness levels (Figure 1), there were marked differences in the lifetime risk for CVD death across the remaining lifespan.
Table 3.
Lifetime Risk for Cardiovascular Disease Death (95% CI) Stratified by Fitness Level Measured at Age 45-, 55-, and 65-years in the Cooper Center Longitudinal Study.
| Lifetime Risk to Age 80 | Lifetime Risk to Age 90* | ||||||
|---|---|---|---|---|---|---|---|
|
|
|
||||||
| Age | High Fitness (N = 2,687) | Moderate Fitness (N = 4,785) | Low Fitness (N = 3,577) | Very Low Fitness† (N = 174) | High Fitness (N = 2,687) | Moderate Fitness (N = 4,785) | Low Fitness (N = 3,577) |
| 45 Years | 3.4 (1.7 – 4.9) | 6.2 (4.6 – 7.6) | 12.2 (9.7 – 14.2) | -- | 3.4 (1.7 – 4.9) | 7.5 (5.1 – 9.6) | 13.7 (9.8 – 16.6) |
| 55 Years | 4.9 (3.4 – 6.3) | 9.8 (8.1 – 11.3) | 19.6 (16.5 – 22.4) | 28.7 (17.2 – 39.1) | 15.3 (10.1 – 19.2) | 19.7 (15.0 – 23.1) | 34.2 (27.1 – 39.0) |
| 65 Years | 5.6 (3.5 – 7.6) | 8.8 (6.0 – 11.4) | 12.2 (6.7 – 17.4) | 15.2 (6.1 – 23.3) | 17.1 (12.0 – 21.2) | 25.1 (19.5 – 29.7) | 35.6 (26.5 – 43.7) |
Data are presented as percent (95% confidence interval). Empty cells in the table represent strata for which no reliable estimates of lifetime risks could be made secondary to small sample sizes.
To age 85 years for age 45-years group.
METS ≤ 6.
Figure 1.
Lifetime risks for cardiovascular disease death in men stratified by cardiorespiratory fitness measured at age a) 45-, b) 55-, and c) 65-years. Treadmill times were compared with normative data on treadmill performance allowing treadmill time to be classified into an age-specific quintile of fitness. Quintile 1 defined as “low fit”; quintiles 2–3 as “intermediate fit”; and quintiles 4–5 as “high fit”. See methods for details.
Lifetime Risks for CVD Death by Both Traditional Risk Factor Burden and Fitness
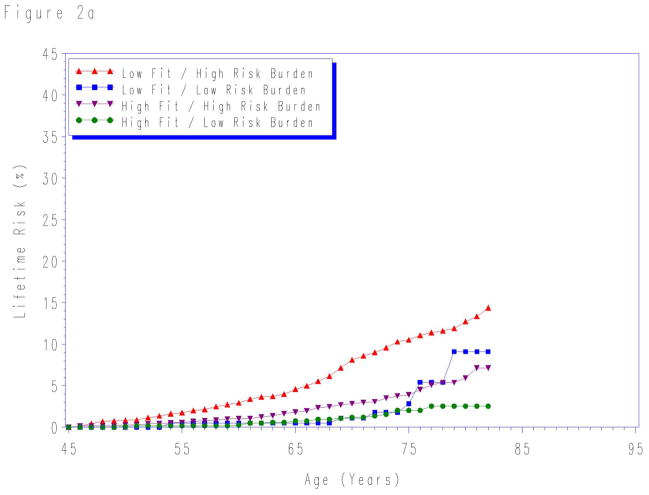
When participants were stratified by aggregate risk factor burden and fitness level, the lifetime risk for CVD death was lowest in the high fit/low risk burden group for risk factors measured at each index age (Figure 2). The lifetime risks were highest for individuals with both low fitness level and high levels of traditional risk factors at each index age. In contrast, the lifetime risks were intermediate for groups with either low fitness or high traditional risk factors risk, but not both.
Figure 2.
Lifetime risks for cardiovascular disease death stratified by cardiorespiratory fitness and risk factor burden measured at age a) 45-, b) 55-, and c) 65-years. Quintile 1 defined as “low fit”; quintiles 2–5 as “high fit”. “Low risk burden” defined as the combined presence of non-smoking status and non-diabetic status with total cholesterol < 200 mg/dL, systolic blood pressure < 140 mm Hg, and diastolic blood pressure < 90 mm Hg. “High risk burden” defined as the presence of one or more of the following: current smoker, diabetes, total cholesterol ≥ 200 mg/dL, systolic blood pressure ≥ 140 mm Hg, and/or diastolic blood pressure ≥ 90 mm Hg. See methods for details. At age 65-years, the sample size was insufficient to create reliable lifetime risk estimates for low fit/low risk factor burden group.
Competing Risks Across the Lifespan
Compared with Kaplan-Meier cumulative incidence data for CVD death, adjustment for competing causes of death resulted in a decrease in the lifetime risks for CVD death across all age, fitness, and risk factor groups studied (data not shown). The evidence for competing risks was most prominent at older ages and at lower levels of fitness where the rates of non-CVD death are highest. For example, among men with high fitness levels measured at age 55 years, the lifetime risks for CVD death were similar to the unadjusted, Kaplan Meier estimate (Kaplan-Meier cumulative incidence 13.1% versus lifetime risk 11.5%). In contrast, among men age 55 years with very low fitness levels (≤ 6 METS), the unadjusted Kaplan Meier estimate was higher than the lifetime risk estimate adjusted for competing risk (Kaplan-Meier = 44.0% lifetime risk = 35.7%).
DISCUSSION
We observed several important findings in this study. First, the lifetime risks for CVD death according to traditional risk factors in the CCLS were similar to those obtained in a larger, more representative cohort. Thus, although the risk factor burden is lower in the CCLS compared to the general population, the association of these risk factors with lifetime risks for CVD mortality was quite similar, particularly for men at age 55- and 65- years. Second, low fitness obtained from a single fitness measurement was associated with marked differences in the lifetime risks for CVD death more than 30 years later. Finally, the combination of high fitness with a high traditional risk factor burden was associated with a lifetime risk for CVD death that was comparable to an individual with low risk factor burden.
Multiple prior studies have shown that a single measurement of cholesterol or blood pressure in mid-life was associated with marked differences in CVD risk across 30 or more years of follow-up (16,23–24). The findings in the present study extend these observations to physical fitness. Despite the effects of interval changes in fitness over time, the presence of a single measurement of low physical fitness in mid-life translated into a 15–20% absolute difference in the lifetime risk for CVD death.
Furthermore, among individuals with elevated cholesterol, hypertension, diabetes, or current smoking status, the presence of a higher fitness level in midlife attenuated substantially the risk from traditional risk factors. These data have potential implications for public health and clinical practice, providing novel insight into the importance of fitness for long-term CVD risk, particularly among those with elevated traditional risk factor burden.
Current Study in Context
Several prior studies have described the association between levels of fitness and the risk for CVD mortality, including the Lipid Research Clinics Trial (5), the Veteran Affairs study (7), and previous reports from the Cooper Center Longitudinal Study (3–4). These prior studies as well as a recent meta-analysis (6) have demonstrated a consistent, inverse association between fitness and mortality in individuals with and without prevalent CVD at baseline and after adjustment for traditional risk factors.
In general, these studies have applied conventional statistical techniques to provide both absolute and relative risk estimates. Because these techniques censor data at the time of a competing (non-CVD) death, they cannot be extrapolated to estimate cumulative risk across the lifespan when competing risks can be substantial. In addition, relative and absolute risk estimates have well-recognized limitations for risk communication strategies (8–11,25–27). In particular, relative risks require comparison to a basal rate that is rarely known in practice by patients or by physicians. Although absolute risks overcome this limitation, short-term absolute risks do not reflect risks across the remaining lifespan (28).
The current study provides a clinically relevant and intuitive estimate of the association between fitness, traditional risk factors, and long-term risk. With the knowledge of a man’s age, fitness, and risk factor status, clinicians can provide an estimate of the lifetime risk for CVD death. For example, consider a 55-year old man able to walk one mile in 15 minutes, consistent with very low fitness (METS < 6). With these data, we would predict that his lifetime risk for CVD death was nearly 30%. In contrast, a man able to run a 10-minute mile (i.e. moderate fitness or 10 METS) would have an estimated lifetime risk of CVD mortality of just 10%.
Limitations
The present study has several important limitations. First, participants in the CCLS represent a unique sample of well-educated individuals with a relatively high socioeconomic status compared to the general population. Therefore, these results may not generalize to individuals with a lower educational status or socioeconomic level. However, the association between traditional risk factor burden and lifetime risk observed in the CCLS at age 55- and 65-years were strikingly similar to those obtained from a large, pooled cohort of 16 unique studies(22). For men at these ages, we believe these findings are generalizable to the broader population, extending prior work on lifetime risks for CVD to include fitness, an additional, modifiable lifestyle factor. However, the present findings may not generalize to men at age 45-years given the overall lower lifetime risks for CVD in this subgroup.
Second, the ability to adequately control for competing risks is reliable but somewhat limited using mortality from death certificates because of the presence of misclassifications of non-CVD death as CVD death at older ages (29). Thus, we expect that adjudicated CVD deaths would have yielded lower estimates across all risk groups, particularly among the highest fit groups. Therefore, we expect that the actual lifetime risks for CVD death among the highest fit groups are actually lower than those reported in the present paper.
Finally, we assessed the association between a single measurement of fitness and the risk for CVD more than 30 years later. Although we acknowledge that fitness levels most certainly changed over the follow-up period, we feel that this actually represents a significant strength of our findings. In spite of these changes over time, a single measurement of fitness in midlife represents a strong determinant of long-term CVD risk. These data provide additional support for the importance of fitness in midlife and could be useful in efforts to promote risk communication.
Conclusions
In summary, using a large, well-characterized cohort with long-term follow-up, we report the association between fitness levels and lifetime risks for CVD. In this study, a single measurement of fitness in midlife was associated with marked differences in the lifetime risk for CVD mortality more than 30 years later—particularly among those with at least on risk factor in midlife. These data emphasize the importance of fitness on long-term cardiovascular health and could be useful for practicing clinicians to facilitate more effective risk communication regarding the health benefits of fitness.
Acknowledgments
Funding Sources
Dr. Berry receives funding from (1) the Dedman Family Scholar in Clinical Care endowment at UT Southwestern Medical Center, (2) grant K23 HL092229 from the National Heart, Lung, and Blood Institute, and (3) grant 10BG1A4280091 from the American Heart Association. The corresponding author had full access to all data in the study and had final responsibility for the decision to submit for publication. All authors have read and agree to the manuscript as written.
ABREVIATIONS
- CVD
cardiovascular disease
- CCLS
Cooper Center Longitudinal Study
- METS
metabolic equivalents
- LRPP
Lifetime Risk Pooling Project
Footnotes
Disclosures
Dr. Berry has received honoraria from Merck/Schering. Dr. Khera reports a consulting relationship with Daiichi-Sankyo. All other authors report no conflicts of interest.
Publisher's Disclaimer: This is a PDF file of an unedited manuscript that has been accepted for publication. As a service to our customers we are providing this early version of the manuscript. The manuscript will undergo copyediting, typesetting, and review of the resulting proof before it is published in its final citable form. Please note that during the production process errors may be discovered which could affect the content, and all legal disclaimers that apply to the journal pertain.
References
- 1.Lloyd-Jones D, Adams R, Carnethon M, et al. Heart disease and stroke statistics--2009 update: a report from the American Heart Association Statistics Committee and Stroke Statistics Subcommittee. Circulation. 2009;119:480–6. doi: 10.1161/CIRCULATIONAHA.108.191259. [DOI] [PubMed] [Google Scholar]
- 2.Schoenborn CA, Adams PF, Barnes PM, Vickerie JL, Schiller JS. Health behaviors of adults: United States, 1999–2001. Vital Health Stat. 2004;10:1–79. [PubMed] [Google Scholar]
- 3.Blair SN, Kohl HW, Barlow CE, Paffenbarger RS, Gibbons LW, Macera CA. Changes in physical fitness and all-cause mortality. A prospective study of healthy and unhealthy men. JAMA. 1995;273:1093–8. [PubMed] [Google Scholar]
- 4.Blair SN, Kohl HW, 3rd, Paffenbarger RS, Jr, Clark DG, Cooper KH, Gibbons LW. Physical fitness and all-cause mortality. A prospective study of healthy men and women. JAMA. 1989;262:2395–401. doi: 10.1001/jama.262.17.2395. [DOI] [PubMed] [Google Scholar]
- 5.Ekelund LG, Haskell WL, Johnson JL, Whaley FS, Criqui MH, Sheps DS. Physical fitness as a predictor of cardiovascular mortality in asymptomatic North American men. The Lipid Research Clinics Mortality Follow-up Study. N Engl J Med. 1988;319:1379–84. doi: 10.1056/NEJM198811243192104. [DOI] [PubMed] [Google Scholar]
- 6.Kodama S, Saito K, Tanaka S, et al. Cardiorespiratory Fitness as a Quantitative Predictor of All-Cause Mortality and Cardiovascular Events in Healthy Men and Women: A Meta-analysis. JAMA. 2009;301:2024–2035. doi: 10.1001/jama.2009.681. [DOI] [PubMed] [Google Scholar]
- 7.Myers J, Prakash M, Froelicher V, Do D, Partington S, Atwood JE. Exercise Capacity and Mortality among Men Referred for Exercise Testing. N Engl J Med. 2002;346:793–801. doi: 10.1056/NEJMoa011858. [DOI] [PubMed] [Google Scholar]
- 8.Edwards A, Elwyn G, Mulley A. Explaining risks: turning numerical data into meaningful pictures. BMJ. 2002;324:827–830. doi: 10.1136/bmj.324.7341.827. [DOI] [PMC free article] [PubMed] [Google Scholar]
- 9.Edwards A, Elwyn G, Stott N. Communicating risk reductions. Researchers should present results with both relative and absolute risks. Bmj. 1999;318:603. author reply 603–4. [PubMed] [Google Scholar]
- 10.Edwards A, Hood K, Matthews E, et al. The effectiveness of one-to-one risk communication interventions in health care: a systematic review. Med Decis Making. 2000;20:290–7. doi: 10.1177/0272989X0002000305. [DOI] [PubMed] [Google Scholar]
- 11.Ridker PM, Cook N. Should Age and Time Be Eliminated From Cardiovascular Risk Prediction Models?: Rationale for the Creation of a New National Risk Detection Program. Circulation. 2005;111:657–658. doi: 10.1161/01.CIR.0000154544.90488.52. [DOI] [PubMed] [Google Scholar]
- 12.De Backer G, Ambrosioni E, Borch-Johnsen K, et al. European guidelines on cardiovascular disease prevention in clinical practice. Third Joint Task Force of European and other Societies on Cardiovascular Disease Prevention in Clinical Practice. Atherosclerosis. 2004;173:381–391. [PubMed] [Google Scholar]
- 13.Expert Panel on Detection E, and Treatment of High Blood Cholesterol in Adults. Third Report of the National Cholesterol Education Program (NCEP) Expert Panel on Detection, Evaluation, and Treatment of High Blood Cholesterol in Adults (Adult Treatment Panel III) Final Report. Circulation. 2002;106:3143–3421. [PubMed] [Google Scholar]
- 14.Mosca L, Banka CL, Benjamin EJ, et al. Evidence-Based Guidelines for Cardiovascular Disease Prevention in Women: 2007 Update. Circulation. 2007;115:1481–501. doi: 10.1161/CIRCULATIONAHA.107.181546. [DOI] [PubMed] [Google Scholar]
- 15.Lloyd-Jones DM, Dyer AR, Wang R, Daviglus ML, Greenland P. Risk Factor Burden in Middle Age and Lifetime Risks for Cardiovascular and Non-Cardiovascular Death (Chicago Heart Association Detection Project in Industry) The American Journal of Cardiology. 2007;99:535–540. doi: 10.1016/j.amjcard.2006.09.099. [DOI] [PMC free article] [PubMed] [Google Scholar]
- 16.Lloyd-Jones DM, Leip EP, Larson MG, et al. Prediction of Lifetime Risk for Cardiovascular Disease by Risk Factor Burden at 50 Years of Age. Circulation. 2006;113:791–798. doi: 10.1161/CIRCULATIONAHA.105.548206. [DOI] [PubMed] [Google Scholar]
- 17.Pencina MJ, D’Agostino RB, Sr, Larson MG, Massaro JM, Vasan RS. Predicting the 30-Year Risk of Cardiovascular Disease: The Framingham Heart Study. Circulation. 2009;119:3078–3084. doi: 10.1161/CIRCULATIONAHA.108.816694. [DOI] [PMC free article] [PubMed] [Google Scholar]
- 18.Pollock ML, Bohannon RL, Cooper KH, et al. A comparative analysis of four protocols for maximal treadmill stress testing. Am Heart J. 1976;92:39–46. doi: 10.1016/s0002-8703(76)80401-2. [DOI] [PubMed] [Google Scholar]
- 19.Berry JD, Liu K, Folsom AR, et al. Prevalence and Progression of Subclinical Atherosclerosis in Younger Adults with Low 10-Year Risk but High Lifetime Risk for Cardiovascular Disease: Findings from the CARDIA and MESA Studies. Circulation. 2009;119:382–389. doi: 10.1161/CIRCULATIONAHA.108.800235. [DOI] [PMC free article] [PubMed] [Google Scholar]
- 20.Beiser A, D’Agostino R, Seshadri S, Sullivan L, Wolf P. Computing estimates of incidence, including lifetime risk. Statist Med. 2002;9:1495–1522. doi: 10.1002/(sici)1097-0258(20000615/30)19:11/12<1495::aid-sim441>3.0.co;2-e. [DOI] [PubMed] [Google Scholar]
- 21.Gaynor JJ, Feuer EJ, Tan CC, et al. On the use of cause-specific failure and conditional failure probabilities. J Am Stat Assoc. 1993;88:402–409. [Google Scholar]
- 22.Berry JD, Garside DB, Cai X, Dyer ADML-J. Remaining Lifetime Risks for Cardiovascular Disease Death by Risk Factor Burden at Selected Ages in Black and White Men and Women. Circulation. 2007;116:II–832. [Google Scholar]
- 23.Stamler J, Daviglus ML, Garside DB, Dyer AR, Greenland P, Neaton JD. Relationship of Baseline Serum Cholesterol Levels in 3 Large Cohorts of Younger Men to Long-term Coronary, Cardiovascular, and All-Cause Mortality and to Longevity. JAMA. 2000;284:311–318. doi: 10.1001/jama.284.3.311. [DOI] [PubMed] [Google Scholar]
- 24.Stamler J, Dyer AR, Shekelle RB, Neaton J, Stamler R. Relationship of baseline major risk factors to coronary and all-cause mortality, and to longevity: findings from long-term follow-up of Chicago cohorts. Cardiology. 1993;82:191–222. doi: 10.1159/000175868. [DOI] [PubMed] [Google Scholar]
- 25.Jackson R. Guidelines on preventing cardiovascular disease in clinical practice. BMJ. 2000;320:659–61. doi: 10.1136/bmj.320.7236.659. [DOI] [PMC free article] [PubMed] [Google Scholar]
- 26.Rose G. Environmental health: problems and prospects. J R Coll Physicians Lond. 1991;25:48–52. [PMC free article] [PubMed] [Google Scholar]
- 27.Vine DL, Hastings GE. Ischaemic heart disease and cholesterol. Absolute risk more informative than relative risk. BMJ. 1994;308:1040–1041. [PMC free article] [PubMed] [Google Scholar]
- 28.Lloyd-Jones DM, Wilson PWF, Larson MG, et al. Framingham risk score and prediction of lifetime risk for coronary heart disease. The American Journal of Cardiology. 2004;94:20–24. doi: 10.1016/j.amjcard.2004.03.023. [DOI] [PubMed] [Google Scholar]
- 29.Lloyd-Jones DM, Martin DO, Larson MG, Levy D. Accuracy of Death Certificates for Coding Coronary Heart Disease as the Cause of Death. Ann Intern Med. 1998;129:1020–1026. doi: 10.7326/0003-4819-129-12-199812150-00005. [DOI] [PubMed] [Google Scholar]


