

Abstract
Cell death is a fundamental biological process that is present in numerous disease pathologies. Fluorescent probes that detect cell death have been developed for a myriad of research applications ranging from microscopy to in vivo imaging. Here we describe a synthetic near infrared conjugate of zinc(II)-dipicolylamine (Zn2+-DPA) for in vivo imaging of cell death. Chemically induced in vivo models of myopathy were established using an ionphore, ethanol, or ketamine as chemical cytotoxins. The Zn2+-DPA fluorescent probe or corresponding control was subsequently injected and whole animal fluorescence imaging demonstrated probe uptake at the site of muscle damage, which was confirmed by ex vivo and histological analyses. Further, a comparative study with a near-infrared fluorescent conjugate Annexin V showed less intense uptake at the site of muscle damage and high accumulation in the bladder. The results indicate that the fluorescent Zn2+-DPA conjugate is an effective probe for in vivo cell death detection and in some cases may be an appropriate alternative to fluorescent Annexin V conjugates.
Keywords: in vivo imaging, cell death, near-infrared probe, zinc-dipicolylamine, annexin V, ketamine
INTRODUCTION
Cell death is a fundamental biological process that takes place during normal development and homeostasis as old cells are replaced by new. However, several pathologies are associated with cell and tissue death including stroke,1 cirrhosis,2 myopathy,3 blunt trauma,4 and heart disease.5 In other instances, cancerous or infected tissue is intentionally damaged as a result of therapeutic intervention. In each of these cases, the extent of tissue damage is a critical information component for diagnosis of disease status and assessing treatment efficacy. This need has spurred the development of molecular imaging methods for detecting and monitoring cell death processes in pre-clinical research using animal models of disease,6 and also for applications in clinical settings.7 An early outcome of this work was the invention of robust fluorescence assays that identify and quantify populations of apoptotic cells within cultures or biopsy samples.8 Building on this success are ongoing efforts to develop methods for imaging dead and dying tissue in vivo.9 A popular strategy utilizes activatable cell penetrating peptides (“smart probes”) to target the intracellular proteins that are activated during cell death, specifically the caspase enzymes. 10 While these probes are useful when administered into specific anatomic compartments (e.g. vitreous humor), a limitation for in vivo whole body imaging is the pharmacokinetic challenge of achieving sufficient delivery to intracellular targets. These limitations can be improved by altered sequences and the use of D-peptides,11 PEGylation of cell penetrating peptides,12 or avoided entirely with imaging methods that target the cell exterior. A well-known cell surface biomarker that becomes exposed during cell activation and also cell death is phosphatidylserine (PS), an anionic phospholipid that is otherwise maintained in the plasma membrane inner leaflet of healthy cells.13,14 PS exposure is thought to be a hallmark of all types of cell death,15 providing an abundant biomarker with an estimated 106-109 binding sites per cell.16 The most studied targeting agent for PS-rich membranes is Annexin V, a 36 kDa protein that binds in a Ca2+-dependent manner. 17 Various research groups have studied radioactive conjugates of Annexin V for deep tissue imaging. 18 The published studies show promising performance, but there are technical drawbacks to using this protein as a molecular imaging probe. Controlled bioconjugation of the native protein structure is not trivial as there are 23 potentially reactive amine residues, and it is known that attachment of multiple reporter groups can diminish Annexin V’s affinity for target membranes.19 As a potential solution to this bioconjugation stoichiometry problem, a sitespecific cysteine mutant has been reported and is under investigation.19b In terms of pharmacokinetics, it is challenging to rationally control the clearance rate of Annexin V conjugates, and optimal imaging times with radiolabeled versions have been reported to change with the structural identity of the radiolabel.20 Since Annexin V is a reasonably large protein, there is also a concern with its long-term storage stability and potential immunogenicity.21
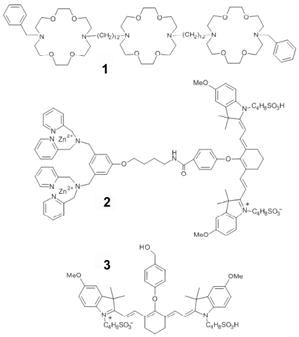
These deficiencies have motivated researchers to search for low molecular weight probes that target exposed PS.22 One approach is to investigate fragments and domains of PS binding proteins.23 Another approach utilizes phage panning to uncover small peptides that have strong affinity for PS.24 An alternative strategy, employed by our group, uses the principles of supramolecular chemistry to design synthetic receptor molecules with PS affinity. These efforts have produced a series of zinc(II)-dipicolylamine (Zn2+-DPA) complexes with an ability to selectively associate with the anionic membrane surfaces of dead and dying cells in cell culture.25 Fluorescent conjugates of the Zn2+-DPA complexes have utility in cell death assays using optical microscopy and flow cytometry.26 However, visible light has poor tissue penetration, which limits in vivo imaging applications with optical probes. It is well-known that tissue penetration is maximized when light is within the window of 650—900 nm,27 and for this reason, we have designed probe 2, which contains a near-infrared (NIR) carbocyanine fluorophore with an absorption/emission maxima of 794/810 nm.28 Probe 2 was recently used to image dead and dying cells within tumors in rodent models as judged by planar, whole animal fluorescence imaging followed by histology.29 This success has prompted us to evaluate the in vivo imaging performance of probe 2 in other animal models of cell death, and to compare its pharmacokinetic performance with Annexin-Vivo 750, a commercially available NIR fluorescent conjugate of Annexin V.30 We also conducted in vivo cell death imaging with control fluorophore 3, which has the same NIR photophysical properties as probe 2 but lacks the Zn2+-DPA element. Control 3 thus serves as an untargeted fluorophore for non-specific uptake at the site of cell death.
Molecular imaging of cell death in living animals is a challenging task because the death process is a time-dependent phenomenon, the kinetic profile of which is tissue dependent. The image signal contrast is determined by multiple factors, including the rate of probe clearance from the bloodstream, the rate and location of the cell death process, and the rate of dead cell clearance by the animal’s innate immune response. Furthermore, the strong attenuation of optical imaging signal with tissue depth means that quantitative information can be gained only with superficial imaging sites that are close to the animal surface. To minimize these variables, we chose to conduct a comparative optical imaging study of damaged mouse leg muscle at depths of < 5 mm. The study used three different compounds to induce acute cell death and tissue damage: a synthetic ionophore (1), ethanol, and ketamine. Ionophore 1 forms stable, cation-conducting channels in phospholipid bilayers31 and induces rapid cell death with little cell selectivity.32,33 Its calculated logP value is in excess of 10,34 so it inserts solely into cells that are very near the site of direct injection with minimal short-term damage to remote tissue. Because of its hydrophobicity, ionophore 1 was injected as a solution in ethanol, which is itself a moderate cytotoxic agent. Indeed, ethanol is used as a sclerotic agent for tumor ablation in human patients via direct injection chemotherapy.35,36 Ethanol has also been used previously to damage tissue for nuclear imaging studies in rats.37 Therefore, we imaged the tissue damage caused by injecting ethanol with the expectation that it would be less severe than ionophore 1. In addition, we imaged the local muscle damage that is caused by injecting ketamine, a widely used anesthetic in veterinary medicine and also employed in human pediatrics. There is literature indicating that high doses of ketamine causes localized cell toxicity38 and that the tissue damage can be imaged with a probe that targets exposed PS.39
RESULTS
Initial experiments compared the ability of probe 2 and control fluorophore 3 to target and image damaged muscle tissue in nude mice (strain nu/nu, Taconic Inc.). First, three cohorts of eight animals were anesthetized and given an intramuscular injection in the right rear leg muscle with either ionophore 1 (0.5 mg in a 50 μL solution in ethanol), ethanol (100%, 50 μL), or ketamine (5.0 mg in a 50 μL of water). Next, each animal was given a 50 μL injection of saline solution in the opposite leg to serve as an injection control. After the animals were dosed with cytotoxin, they were returned to their cages for two hours. Each injection group of eight mice was then separated into two cohorts of four mice. One cohort was injected intravenously with a solution of probe 2, and a second cohort was treated with an identical intravenous injection of control 3.40 Each animal was then imaged over time using a planar, whole-body fluorescence scanner with a near-infrared filter set (ex. 750 ± 10 nm, em. 830 ± 20 nm). The reflected fluorescence images were overlaid on X-ray images to facilitate anatomical co-registration. Figure 1 shows a comparison of images acquired 24 hours after the injection of imaging probes (images for the complete time course are shown in Figs S1-S6). Probe 2 had localized to the sites of tissue damage in the rear leg, while control 3 could only be seen in the liver and intestines.
Figure 1.
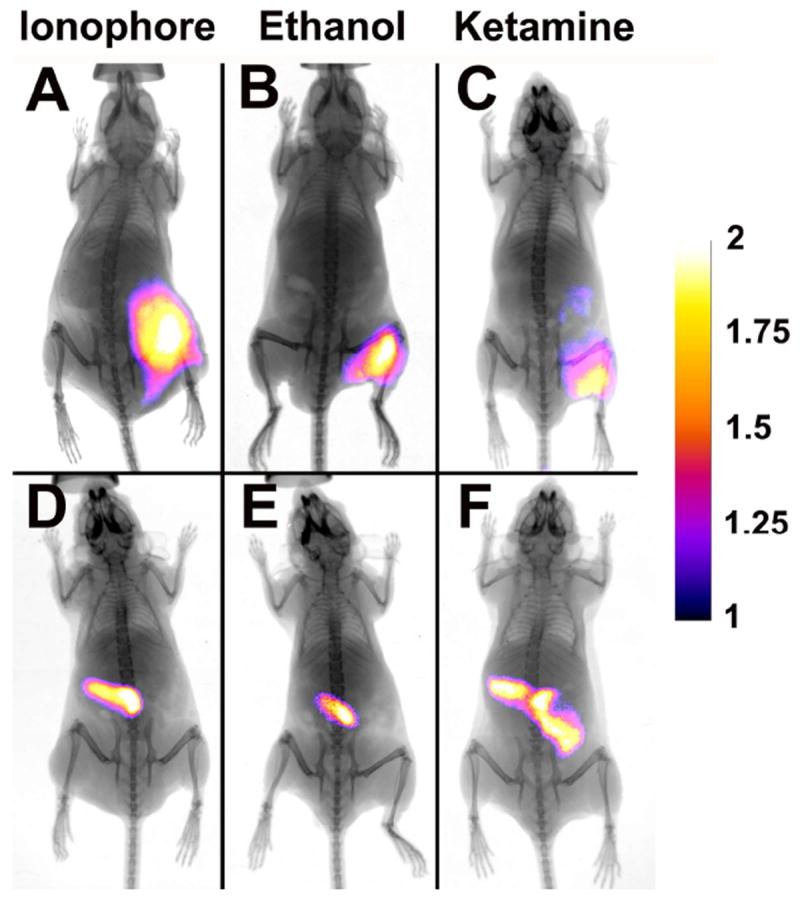
X-ray and fluorescence overlay images of mice treated with either synthetic ionophore 1, ethanol, or ketamine and dosed with probe 2 (A-C) or control 3 (D-F). Images were acquired 24 h post-injection of the probes. The calibration bar shows the fold increase in fluorescence counts from the minimum fluorescence counts. See Fig. S9 for raw data.
Histological analysis of the cytotoxin-treated tissues was performed to confirm molecular targeting of probe 2 to dead and dying cells. The tissues were flash frozen in OCT, and subjected to cryosectioning and microscopic imaging with and without H & E staining. The leg muscle injected with ionophore 1 was clearly damaged as judged by the degradation of cell structure (Fig 2A-C). NIR fluorescence microscopy of the same cells showed probe 2 localization in the periphery of the damaged cells. This result was expected given the probe’s affinity for the anionic PS exposed in these membranes.29 Probe 2 showed very little uptake in sections from healthy, control tissue (Fig. 2D-F). Similar histology and fluorescence microscopy data were obtained for tissue sections taken from the ethanol and ketamine injected cohorts (Fig. S21).
Figure 2.
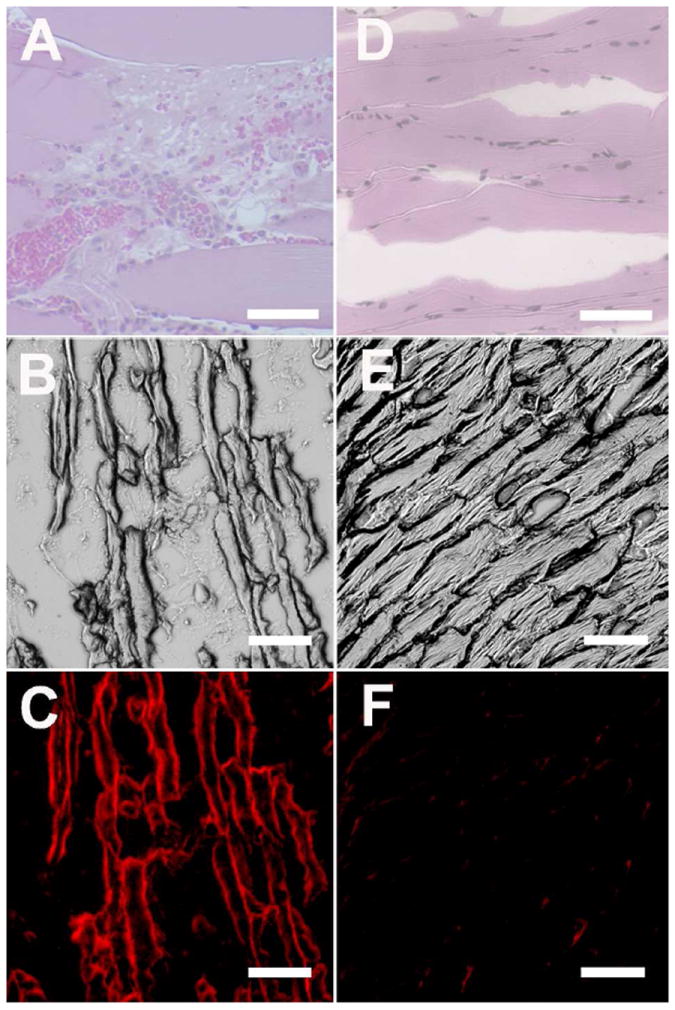
Representative histological sections from damaged leg muscle due to injection of ionophore 1 (A-C) or undamaged leg muscle that was only injected with saline (D-F). The micrographs were subjected either to H&E staining (A, D) or left unstained. Unstained micrographs were viewed using the brightfield (B, E) and NIR (C, F) filter sets. Scale bar = 200 μm for panels A and D. Scale bar = 50 μm for panels B, C, E, F.
As a second comparison, we conducted an imaging study using Annexin-Vivo 750, a new, commercially available NIR fluorescent conjugate of Annexin V that can be monitored using the same NIR fluorescence filter set as above.30 Two cohorts of four mice were treated with either ionophore 1 or ethanol to induce tissue damage. Subsequently, the mice were dosed with the Annexin-Vivo 750 and imaged periodically over 48 hours. A comparison of the time course images for probe 2 and Annexin-Vivo 750 (Figure 3) shows that probe 2 clears more rapidly from the bloodstream and through the liver, where the major clearance pathway for the Annexin-Vivo 750 is through the kidneys and bladder. Although the vendor for Annexin-Vivo 750 recommends imaging 2-4 hours after intravenous dosing, the images in Figure 3 show that it took more than 12 hours for the signal at the site of tissue damage to be clearly delineated.
Figure 3.
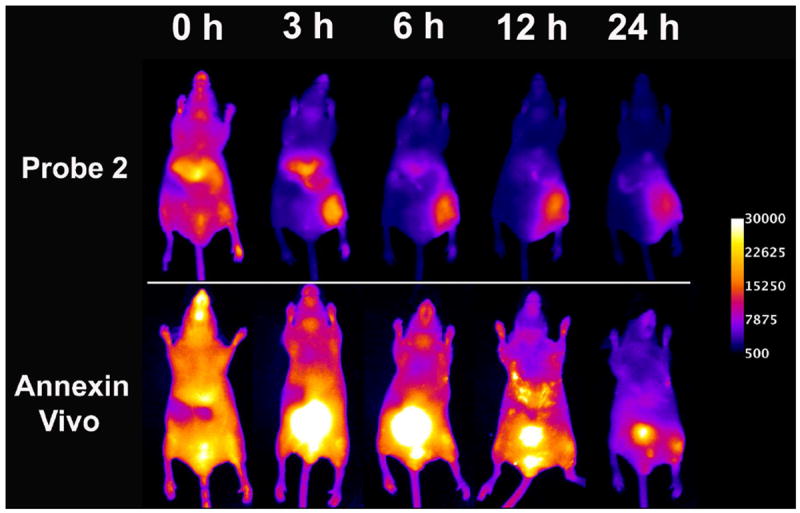
Representative near-infrared fluorescence images of a mouse treated with ionophore 1 in the hind leg and injected with either probe 2 (top row) or Annexin-Vivo 750 (bottom row) via the tail vein. Both cohorts of mice were injected with ionophore 1 in the right hind leg muscle and saline in the left hind leg muscle. The mice were dosed with either probe 2 or Annexin-Vivo 750 two hours post-treatment. Images were acquired at the indicated time points after probe injection. Calibration bar applies to all images.
A quantitative, in vivo image analysis was performed on each cohort of living mice. In each case, a region of interest (ROI) was drawn around the target (T) site of damaged tissue in the leg that received the cytotoxin and also around a non-target (NT) site of equivalent size on the opposite leg of the mouse that received the saline injection. Each ROI provided a mean pixel intensity, which was used to calculate an average T/NT ratio for each cohort. Since all three probes have essentially the same photophysical properties, and thus the same amount of signal attenuation with tissue depth, the T/NT ratios can be treated as quantitative measures of probe uptake at the tissue damage site. The T/NT data from all cohorts are displayed graphically in Figure 4 to represent the changes in signal contrast occurring with time. Animals injected with probe 2 showed significantly higher T/NT ratios than either control 3 or Annexin-Vivo 750. By the 24 h time point, probe 2 yielded T/NT values of 5.97 ± 0.42 for tissue damage caused by ionophore 1, 4.15 ± 0.25 with ethanol, and 2.83 ± 0.09 with ketamine. As expected, control 3 showed very little uptake at the site of tissue damage. In the case of Annexin-Vivo 750, the T/NT ratios were relatively low due to slow clearance of background signal from the non-target site and steadily increased over time to reach values of 2.5 after 48 hours.
Figure 4.
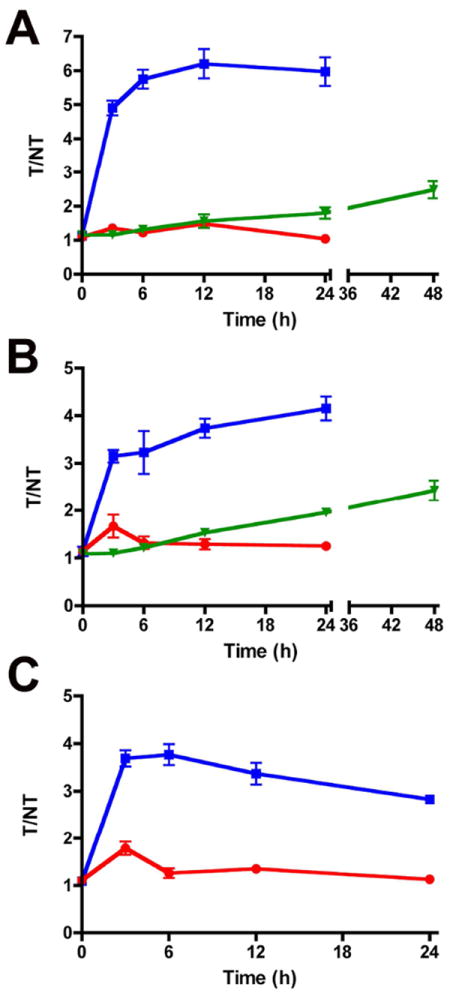
T/NT ratios of probe 2 (■), control 3 (●), and Annexin-Vivo 750 (▼) in ionophore (A), ethanol (B), and ketamine (C) treated mice. T/NT ratios were calculated at each time point for each cohort tested. Error bars represent the standard error of the mean. Data values are presented in Table S1. N =4, except n = 3 for probe 2 in B. P < 0.006 for probe 2 vs. control 3 in A. P < 0.01 for probe 2 vs. control 3 in B and C.
The in vivo imaging results were confirmed by performing quantitative image analyses on the excised organs. After the final time point, the animals from each cohort were anesthetized and euthanized by cervical dislocation. The internal organs and tissues were removed and imaged using the fluorescence scanner and filter set described above. ROI analysis of the images provided mean pixel intensities. Figure 5 shows a graph of mean pixel intensities for a select group of muscle and tissue samples from mice that were treated with ionophore 1 (see Supporting Information for other tissues). The highest staining of damaged muscle tissue was obtained with probe 2, and as expected, the same trend was observed with the animal groups that were treated with ethanol and ketamine (Fig. S19). There was also significant staining of the skin that covered the site of tissue damage indicating local, limited diffusion of the cytotoxic chemical from the injection site. As expected for the other two probes, there was minimal tissue uptake of the control fluorophore 3, but there was clear evidence that Annexin-Vivo 750 selectively targeted the damaged muscle and skin (Figs S14-S18).
Figure 5.
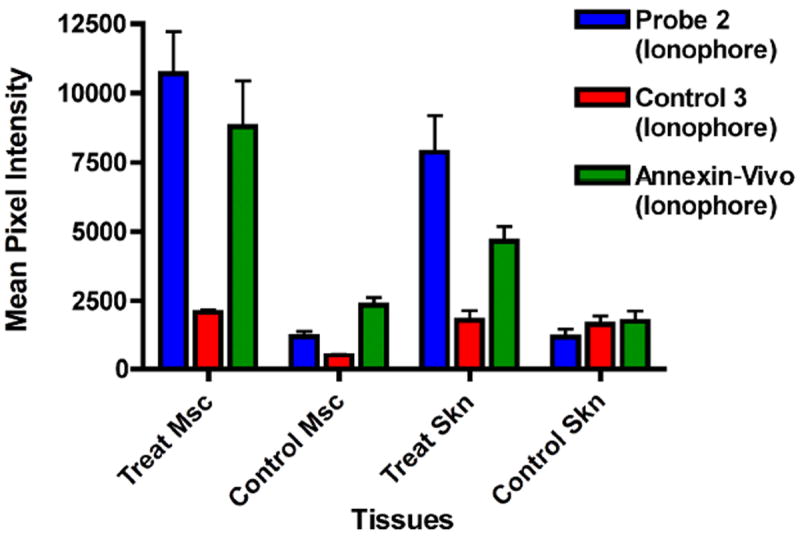
Bar graph showing ex vivo muscle and skin tissue distribution of probe 2, control 3, and Annexin-Vivo 750 in ionophore treated mice. Tissues are abbreviated as the following: Msc (muscle) and Skn (skin). Error bars represent the standard error of the mean. N = 4. The full ex vivo biodistribtuion can be obtained in the Supplementary Information
DISCUSSION
The goal of this study was to evaluate the ability of fluorescent NIR Zn2+-DPA probe 2 to image cell and tissue death in a controlled pre-clinical animal model. This was achieved by comparing the performance of probe 2, control fluorophore 3, and the commercially available Annexin-Vivo 750 to target a mouse model of acute tissue damage. Acute and localized tissue damage was achieved by injecting a dose of one of three chemicals that cause cell death - ionophore 1, ethanol, or ketamine - into the rear leg muscle of anesthetized mice. Although this tissue death model has limited clinical relevance, it acts as a highly reproducible, in vivo experimental system for quantitative comparison of fluorescence imaging probes. Cell death occurs very quickly at the site of injection. The rear leg muscle is a relatively shallow anatomical location that allows ready acquisition of target fluorescence signals that are distant from nontarget background signals emanating from the major internal organs.
Taken together, the in vivo images in Figure 1, the ex vivo data given in Figure 5, and the histological results presented in Figure 2 demonstrate that intravenous dosing of probe 2 leads to rapid and selective accumulation at the site of tissue damage. Further, the NIR fluorescent probe 2 targets the peripheral membranes of the dead and dying cells. In contrast, the control fluorophore 3 is not taken up by the damaged tissue. On the basis of previous mechanistic studies, we attribute the cell selectivity to the ability of the Zn2+-DPA targeting unit in probe 2 to associate selectively with the anionic PS that is exposed on the cell surface during the cell death process.25,26,29 We also compared the in vivo targeting performance of probe 2 to the commercially available protein probe, Annexin-Vivo 750, which also associates with dead and dying cells that expose PS. The in vivo images in Figure 3 show that the two probes are cleared from the blood stream by different pathways. Probe 2 is rapidly cleared through the liver, whereas the Annexin V probe and/or metabolic products are cleared more slowly through the kidney and bladder. The in vivo time course data shown in Figure 4 indicate that probe 2 achieves a much higher T/NT ratio than the Annexin V probe with all three cytotoxin treatments. However, a major cause of the low T/NT values observed for the Annexin V probe is the high background NT signal due to accumulation of the fluorescent probe in the bladder. Indeed, the ex vivo data in Figure 5 show that the Annexin V probe exhibits good selectivity for damaged tissue (target) over healthy tissue (non-target), albeit not as high as that of probe 2. The clearance of Annexin-Vivo 750 through the kidney and bladder agrees with the extensive literature on radiolabeled versions, and correlates with the high water solubility of the native protein and peptidic metabolic products. In contrast, probe 2 associates with serum proteins in the same way as the clinically approved dye indocyanine green (ICG) and this promotes uptake of the probe by the reticuloendothelial system.29 The fact that probe 2 clears primarily through the liver/intestines and the Annexin Vivo-750 through the kidney/bladder suggests that they could become a complementary pair of optical probes for imaging cell death in the lower and upper regions of the abdomen, respectively.
The size and molecular weight difference between probe 2 and the Annexin probe is probably why probe 2 exhibits faster exchange with the site of tissue damage and why there is a higher accumulated signal intensity. Probe 2 is about 30 times smaller than Annexin V (MW ~36 kDa), thus diffusion of probe 2 between the blood pool and the site of leg muscle damage is expected to be faster. It is known that each Annexin V protein covers approximately 50 phospholipid molecules on the membrane surface.41 It is possible that, at target site saturation, the smaller probe 2 can produce a higher loading of fluorophores per membrane surface area. There also may be a size-dependent difference in the ability of the probes to permeate into the cytosol of dying cells. It is estimated that early apoptotic monocytes have approximately 109 available binding sites for Annexin V, and after these cells become necrotic, the number of binding sites increases 2.5 fold.16 It is possible that the smaller probe 2 may diffuse through the plasma membranes of early/middle stage apoptotic cells that are comparatively impermeable to Annexin V and thus gain access to a higher number of anionic binding sites. Finally, the two probes may have different effects on the ability of the innate immune system to clear probelabeled dead and dying cells. For example, it is known that Annexin V inhibits phagocytosis,42 by promoting internalization of crucial membrane proteins.43 Slow clearance of Annexin-bound apoptotic cells may explain why the site of tissue damage still shows residual Annexin V signal at 48 hours after intravenous injection (Figures 3 and 4).
A final point worth noting is that the evidence obtained from the imaging results suggest that high local doses of ketamine causes substantial in vivo cell toxicity. This fact has been reported before38 and the toxicity mechanism has been discussed.39 In our hands, the toxicity effect was quite strong, which suggests that researchers who are developing in vivo animal models for cell death imaging should use caution when using ketamine as the anesthetic.
CONCLUSIONS
The fluorescent NIR Zn2+-DPA probe 2 allows imaging of mouse leg tissue damage induced by three different chemical cytotoxins. Histological evaluation confirmed localization of probe 2 in the peripheral membranes of damaged muscle cells. The importance of the Zn2+-DPA unit as a targeting group for exposed PS on the surface of the dead and dying cells was indicated by the lack of measurable uptake with control fluorophore 3. Compared to the commercially available Annexin-Vivo 750, probe 2 produces a higher T/NT ratio and faster kinetics, in part because there was a high bladder background signal with the Annexin V probe. The different clearance pathways for probe 2 (liver/intestines) and Annexin-Vivo 750 (kidney/bladder) suggests that they could have value as a complementary pair of fluorescent probes for imaging cell death in different anatomical locations. The rapid clearance exhibited by probe 2 indicates that zinc(II) coordination compounds may be suitable for development as radiolabeled imaging probes with short half-lives. Future studies will assess the ability of probe 2 to image cell death in animal models of greater clinical relevance.
METHODS
Reagents
Ionophore 1 was prepared as previously reported in detail.44 Probe 2 and control 3 were prepared as previously reported in detail.45 Annexin-Vivo 750 was purchased from VisEn Medical (Bedford, MA).
Animal Models and Protocol
All animal procedures were approved by the University of Notre Dame Animal Study Committee. Athymic nude mice (strain nu/nu, Taconic Inc., New York) were anesthetized (1.5% isoflurane inhalation) and injected intramuscularly in the rear leg muscle with 50 μL of either ionophore 1 (0.5 mg in 50 μL ethanol), ethanol (100 %, 50 μL), or ketamine (5.0 mg in 50 μL water). The same location on the opposite leg was injected with 50 μL of saline, which served as a vehicle control. Two hours after treatment, each mouse was intravenously injected via the tail vein with either probe 2 (1 mM in 100 μL 1% DMSO:water) or control 3 (1 mM in 100 μL water), or Annexin-Vivo 750 in accordance with manufacturer protocol.
Whole Animal Multimodal Imaging
Athymic nude mice were anesthetized (1.5% isoflurane inhalation) and placed inside a Carestream Health In Vivo Multispectral Imaging Station FX (Carestream Health; Rochester, NY) configured for epi-illumination. The animals were irradiated with filtered light of wavelength 750 ± 10 nm, and an image of emission intensity at 830 ± 20 nm was collected by a CCD camera during a 30 s acquisition period (bin = 2 × 2, f-stop = 2.51, field of view = 120 mm). Mice were imaged before and immediately after injection of probe 2 or control 3, and at 3, 6, 12 and 24 h time points. Following the 24 h time point, an x-ray image was acquired for each mouse (f-stop = 2.86, filter = 0.4 mm, field of view = 120 mm, bin = 0, image acquisition time = 180 second).
Ex Vivo Biodistribution
After the 24 h time point, the animals were euthanized by cervical dislocation under anesthesia. The selected tissues were excised, placed on a transparent imaging tray, and imaged using the 750 ± 10 nm excitation filter and 830 ± 20 nm emission filter (30 s time acquisition, bin = 2 × 2, f-stop = 2.51, field of view = 120 mm). The excised organs were not examined for signs of chemical induced toxicity.
Image Analysis and Presentation
First, all images were exported as 16-bit tiff files (no scaling) using Carestream Health MI software. Images were then processed using the free ImageJ 1.40g software program available for download at the NIH website at http://rsb.info.nih.gov/ij/. The 16-bit tiff images (presented as panels in each figure) were sequentially opened and then converted to an image stack using the “images to stack” software command. Next, the stack of images was background subtracted using the rolling ball algorithm (radius = 1000 pixels) that is included in the software. The image stack was set to the “Fire” fluorescence intensity scale (under “Lookup Tables” menu), which color codes the fluorescence counts contained in each pixel. After that, the stack of images was converted to a montage using the “stack to montage” command. At this point, region of interest (ROI) analysis was performed by selecting a circle ROI from the ImageJ tool bar, and drawing it to circumscribe the appropriate anatomical location of each mouse. The mean pixel intensity of the target (T) and non-target (NT) was measure by ImageJ and recorded for each mouse. The T/NT ratios were then calculated, and statistical analysis was performed to acquire the average of each ratio (n=4) with the standard error of the mean (SEM). The resulting ROI values were plotted using Graphpad Prism 4. After ROI analysis, a calibration bar was added to the montage using the “calibration bar” command, and the resulting image saved as a RGB “.tiff” file. For ex vivo biodistribution images, a ROI was manually drawn to outline each tissue and the mean pixel intensity was recorded.
Histology
Following humane euthanasia of mice, samples of skeletal muscle from injection sites were harvested, fixed for 24 h in 10% neutral buffered formalin, and placed in 70% ethanol before embedding in paraffin. The tissues were then sectioned at 4 μm, stained with hematoxylin and eosin and examined by light microscopy for histological changes. Unstained sections were imaged using a Nikon Eclipse TE-2000U epifluorescence microscope (Nikon Corporation, Tokyo, Japan) equipped with the appropriate Cy7 filter (ex: 710/75, em: 810/90). Images were captured using Metamorph software (Universal) and analyzed using ImageJ 1.40g.
Statistical Analysis
All values are depicted as mean ± standard error of the mean (SEM). Statistical analysis was performed using a Student’s t-test.
Supplementary Material
Acknowledgments
This work was supported by the Notre Dame Integrated Imaging Facility, NIH grants R01 GM059078 (B.D.S.), T32GM075762 (B.A.S.), P50 CA94056 (D.P.-W.) R01 GM36262 (G.W.G.), and Carestream Health Inc. (W.M.L.).
Footnotes
SUPPORTING INFORMATION AVAILABLE
All imaging data. The information is available free of charge via the Internet at http://pubs.acs.org
References
- 1.Broughton BR, Reutens DC, Sobey CG. Apoptotic mechanisms after cerebral ischemia. Stroke. 2009;40:e331–339. doi: 10.1161/STROKEAHA.108.531632. [DOI] [PubMed] [Google Scholar]
- 2.Mahli H, Gores GJ. Cellular and molecular mechanisms of liver injury. Gastroenterology. 2008;134:1641–1654. doi: 10.1053/j.gastro.2008.03.002. [DOI] [PMC free article] [PubMed] [Google Scholar]
- 3.Dalakas MC. Toxic and drug-induced myopathies. J Neurol Neurosur Ps. 2009;80:832–838. doi: 10.1136/jnnp.2008.168294. [DOI] [PubMed] [Google Scholar]
- 4.Tashiykov V, Katz Y, Volkov A, Gazit V, Schreiber S, Zohar O, Pick CG. Minimal traumatic brain injury induce apoptotic cell death in mice. J Mol Neurosci. 2009;37:16–24. doi: 10.1007/s12031-008-9094-2. [DOI] [PubMed] [Google Scholar]
- 5.Whelan RS, Kaplinskiy V, Kitsis RN. Cell death in the pathogenesis of heart disease: mechanisms and significance. Annu Rev Physiol. 2010;72:19–44. doi: 10.1146/annurev.physiol.010908.163111. [DOI] [PMC free article] [PubMed] [Google Scholar]
- 6.(a) Bader M. Rat models of cardiovascular diseases. Methods Mol Biol. 2010;597:403–414. doi: 10.1007/978-1-60327-389-3_27. [DOI] [PubMed] [Google Scholar]; (b) Watchko JF, Day TLO, Hoffman EP. Functional characteristics of dystrophic skeletal muscle: insights from animal models. J Appl Physiol. 2002;93:407–417. doi: 10.1152/japplphysiol.01242.2001. [DOI] [PubMed] [Google Scholar]; (c) Olah L, Wecker S, Hoehn M. Secondary deterioration of apparent diffusion coefficient after 1-hour transient focal cerebral ischemia in rats. J Cereb Blood Flow Metab. 2000;20:1474–82. doi: 10.1097/00004647-200010000-00009. [DOI] [PubMed] [Google Scholar]
- 7.Kartachova MD, Verheij M, Hoefnagel CA, van Eck BL, Olmos RA. Methodological aspects and applications of in vivo imaging of apoptosis in oncology: an illustrative review. V. Curr Med Imaging Rev. 2005;1:221–228. [Google Scholar]
- 8.Van Engeland M, Nieland LJW, Ramaekers FCS, Schutte B, Reutelingsperger C. Annexin V-affinity assay: a review of an apoptosis detection system based on PS exposure. Cytometry. 1998;31:1–9. doi: 10.1002/(sici)1097-0320(19980101)31:1<1::aid-cyto1>3.0.co;2-r. [DOI] [PubMed] [Google Scholar]
- 9.Leading references include: Blankenberg FG. In vivo imaging of apoptosis. Cancer Biol Ther. 2008;7:1–8. doi: 10.4161/cbt.7.10.6934.. Cohen A, Shirvan A, Levin G, Grimberg H, Reshef A, Ziv I. From the Gla domain to a novel small-molecule detector of apoptosis. Cell Res. 2009;19:625–637. doi: 10.1038/cr.2009.17.. De Saint-Hubert M, Prinsen K, Mortelmans L, Verbruggen A, Mottaghy FM. Molecular imaging of cell death. Methods. 2009;48:178–187. doi: 10.1016/j.ymeth.2009.03.022.. Zhao M, Li Z, Bugenhagen S. 99mTclabeled duramycin as a novel phosphatidylethanolamine-binding molecular probe. J Nucl Med. 2008;49:1345–1352. doi: 10.2967/jnumed.107.048603.. Shynkar VV, Klymchenko AS, Kunzelmann C, Duportail G, Muller CD, Demchenko AP, Freyssinet JM, Mely Y. Fluorescent biomembrane probe for ratiometric detection of apoptosis. J Am Chem Soc. 2007;129:2187–2193. doi: 10.1021/ja068008h.. Kettunen MI, Brindle KM. Apoptosis detection using magnetic resonance imaging and spectroscopy. Prog Nucl Mag Res Spect. 2005;47:175–187.
- 10.(a) Barnett EM, Zhang X, Maxwell D, Chang Q, Piwnica-Worms D. Single-cell imaging of retinal ganglion cell apoptosis with a cell-penetrating, activatable peptide probe in an in vivo glaucoma model. Proc Natl Acad Sci USA. 2009;106:9391–9396. doi: 10.1073/pnas.0812884106. [DOI] [PMC free article] [PubMed] [Google Scholar]; (b) Edgington LE, Berger AB, Blum G, Albrow VE, Paulick MG, Lineberry N, Bogyo M. Noninvasive optical imaging of apoptosis by caspase-targeted activity based probes. Nat Med. 2009;15:967–973. doi: 10.1038/nm.1938. [DOI] [PMC free article] [PubMed] [Google Scholar]
- 11.Gammon ST, Villalobos VM, Prior JL, Sharma V, Piwnica-Worms D. Quantitative analysis of permeation peptide complexes labeled with Technetium-99m: chiral and sequencespecific effects on net cell uptake. Bioconjugate Chem. 2003;14:368–76. doi: 10.1021/bc0256291. [DOI] [PubMed] [Google Scholar]
- 12.Trabulo S, Cardoso AL, Mano M, Pedroso de Lima MC. Cell-penetrating peptides—Mechanisms of cellular uptake and generation of delivery systems. Pharmaceuticals. 2010;3:961–993. doi: 10.3390/ph3040961. [DOI] [PMC free article] [PubMed] [Google Scholar]
- 13.(a) Dillon SR, Constantinescu A, Schissel MS. Annexin V binds to positively selected B cells. J Immunol. 2001;166:58–71. doi: 10.4049/jimmunol.166.1.58. [DOI] [PubMed] [Google Scholar]; (b) Elliot JI, Surprenant A, Marelli-Berg FM, Cooper JC, Cassady-Cain RL, Wooding C, Linton K, Alexander DR, Higgins CF. Membrane phosphatidylserine distribution as a non-apoptotic signaling mechanism in lymphocytes. Nat Cell Biol. 2005;8:808–816. doi: 10.1038/ncb1279. [DOI] [PubMed] [Google Scholar]
- 14.Fadeel B, Xue D. The ins and outs of phospholipid asymmetry in the plasma membrane: roles in health and disease. Crit Rev Biochem Mol Biol. 2009;44:264–277. doi: 10.1080/10409230903193307. [DOI] [PMC free article] [PubMed] [Google Scholar]
- 15.(a) Okada H, Mak TW. Pathways of apoptotic and non-apoptotic death in tumor cells. Nat Rev Cancer. 2004;4:592–603. doi: 10.1038/nrc1412. [DOI] [PubMed] [Google Scholar]; (b) Marx J. Autophagy: is it cancer’s friend or foe? Science. 2006;312:1160–1161. doi: 10.1126/science.312.5777.1160. [DOI] [PubMed] [Google Scholar]; (c) Degeterev A, Yuan J. Expansion and evolution of cell death programmes. Nat Rev Mol Cell Biol. 2008;9:378–390. doi: 10.1038/nrm2393. [DOI] [PubMed] [Google Scholar]
- 16.Appelt U, Sheriff A, Gaipl US, Kalden JR, Voll RE, Herrmann M. Viable, apoptotic, and necrotic monocytes expose phosphatidylserine: cooperative binding of the ligand annexin V to dying but not viable cells and implication for PS-dependent clearance. Cell Death Differ. 2005;12:194–196. doi: 10.1038/sj.cdd.4401527. [DOI] [PubMed] [Google Scholar]
- 17.Boersma HH, Kietselaer BL, Stolk LM, Bennaghmouch A, Hofstra L, Narula J, Heidendal GA, Reutelingsperger C. Past, present, and future of Annexin A5: From protein discovery to clinical applications. J Nuc Med. 2005;46:2035–2050. [PubMed] [Google Scholar]
- 18.(a) Smith G, Nguyen Q-D, Aboagye EO. Translational imaging of apoptosis. Anti-Cancer Agent Med Chem. 2009;9:958–967. doi: 10.2174/187152009789377709. [DOI] [PubMed] [Google Scholar]; (b) Zhao M. In vivo apoptosis imaging agents and strategies. Anti-Cancer Agent Med Chem. 2009;9:1018–1023. doi: 10.2174/187152009789377691. [DOI] [PubMed] [Google Scholar]; (c) Faust A, Herman S, Wagner S, Haufe G, Schober O, Schäers M, Kopka K. Molecular imaging of apoptosis in vivo with scintigraphic and optical biomarkers – a status report. Anti-Cancer Agent Med Chem. 2009;9:968–985. doi: 10.2174/187152009789377754. [DOI] [PubMed] [Google Scholar]
- 19.(a) Vanderheyden JL, Liu GZ, He J, Patel B, Tait JF, Hnatowich DJ. Evaluation of Tc-99m-MAG(3)-annexin V: influence of the chelate on in vitro and in vivo properties in mice. Nuc Med Biol. 2006;33:135–144. doi: 10.1016/j.nucmedbio.2005.09.002. [DOI] [PubMed] [Google Scholar]; (b) Li X, Link JM, Stekhova S, Yagle KJ, Smith C, Krohn KA, Tait JF. Site-Specific Labeling of Annexin V with F-18 for Apoptosis Imaging. Bioconjugate Chem. 2008;19:1684–1688. doi: 10.1021/bc800164d. [DOI] [PMC free article] [PubMed] [Google Scholar]
- 20.Ke S, Wen XX, Wu QP, Wallace S, Charnsangavej C, Stachowiak AM, Stephens CL, Abbruzzese JL, Podoloff DA, Li C. Imaging taxane-inducing tumor apoptosis using PEGylated, In-111-labeled annexin V. J Nuc Med. 2004;45:108–115. [PubMed] [Google Scholar]
- 21.Frey B, Schildkopf P, Röel F, Weiss E-M, Munoz LE, Herrmann M, Fietkau1 R, Gaipl US. AnnexinA5 renders dead tumor cells immunogenic—implications for multimodal cancer therapies. J Immunotox. 2009;6:209–216. doi: 10.3109/15476910903204058. [DOI] [PubMed] [Google Scholar]
- 22.Lambert TN, Smith BD. Synthetic receptors for phospholipid headgroups. Coord Chem Rev. 2003;240:129–141. [Google Scholar]
- 23.Alam IS, Neves AA, Whitney TH, Boren J, Brindle KM. Comparison of the C2A domain of synaptotagmin-I and annexin-V as probes for detecting cell death. Bioconjugate Chem. 2010;21:884–891. doi: 10.1021/bc9004415. [DOI] [PubMed] [Google Scholar]
- 24.(a) Laumonier C, Segers J, Laurent S, Michel A, Coppée F, Belayew A, Vander Elst L, Muller RN. A new peptidic vector for molecular imaging of apoptosis identified by phage display technology. J Biomol Screen. 2006;11:537–545. doi: 10.1177/1087057106288220. [DOI] [PubMed] [Google Scholar]; (b) Burtea C, Laurent S, Lancelot E, Ballet S, Murariu O, Port M, Vander Elst L, Corot C, Muller RN. Peptide targeting of phosphatidylserine for the MRI detection of apoptosis in atherosclerotic plaques. Mol Pharmaceut. 2009;6:1903–1919. doi: 10.1021/mp900106m. [DOI] [PubMed] [Google Scholar]; (c) Shao R, Xiong C, Wen W, Gelovani JG, Li C. Targeting phosphatidylserine on apoptotic cells with phages and peptides selected from a bacteriophage display library. Mol Imaging. 2007;6:417–416. [PubMed] [Google Scholar]; (d) Thapa N, Kim S, So I, Lee BH, Kwon IC, Choi K, Kim IS. Discovery of a phosphatidyserine-recognizing peptide and its utility in molecular imaging of tumour apoptosis. J Cell Mol Med. 2008;12:1649–1660. doi: 10.1111/j.1582-4934.2008.00305.x. [DOI] [PMC free article] [PubMed] [Google Scholar]
- 25.O’Neil EJ, Smith BD. Anion recognition using dimetallic coordination complexes. Coord Chem Rev. 2006;250:3068–3080. [Google Scholar]
- 26.Hanshaw RG, Lakshmi C, Lambert TN, Smith BD. Fluorescent detection of apoptotic cells using a family of zinc coordination complexes with a selective affinity for membrane surfaces that are enriched with phosphatidylserine. ChemBioChem. 2005;12:2214–2220. doi: 10.1002/cbic.200500149. [DOI] [PubMed] [Google Scholar]
- 27.Adams KE, Ke S, Kwon S, Liang F, Fan Z, Lu Y, Hirschi K, Mawad ME, Barry MA, Sevick-Muraca EM. Comparison of visible and near-infrared wavelength-excitable fluorescent dyes for molecular imaging of cancer. J Biomed Opt. 2007;12:024017. doi: 10.1117/1.2717137. [DOI] [PubMed] [Google Scholar]
- 28.Probe 2 is commercially available from Molecular Targeting Technologies Inc. under the name PSVue-794.
- 29.Smith BA, Akers WJ, Leevy WM, Lampkins AJ, Xiao S, Wolter W, Suckow MA, Achilefu S, Smith BD. Optical imaging of mammary and prostate tumors using a near infrared zinc(II)-dipicolylamine probe for anionic cell surfaces. J Am Chem Soc. 2010;132:67–69. doi: 10.1021/ja908467y. [DOI] [PMC free article] [PubMed] [Google Scholar]
- 30.Annexin Vivo 750 is commercially available from VisEn Medical.
- 31.Gokel GW, Daschbach MM. Coordination and transport of alkali metal cations through phospholipid bilayer membranes by hydraphile channels. Coord Chem Rev. 2008;252:886–902. doi: 10.1016/j.ccr.2007.07.026. [DOI] [PMC free article] [PubMed] [Google Scholar]
- 32.Leevy WM, Weber ME, Schlesinger PH, Gokel GW. NMR and ion selective electrode studies of hydraphile channels correlate with biological activity in E. coli and B subtilis. Chem Commun. 2005;1:89–91. doi: 10.1039/b413588a. [DOI] [PMC free article] [PubMed] [Google Scholar]
- 33.Leevy WM, Gammon ST, Levchenko T, Daranciang DD, Murillo O, Torchilin V, Piwnica-Worms D, Huettner JE, Gokel GW. Structure–activity relationships, kinetics, selectivity, and mechanistic studies of synthetic hydraphile channels in bacterial and mammalian cells. Org Biomol Chem. 2005;3:3544–3550. doi: 10.1039/b508157b. [DOI] [PMC free article] [PubMed] [Google Scholar]
- 34.Murillo O, Suzuki I, Abel E, Murray CL, Meadows ES, Jin T, Gokel GW. Synthetic transmembrane channels: functional characterization using solubility calculations, transport studies, and substituent effects. J Am Chem Soc. 1997;119:5540–5549. [Google Scholar]
- 35.Koda M, Murawaki Y, Mitsuda A, Ohyama K, Horie Y, Suou T, Kawasaki H, Ikawa S. Predictive factors for intrahepatic recurrence after percutaneous ethanol injection therapy for small hepatocellular carcinoma. Cancer. 2000;88:529–537. [PubMed] [Google Scholar]
- 36.Van de Putte M, Wang H, Chen F, de Witte PA, Ni Y. Hypericin as a marker for determination of tissue viability after intratumoral ethanol injection in a murine liver tumor model. Acad Radiol. 2008;15:107–113. doi: 10.1016/j.acra.2007.08.008. [DOI] [PubMed] [Google Scholar]
- 37.Prinsen K, Li J, Vanbilloen H, Vermaelen P, Devos E, Mortelmans L, Bormans G, Ni Y, Verbruggen A. Development and evaluation of a 68Ga Labeled pamoic acid derivative for in vivo visualization of necrosis using positron emission tomography. Bioorg Med Chem. 2010;18:5274–5281. doi: 10.1016/j.bmc.2010.05.050. [DOI] [PubMed] [Google Scholar]
- 38.Davy CW, Trennery PN, Edmunds JG, Altman JF, Eichler DA. Local myotoxicity of ketamine hydrochloride in the marmoset. Lab Anim. 1987;21:60–67. doi: 10.1258/002367787780740725. [DOI] [PubMed] [Google Scholar]
- 39.Zhang X, Paule MG, Newport GD, Zou Z, Sadavova N, Berridge MS, Apana SM, Hanig JP, Slikker W, Jr, Wang C. A minimally invasive, translational biomarker of ketamine-induces neuronal death in rats: microPET imaging Using 18F-Annexin V. Toxicol Sci. 2009;111:355–361. doi: 10.1093/toxsci/kfp167. [DOI] [PubMed] [Google Scholar]
- 40.Note: N=3 mice were used for the ethanol cohort injected with probe 2.
- 41.Tait JF, Gibson D. Phospholipid binding of annexin V: effects of calcium and membrane phosphatidylserine content. Arch Biochem Biophys. 1992;298:187–191. doi: 10.1016/0003-9861(92)90111-9. [DOI] [PubMed] [Google Scholar]
- 42.(a) Ravassa S, Bennaghmouch A, Kenis H, Lindhout T, Hackeng T, Narula J, Hofstra L, Reutelingsperger C. Annexin A5 down-regulates surface expression of tissue factor: a novel mechanism of regulating the membrane receptor repertoir. J Biol Chem. 2005;280:6028–6035. doi: 10.1074/jbc.M411710200. [DOI] [PubMed] [Google Scholar]; (b) Kenis B, van Genderen H, Deckers NM, Lux PAG, Hofstra L, Narula J, Reutelingsperger C. Annexin A5 inhibits engulfment through internalization of PS-expressing cell membrane patches. Exp Cell Res. 2006;312:719–726. doi: 10.1016/j.yexcr.2005.11.023. [DOI] [PubMed] [Google Scholar]
- 43.Kenis H, van Genderen H, Bennaghmouch A, Rinia H, Frederik P, Narula J, Hofstra L, Reutinglsperger C. Surface-expressed phosphatidylserine and annexin A5 open a novel portal of cell entry. J Biol Chem. 2004;279:52623–52629. doi: 10.1074/jbc.M409009200. [DOI] [PubMed] [Google Scholar]
- 44.Murillo O, Watanabe S, Nakano A, Gokel GW. Synthetic models for transmembrane channels: structural variations that alter cation flux. J Am Chem Soc. 1995;117:7665–7669. [Google Scholar]
- 45.Leevy WM, Gammon ST, Jiang H, Johnson JR, Maxwell DJ, Marquez M, Piwnica-Worms D, Smith BD. Optical imaging of bacterial infection in living mice using a fluorescent near-infrared molecular probe. J Am Chem Soc. 2006;128:16476–16477. doi: 10.1021/ja0665592. [DOI] [PMC free article] [PubMed] [Google Scholar]
Associated Data
This section collects any data citations, data availability statements, or supplementary materials included in this article.