

Abstract
Conducting pharmacokinetic (PK) studies in pregnant women is challenging. Therefore, we asked if a physiologically based pharmacokinetic (PBPK) model could be used to evaluate different dosing regimens for pregnant women. We refined and verified our previously published pregnancy PBPK model by incorporating cytochrome P450 CYP1A2 suppression (based on caffeine PK) and CYP2D6 induction (based on metoprolol PK) into the model. This model accounts for gestational age–dependent changes in maternal physiology and hepatic CYP3A activity. For verification, the disposition of CYP1A2–metabolized drug theophylline (THEO) and CYP2D6–metabolized drugs paroxetine (PAR), dextromethorphan (DEX), and clonidine (CLO) during pregnancy was predicted. Our PBPK model successfully predicted THEO disposition during the third trimester (T3). Predicted mean postpartum to third trimester (PP:T3) ratios of THEO area under the curve (AUC), maximum plasma concentration, and minimum plasma concentration were 0.76, 0.95, and 0.66 versus observed values 0.75, 0.89, and 0.72, respectively. The predicted mean PAR steady-state plasma concentration (Css) ratio (PP:T3) was 7.1 versus the observed value 3.7. Predicted mean DEX urinary ratio (UR) (PP:T3) was 2.9 versus the observed value 1.9. Predicted mean CLO AUC ratio (PP:T3) was 2.2 versus the observed value 1.7. Sensitivity analysis suggested that a 100% induction of CYP2D6 during T3 was required to recover the observed PP:T3 ratios of PAR Css, DEX UR, and CLO AUC. Based on these data, it is prudent to conclude that the magnitude of hepatic CYP2D6 induction during T3 ranges from 100 to 200%. Our PBPK model can predict the disposition of CYP1A2, 2D6, and 3A drugs during pregnancy.
Introduction
Pregnancy can affect the absorption (e.g., gastric pH, transporters), distribution (e.g., plasma protein binding and transporters), metabolism [e.g., cytochrome P450 (P450) metabolism], and excretion (e.g., renal secretion via transporters) (ADME) of drugs. Such changes can result in reduced efficacy (e.g., antiepileptics, antivirals) or increased toxicity of a drug. Considerable clinical data in the literature suggest that the magnitude of change in maternal hepatic enzyme activity, as reflected in the change in exposure to probe drugs, is P450 isoform–specific and gestational age–dependent (Hodge and Tracy, 2007). Many of these studies have used model (probe) drugs that report P450 enzyme activities to delineate the magnitude of change in the activity of major P450 enzymes, mostly during the third trimester (e.g., caffeine for CYP1A2, metoprolol for CYP2D6, midazolam for CYP3A, and phenytoin for CYP2C9) (Anderson, 2005).
Hepatic CYP1A2 enzyme activity, as measured by caffeine salivary clearance, is suppressed throughout pregnancy, with the greatest suppression of up to ∼65% observed in the third trimester (T3) versus postpartum (PP) (Tracy et al., 2005). Consistent with these data, the oral clearance (CLORAL) of another CYP1A2 probe substrate, theophylline (THEO), is reduced by ∼30% during T3 versus PP, but the CLORAL during the first (T1) and second (T2) trimesters is not affected (Gardner et al., 1987). In contrast, the activity of hepatic CYP2D6 appears to be increased during pregnancy. In pregnant women, the mean CLORAL of metoprolol (MET) (100 mg orally) during T3 was almost 4-fold of that during postpartum (Hogstedt et al., 1985). However, the i.v. clearance or the plasma protein binding of MET (10 mg) is not affected by pregnancy. Subsequently, two studies assessed CYP2D6 activity during pregnancy using the dextromethorphan/dextrorphan (DEX/DXO) metabolic ratio in pregnant women. The plasma DEX/DXO metabolic ratio (2 hours post dose, ∼Tmax) during T3 is significantly reduced (∼2.3-fold PP:T3) among extensive metabolizers (EMs), indicating increased CYP2D6 activity (Wadelius et al., 1997). Similarly, the 24-hour DEX urinary metabolic ratio (UR: DEX/DXO) was significantly reduced throughout pregnancy in subjects phenotyped as EMs, with the greatest reduction (∼1.9-fold PP:T3) observed during T3 (Tracy et al., 2005). In accordance with the increased CYP2D6 activity during pregnancy, paroxetine (PAR) plasma concentrations steadily decrease over the course of pregnancy in women genotyped as CYP2D6 EMs (Ververs et al., 2009). The most pronounced effect (73% reduction compared with postpartum) on PAR steady-state plasma concentrations is observed during T3. Finally, the CLORAL of clonidine (CLO) is 1.7-fold of that in nonpregnant subjects (Buchanan et al., 2009). This increase in CLO CLORAL is most likely due to increased CYP2D6 activity, as CYP2D6 plays a major role in in vitro CLO metabolism (Claessens et al., 2010), and the renal clearance (CLr) of clonidine appears not to be affected by pregnancy.
The above-described changes in P450 activities during pregnancy are postulated to reduce the efficacy or enhance the toxicity of drugs during pregnancy. Since it is logistically impossible to delineate the changes in the pharmacokinetics (PK) of all drugs administered to pregnant women, alternative approaches that can generalize across drugs and predict drug disposition in pregnancy are highly desirable. Physiologically based pharmacokinetic (PBPK) modeling has the advantage of incorporating both physiologic parameters that are important for ADME processes and drug-specific parameters (e.g., physicochemical and drug disposition characteristics) into a quantitative predictive model (Jamei et al., 2009; Rowland et al., 2011). A maternal PBPK model incorporating known physiologic parameters as well as maternal hepatic P450 activity in each trimester was recently developed (Abduljalil et al., 2012; Gaohua et al., 2012; Lu et al., 2012). We refined this PBPK model and showed that the PBPK model populated with CYP3A activity change, based on CLORAL of midazolam, could accurately predict the T3 disposition of other CYP3A–metabolized drugs, nifedipine and indinavir (Ke et al., 2012). A sensitivity analysis suggested that CYP3A induction in T3 is most likely hepatic and not intestinal. In the current study, we expanded and verified the established PBPK model by incorporating CYP1A2 suppression and CYP2D6 induction based on disposition of caffeine (Tracy et al., 2005) and metoprolol data (Hogstedt et al., 1985). The model was then used to predict the disposition during pregnancy of CYP1A2–metabolized drug THEO, and CYP2D6–metabolized drugs PAR, DEX, and CLO.
Materials and Methods
General Workflow of PBPK Model Development and Verification Criterion.
A general workflow of PBPK modeling and simulation of test compounds in nonpregnant subjects consisted of the following steps. First, mean plasma concentration-time profiles simulated using the Simcyp Population-based Simulator (version 11.1; Simcyp Limited, Sheffield, UK) were compared with those obtained from in vivo studies including i.v. dosing, single and multiple oral dosing. The 13-compartment full PBPK model was used. Second, the drug-specific parameters (e.g., fm) underwent refinement (hence referred to as the modified model) if the prediction in the first step deviates significantly (<0.8-fold or >1.25-fold) from that observed. Such refinements were often based on changes in mean area under the curve (AUC) and mean concentration-time profiles in the presence of inhibitors or genetic polymorphism of the enzymes clearing the drug. Third, the time-varying full PBPK model constructed in Matlab version 7.10 (2010; Mathworks, Natick, MA) was populated with these qualified drug-specific parameters and pregnancy-induced P450 activity changes (see the following sections).
Verification of the established PBPK model was primarily based on AUC (for DEX data, urinary data were used as AUC data were not available) because achieving equivalent drug exposure in pregnant and nonpregnant women was our primary focus. The term “verification” is used in place of “validation” to acknowledge the complexity of the PBPK model that requires more than plasma data to accomplish proper validation. As secondary criteria, prediction of maximum plasma concentration (Cmax) and minimum plasma concentration (Cmin) was considered, because achieving similar drug Cmax and Cmin may be important for some drugs where these measures are related to drug efficacy and/or toxicity. For model verification, 1) mean AUC, Cmax, and Cmin of THEO; 2) average steady-state concentration (Css) of PAR; 3) mean DEX/DXO UR; and 4) mean steady-state AUC of CLO during pregnancy were predicted and compared with published studies in pregnant, CYP2D6 EM subjects. We chose the criterion of PK bioequivalence as the criterion for successful verification of the model, namely, the predicted mean population PK parameters of the drug (as described earlier), should fall within 80–125% of the observed value, i.e., 0.80 ≤ predicted/observed ≤ 1.25.
General Pregnancy PBPK Model Structure and Key Assumptions.
The general pregnancy PBPK model structure and key assumptions were described in detail previously (Gaohua et al., 2012; Ke et al., 2012). Briefly, the gestational age–dependent changes in physiologic parameters (e.g., cardiac output, glomerular filtration rate, etc.) were incorporated into an existing PBPK scheme (Jamei et al., 2009). Maternal glomerular filtration rate (GFR) was assumed to increase during pregnancy by 19, 40, and 37% during T1, T2, and T3, respectively (Abduljalil et al., 2012). Renal secretion clearance mediated by organic cation transporter was assumed to increase by 50% during T3 (metformin CLsecretion) (Eyal et al., 2010). The fraction reabsorbed was assumed to remain constant through gestation. The change in drug unbound fraction in plasma (fu,p) during pregnancy, as a function of serum albumin or α1-acid glycoprotein concentrations, was accounted for in the model as described previously (Ke et al., 2012). The established PBPK model also assumed that hepatic CYP3A activity increased by 99% (measured by midazolam CLORAL) during T3 (Ke et al., 2012).
The PBPK model was further expanded to incorporate pregnancy-induced CYP1A2 suppression and CYP2D6 induction as described below. Maternal hepatic CYP1A2 was assumed to decrease during pregnancy by 33, 48, and 65% (salivary caffeine clearance) during the first (T1), second (T2), and third trimesters, respectively (Tracy et al., 2005). Maternal CYP2D6 activity was assumed to increase by 200% (reported by metoprolol CLORAL) during T3 (Hogstedt et al., 1985). This value of 200% was obtained through sensitivity analysis by varying CYP2D6 activity in the range of 50–350% induction to recover the observed metoprolol data. Reliable assessment of the magnitude of CYP2D6 induction in earlier trimesters has not been conducted. All other maternal hepatic P450 activities were assumed to remain constant throughout pregnancy. These changes were accomplished in Matlab v7.10.
THEO PBPK Model Construction.
THEO physiochemical and protein binding parameters [log Po:w (octanol–water partition coefficient), pKa, blood-to-plasma concentration ratio (B/P ratio)], absorption [fraction absorbed (Fa), intestinal bioavailability (Fg)], and distribution [tissue-to-plasma partition coefficient (Kp)] were obtained from Simcyp (version 11.1). Initial scaling of in vitro metabolic data to metabolic clearance (CLH) overpredicted THEO CLH observed in vivo. Therefore, unbound intrinsic clearance (CLint,u) was back-calculated from observed CLH using a well-stirred liver model. The contributions from individual CYPs to total metabolic clearance of THEO obtained in vitro were 91.7, 8, and 0.06% for 1A2, 2E1, and 3A, respectively (Tjia et al., 1996). However, in vivo drug-drug interation studies using diltiazem and verapamil as the perpetrator (both are mechanism-based inactivators of CYP3A) reported an AUC percent change of 12–18% (Sirmans et al., 1988; Stringer et al., 1992), suggesting that CYP3A plays a greater role in THEO metabolism in vivo. Therefore, the in vivo CYP1A2 contribution to total metabolic clearance was reduced to 80%, and in vivo CYP3A contribution was increased to 12%. The drug-dependent parameters of THEO are listed in Table 1.
TABLE 1.
Summary of THEO drug-dependent parameters
| Parameter | Value | Methods/Reference |
|---|---|---|
| Molecular weight | 180.2 | Librarya |
| Log Po:w | −0.02 | Library |
| pKa | 8.8,0.99 | Library |
| B/P ratio | 0.815 | Library |
| fu,p | 0.58 | b |
| Fa | 0.97 | Predicted c |
| ka (h−1) | 0.154(SR), 1.98(IR) | Predicted d |
| Fg | 1 | Predicted by Qgut e |
| Vss (l/kg) | 0.39 | Predicted f |
| CLIV (l/h) | 3.0 | g |
| CLr (l/h) | 0.45 | h |
| CLint,u (l/hr) | 4.6 | i |
| fm and fe (%) | J | |
| fm,1A2 | 68 | |
| fm,3A | 7 | |
| fm,2E1 | 10 | |
| fe | 15 |
Qgut, hybrid parameter of blood flow and drug permeability; Vss, volume of distribution at steady state.
Refers to Simcyp compound library (version 11.1).
Reported value is in the range of 0.56–0.60 (Hendeles et al., 1985; St-Pierre et al., 1985), and the mean value was used.
Predicted from Caco-2 permeability of 25*10−6 cm/s (library) in Simcyp (version 11.1).
IR (immediate release): predicted from Caco-2 permeability of 25*10−6 cm/s (library) in Simcyp (version 11.1). SR (sustained release): estimated from reported t1/2,a (absorption half-life) (Hendeles and Weinberger, 1983).
Qgut model is provided in the Simcyp simulator. It retains the form of the “well stirred” liver model, but the flow term (Qgut) is a hybrid of both permeability through the enterocyte membrane and villous blood flow (Yang et al., 2007).
Predicted according to Rodgers and Rowland (2007).
Reported CLIV in nonpregnant, nonsmokers is 3.0 ± 0.7 l/h (number of studies = 26) (University of Washington Drug Interaction Database, http://www.druginteractioninfo.org/).
Calculated by taking the product of CLIV and reported mean fe . Reported fe ranges 13–18% (n = 22) in nonpregnant, nonsmoking healthy volunteers (Tang-Liu et al., 1982; St-Pierre et al., 1985) and 16.0% ± 3.3% (n = 5) in postpartum women (Frederiksen et al., 1986) following i.v. dosing. Weighted mean fe was used.
Back calculation from well stirred liver model using QH,B (hepatic blood flow) of 90 l/h.
The contribution from individual CYP obtained in vitro is 91.7, 8, and 0.06% for 1A2, 2E1, and 3A, respectively (Tjia et al., 1996). However, in vivo drug-drug interaction studies using diltiazem and verapamil as the perpetrators (both are CYP3A mechanism-based inhibitors) reported an AUC percent change of 12–18% (Sirmans et al., 1988; Stringer et al., 1992), suggesting that CYP3A played a greater role in THEO metabolism in vivo. Therefore, the contribution from individual CYP (80, 8, and 12% for 1A2, 2E1, and 3A, respectively) was adjusted accordingly. In vivo fm for individual P450 was calculated by taking the product of fm (1 − fe) and the contribution from individual P450.
MET PBPK Model Construction.
MET is mainly eliminated via hepatic metabolism (∼84% by CYP2D6, ∼7% by CYP3A4), with a minor contribution from renal elimination (∼9%) (Brown et al., 2005; Ito et al., 2005). After administration of a single dose of 100 mg in healthy volunteers, there is a 4.5-fold difference in the AUC of poor metabolizers (PMs) and EMs of CYP2D6 (Hamelin et al., 2000; Sharma et al., 2005). MET physiochemical and protein binding parameters (log Po:w, pKa, B/P ratio, fu,p), absorption [Fa, Fg, first-order absorption rate constant (ka)], distribution (Kp), and elimination (Vmax, Km,unbound) were obtained from Simcyp (version 11.1). Initial scaling using in vitro Vmax determined in human liver microsomes significantly underpredicted CLIV in vivo i.v. clearance and CLORAL by a factor of 2.2 and 2.3 in nonpregnant, CYP2D6 EMs. This underprediction was also evident in nonpregnant, CYP2D6 PMs (by a factor of 3.2 and 1.4 for CLIV and CLORAL, respectively). To improve in vitro-in vivo extrapolation (IVIVE) prediction of CLH, in vivo Vmax for CYP2D6 and CYP3A4 was optimized by multiplying in vitro Vmax by a factor of 2 (Table 2). The optimized drug model showed AUC, Cmax, and Cmin values following 100-mg single oral dosing in nonpregnant, CYP2D6 EM and PM subjects that were comparable to reported literature values. DDI prediction for the victim-perpetrator pair MET (100 mg SD orally) and quinidine (100 mg daily for 6 days) was evaluated to qualify drug-specific parameters, specifically fm,2D6 (fraction of total body clearance via CYP2D6). The perpetrator drug model (quinidine, daily), readily available in Simcyp, was used in all simulations without modifications. The drug-dependent parameters of MET are listed in Table 2.
TABLE 2.
Summary of MET drug-dependent parameters
| Parameter | Value | Methods/Reference |
|---|---|---|
| Molecular weight | 267.4 | Library a |
| Log Po:w | 1.88 | Library |
| pKa | 9.75 | Library |
| B/P ratio | 1.15 | Library |
| fu,p | 0.88 | Library |
| Fa | 0.81 | Predicted b |
| ka (h−1) | 0.58 | Predicted b |
| Fg | 0.97 | Predicted by Qgut model |
| Vss (l/kg) | 3.1 | Predicted c |
| CL (l/h) | 55.8 | Predicted via IVIVEd |
| CLr (l/h) | 4.27 | e |
| Vmax (µl/min/mg) | Optimized f | |
| O-demethylation | ||
| Vmax,2D6 | 300 | |
| Vmax,3A4 | 1164 | |
| Alpha-OH | ||
| Vmax,2D6 | 75.9 | |
| Vmax,3A4 | 96 | |
| Km,unbound (µM) | Library | |
| O-demethylation | ||
| Km,2D6 | 28.3 | |
| Km,3A4 | 1162 | |
| Alpha-OH | ||
| Km,2D6 | 31 | |
| Km,3A4 | 874 | |
| fm and fe (2D6 EM) (%) | Predicted via IVIVE g | |
| fm,2D6 | 84 | |
| fm,3A | 7 | |
| fe | 9 |
Qgut, hybrid parameter of blood flow and drug permeability; Vss, volume of distribution at steady state.
Refers to Simcyp compound library (version 11.1).
Predicted from human jejunum permeability (10−4 cm/s) (library data) in Simcyp (version 11.1).
Not reported in the literature; predicted according to Rodgers and Rowland (2007).
In vitro to in vivo extrapolation using in vitro Vmax and Km and average population values for liver weight and microsomal protein of 1618 g and 38.9 mg/g (liver), respectively. Reported CLIV in nonpregnant, CYP2D6 EMs and PMs is 72.5 ± 32.2 l/h (range 48.6–93.2 l/h) (number of studies = 3, number of subjects = 28, male only) and 30.1 ± 8.4 l/h (number of studies = 1, number of subjects = 3, male only) (University of Washington Drug Interaction Database, http://www.druginteractioninfo.org/). Reported CLIV in postpartum women is 39 ± 4.8 l/h (n = 5) (Hogstedt et al., 1985).
Reported mean value in nonpregnant, CYP2D6 EMs and PMs is 4.27 l/h (range 3.24–6.0 l/h) (number of studies = 6, number of subjects = 67) (University of Washington Drug Interaction Database, http://www.druginteractioninfo.org/).
IVIVE (in vitro-in vivo extrapolation) approach using in vitro Vmax determined in human liver microsomes (provided in library) significantly underpredicted CLIV and CLORAL by a factor of 2.2 and 2.3 in nonpregnant, CYP2D6 EMs. This underprediction was also evident in nonpregnant, CYP2D6 PMs (by a factor of 3.2 and 1.4, respectively). To improve IVIVE prediction of CL, in vivo Vmax for CYP2D6 and 3A4 was optimized by multiplying in vitro Vmax by a factor of 2.
Literature fm,2D6 = 69.5–82.8% (Brown et al., 2005; Ito et al., 2005).
PAR PBPK Model Construction.
PAR is extensively metabolized in humans and exhibits nonlinear kinetics during single and multiple dosing (Kaye et al., 1989). After the administration of a single dose of PAR, there is a 7-fold difference in the median total clearance in PMs and EMs of CYP2D6, which is then reduced to 2-fold at steady state (Sindrup et al., 1992a, b). The nonlinear PK of PAR is much more pronounced in EMs than PMs, mainly due to time-dependent inhibition of the CYP2D6–mediated metabolism (Venkatakrishnan and Obach, 2005).
A previously published PAR PBPK model (Jornil et al., 2010) was modified as described later. Jornil et al. (2010) showed that, in addition to CYPs 2D6, 3A and 1A2 are involved in the metabolism of PAR. The authors then used prior in vitro and in vivo information on the metabolism of PAR to predict the exposure in EM and PM individuals receiving single and multiple dosing regimens using Simcyp. However, the IVIVE approach significantly underpredicted single-dose and steady-state median CLORAL for CYP2D6 PM subjects by a factor of 2.9 and 3.5, respectively (Jornil et al., 2010). It is worth noting that, even though PAR has been identified in vitro as a CYP3A mechanism-based inhibitor (Venkatakrishnan and Obach, 2005), the in vivo importance of CYP3A inactivation by PAR may be limited (Jornil et al., 2010). When such inactivation was considered, the predicted mean percentage of active CYP3A enzyme remaining at steady state was 97 and 93% in CYP2D6 EMs and PMs, respectively. In contrast, 34% of CYP2D6 activity was predicted to remain in EMs. Sensitivity analysis showed that varying the maximal inactivation rate constant (Kinact,3A) and inactivation constant (KI,unbound,3A) in the range of 0.1–10-fold of reported values had minimal impact (<10%) on AUC and Cmax of PAR in the PM population, in which CYP3A is expected to be the major elimination pathway of PAR. Based on these analyses, it has been speculated that there is a non–CYP3A, nonrenal pathway responsible for PAR elimination in CYP2D6 PMs. Therefore, we modified the PBPK model established by Jornil et al. (2010) by incorporating an unidentified pathway (CLint,other) (fm,other = 9.7% in CYP2D6 EMs) into the IVIVE model. The optimized drug model was verified by comparing the predicted mean AUC, Cmax, and Cmin following single or chronic oral dosing in nonpregnant, CYP2D6 EM and PM subjects to reported literature values. The drug-dependent parameters of PAR are listed in Table 3.
TABLE 3.
Summary of PAR drug-dependent parameters
| Parameter | Value | Methods/Reference |
|---|---|---|
| Molecular weight | 329.3 | Jornil et al., 2010 |
| Log Po:w | 3.55 | Martin et al., 2008 |
| pKa | 9.66 | Martin et al., 2008 |
| B/P ratio | 1.25 | Jornil et al., 2010 |
| fu,p | 0.05 | Kaye et al., 1989 |
| Fa | 0.94 | Predicteda |
| ka (h−1) | 1.14 | Predicteda |
| Fg | 0.92 | Predicted by Qgut model |
| Vss (l/kg) | 12.95 | Optimized b |
| CL2D6 EM (l/h) | 80.7 | Predictedc |
| CLr (l/h) | 0.5 | Sindrup et al., 1992a |
| Vmax (µl/min/pmol) | Jornil et al., 2010 | |
| Vmax,2D6 | 9,7 | |
| Vmax,3A4 | 5.3 | |
| Vmax,3A5 | 1.6 | |
| Vmax,1A2 | 0.63 | |
| Vmax,2C19 | 2.4 | |
| Km,unbound (µM) | Jornil et al., 2010 | |
| Km,2D6 | 0.03 | |
| Km,3A4 | 13.3 | |
| Km,3A5 | 108 | |
| Km,1A2 | 8.8 | |
| Km,2C9 | 26 | |
| CLint,other (µl/min/mg protein) | 55.2 | Optimizedd |
| Kinact (2D6) (min−1) | 0.17 | Bertelsen et al., 2003 |
| KI, unbound (2D6) (µM) | 0.315 | Bertelsen et al., 2003; Venkatakrishnan and Obach, 2005 |
| Kinact (3A4) (min−1) | 0.011 | Obach et al., 2007 |
| KI, unbound (3A4) (µM) | 4.03 | Obach et al., 2007 |
| fm at steady state (2D6 EM) (%) | Predicted via IVIVE e | |
| fm,2D6 | 79.9 | |
| fm,3A | 9.6 | |
| fm,other | 9.7 |
Qgut, hybrid parameter of blood flow and drug permeability; Vss, volume of distribution at steady state.
Predicted from Caco-2 permeability of 17*10−6 cm/s (Jornil et al., 2010) in Simcyp (version 11.1).
Vss was not reported in the literature. The predicted Vss according to Rodgers and Rowland (2007) is 7.5 l/kg. This value was further optimized to 12.95 l/kg by applying a global Kp scalar of 1.7, to improve prediction of Cmax. Reported Vd following i.v. infusion is 17.2 ± 9.9 l/kg (range 8.0–28.0) (Kaye et al., 1989).
Simcyp-predicted CL in CYP2D6 EM individuals via IVIVE is 80.7 ± 13.8 l/h (n = 100). Reported CL is 74.9 ± 14 l/h (range 63–91.7, n = 4) following 23–28 mg i.v. over 30 minutes (Kaye et al., 1989). The genotype of these subjects was not determined.
In CYP2D6 PM subjects, both single-dose and steady-state median CLoral were significantly underpredicted by a factor of 2.9 and 3.5, respectively, using the IVIVE approach (Jornil et al., 2010). To match single-dose and steady-state CLoral in P450 2D6 PMs, an un-identified pathway (CLint,other) was incorporated into the IVIVE model.
fm is dose- and time-dependent. Following 20 mg single-dose (n = 100 subjects), the predicted time-averaged mean fm is 94.3% (2D6), 2.8% (3A4), 0.1% (1A2), 0.1% (2C19), and 2.7% (unidentified CL), respectively, in EMs. Following 20 mg daily (n = 100 subjects), the predicted time-averaged mean fm at steady-state is 80% (2D6), 9.6% (3A4), 0.5% (1A2), 0.2% (2C19), and 9.7% (unidentified CL), respectively, in EMs. In CYP2D6 PMs, the predicted time-averaged mean fm is similar following 20 mg single-dose versus 20 mg daily: 48.5% (3A4), 2.6% (1A2), 1.1% (2C19), and 47.5% (unidentified CL) versus 46.9% (3A4), 2.7% (1A2), 1.1% (2C19), and 49.0% (unidentified CL).
DEX and DXO PBPK Model Construction.
The DEX/DXO metabolic ratio, such as plasma concentration of the parent/metabolite or UR, is commonly used in drug-drug interaction and pharmacogenetic studies as an in vivo measure of P450 2D6 activity (Borges et al., 2005; Lutz and Isoherranen, 2012). DEX is extensively O-demethylated to dextrorphan by CYP2D6. The formation of DXO by CYP2D6 is responsible for approximately 97% of the oral clearance of DEX in EMs (Capon et al., 1996; Gorski et al., 2004). Dextrorphan then undergoes glucuronidation mostly by UGT2B7 (Lutz and Isoherranen, 2012). N-demethylation to 3-methoxymorphinan also occurs, largely by CYP3A4 (Yu and Haining, 2001). Both dextrorphan and 3-methoxymorphinan are further metabolized to 3-hydroxy-morphinan by CYP3A4 and 2D6, respectively (Yu and Haining, 2001; Lutz and Isoherranen, 2012).
DEX physiochemical and protein binding parameters (log Po:w, pKa, B/P ratio, fu,p), absorption (Fa, Fg), distribution (Kp), and hepatic elimination (CYP3A–mediated unbound intrinsic clearance, or CLint,h,u,3A) were from the Simcyp compound library (version 11.1). CLint,u,2D6 was estimated in Simcyp by simultaneously fitting observed plasma concentration-time profiles extracted from previous publications (Abdul Manap et al., 1999; Moghadamnia et al., 2003) (see Table 4). Optimization of CLint,u,2D6 was necessary to match predicted bioavailability (Fa*Fh*Fg ∼7%) to that reported (<5%) (Capon et al., 1996). CLr of DEX was assumed to approximate fu,p *GFR (see footnote to Table 4). The optimized drug model was verified by comparing predicted mean AUC, Cmax, and Cmin values following single oral dosing, or in the presence of quinidine, in nonpregnant CYP2D6 EM and PM subjects to reported literature values.
TABLE 4.
Summary of DEX and DXO drug-dependent parameters
| Parameter | DEX Value | Methods/Reference | DXO Value | Methods/Reference |
|---|---|---|---|---|
| Molecular weight | 271.4 | Library a | 257.4 | b |
| Log Po:w | 3.8 | Library | 3.46 | b |
| pKa | 8.3 | Library | 9.2 | c |
| B/P ratio | 1.32 | Library | 1 | Assumed |
| fu,p | 0.5 | Library | 0.55 | d |
| Fa | 1.0 | Library | _ | _ |
| ka (h−1) | 0.3 | Library | _ | _ |
| Fg | 0.80 | Predicted by Qgut model | 1.0 | Predicted by Qgut model |
| Vss (l/kg) | 14.45 | Predicted e | 6.78 | f |
| CL (l/h) | 103.2 | Predicted | 12.5 | Apparent CL, calculatedg |
| CLr (l/h) | 3.6 | Assumed ∼ fu,p *GFR h | 5 | Apparent CL, optimized i |
| CLint,u (µl/min/mg) | Parameter estimation j | CLint,u,3A = 0.95 | k | |
| CLint,u,2D6 | 760.6 | |||
| CLint,u,3A | 4.3 | |||
| Biliary CL int,u (µl/min/10^6) | _ | _ | 0.9 | l |
| fm and fe (2D6 EM) (%) | m | _ | _ | |
| fm,2D6 | 95.3 | |||
| fm,3A | 0.86 | |||
| fe | 3.8 |
Qgut, hybrid parameter of blood flow and drug permeability; Vss, volume of distribution at steady state.
Refers to Simcyp compound library (version 10).
Royal Society of Chemistry, ChemSpider, http://www.chemspider.com/.
Reported in Kanaan et al. (2008).
Reported in Lutz and Isoherranen (2012).
Not reported in the literature; predicted according to Rodgers and Rowland (2007).
Calculated mean value of reported Vd in the literature: range of 300–650 l or 4.3–9.3 l/kg (assumed body weight = 70 kg) (Albers et al., 1995).
Calculated mean DXO CLapp (dose*fm,2D6 /AUCDXO) was 12.5 l/h. Dose and AUCDXO (free + conjugated drug) were taken from Capon et al. (1996), Abdul Manap et al. (1999), and Gorski et al. (2004).
Reported medians and ranges for CLr of DEX: 9.0 l/h (1.4–37 l/h) for extensive metabolizers (Capon et al., 1996). Model-estimated CLr were 6.5 l/h (Abduljalil et al., 2010) and 3 l/h (Moghadamnia et al., 2003). Given the substantial variability in literature values, CLr of DEX was assumed to approximate fu,p *GFR.
Calculated CLr = Ae,DXO /AUCDXO was in the range of 5–12 l/h. Ae,DXO (free + conjugated drug) was calculated by dose * percentage urinary recovery (reported range 40–91%), and AUCDXO (free + conjugated drug) was taken from Capon et al. (1996); Abdul Manap et al. (1999); and Gorski et al. (2004). A sensitivity analysis on apparent CLr of DXO in the range of 5–12 l/h was conducted, and the final value (5 l/h) was selected based on predicted Ae,DXO,0-24h being the closest match to observed Ae,DXO in the literature (Abduljalil et al., 2010) (Fig. 5A). This CLr corresponds to a urinary recovery of 40%. A higher percentage urinary recovery overpredicted Ae,DXO.
CLint,u,2D6 was estimated in Simcyp by simultaneously fitting observed plasma concentration-time profiles extracted from Abdul Manap et al. (1999) and Moghadamnia et al. (2003) using an initial estimate of 253.0 (µl/min/mg) provided in a compound library. CLint,u,3A was provided in a compound library.
Taken from Lutz and Isoherranen (2012).
Back calculation from biliary CL (CLapp - CLm,3A - CLr) and average population values for liver weight and hepatocellularity of 1618 g and 117.5 (millions of cells/g liver), respectively.
Reported fm,2D6 = 97% (Capon et al., 1996; Gorski et al., 2004).
Then, to predict the cumulative amount of DXO in urine, we constructed a semi-PBPK model with the following assumptions and/or simplifications: 1) the metabolite distributed homogeneously into nonmetabolic tissues/organs, and that these tissues can be combined into an apparent plasma compartment; 2) the metabolite formed in the gut and liver was available for further metabolism by CYP3A; and 3) glucuronidation of DXO was not incorporated due to lack of appropriate scaling factors for UGT enzymes in hepatic and extrahepatic tissues, therefore quantitative prediction of plasma concentration-time profiles of free or total DXO was not possible. DXO physiochemical and protein binding parameters (log Po:w, pKa, fu,p) and elimination (CYP3A–mediated unbound intrinsic clearance, or CLint,h,u,3A) were obtained from the literature (Table 4). Apparent CLr (5 l/h) of DXO was determined through sensitivity analysis by comparing simulated Ae,DXO,0-24h (the cumulative amount of drug excreted into the urine during 0-24 hour interval) values to those reported (Jones et al., 1996; Abduljalil et al., 2010) (see footnotes to Table 4). Given the wide range of reported DXO recovery in urine [fe (fraction of total body clearance via renal excretion) = 40–91%], in addition to apparent CLr of DXO and CYP3A–mediated clearance, biliary excretion of DXO conjugates was incorporated into the DXO model (see footnote to Table 4). The combination that best recovered the observed Ae,DXO was used in the final model. In addition, the DXO PBPK model accounted for pregnancy-induced changes including a decrease in plasma protein binding of DXO, an increase in apparent renal clearance of DXO, and an increase in CYP3A–mediated clearance of DXO. The drug-dependent parameters of DEX and DXO are listed in Table 4.
CLO PBPK Model Construction.
CLO has dose-proportional kinetics following i.v. administration and single or multiple dosing in the clinical dose range (Arndts et al., 1983). In nonpregnant subjects, approximately 41–62% of orally administered CLO is cleared unchanged by the kidney (Frisk-Holmberg et al., 1981; Arndts et al., 1983), with the remainder undergoing hepatic metabolism to produce inactive metabolites, mainly 4-hydroxyclonidine. Selective inhibition studies in human liver microsomes have shown that CYP2D6 plays a major role in clonidine metabolism, followed by CYP3A and 1A2 (Claessens et al., 2010).
Physiochemical and protein binding parameters (log Po:w, pKa, fu,p), absorption (Fa,), distribution (Kp), and elimination (CLIV, CLr, fe) were obtained from the literature. B/P ratio and Fg were predicted in Simcyp (version 11.1). The contribution from individual P450 to the metabolic clearance (67, 22, and 11% for CYP2D6, 3A, and 1A2, respectively) was obtained in human liver microsomes (Claessens et al., 2010). Then, CLint,h,u for CYP2D6, 3A, and 1A2 were back-calculated from hepatic CL (CL-CLr), fm for individual P450, and “average” population values for liver weight and hepatic P450 enzyme abundance for CYP3A, 1A2, and 2D6, respectively. The drug-dependent parameters of CLO are listed in Table 5.
TABLE 5.
Summary of clonidine drug-dependent parameters
| Parameter | Value | Methods/Reference |
|---|---|---|
| Molecular weight | 230.1 | a |
| Log Po:w | 1.57 | b |
| pKa | 8.05 | c |
| B/P ratio | 1.012 | d |
| fu,p | 0.48 | e |
| Fa | 0.98 | Calculated f |
| ka (h−1) | 1.0 | Optimized in the range of 1.0–2.3 g |
| Fg | 0.99 | Predicted by Qgut |
| Vss (l/kg) | 2.55 | Predicted h |
| CLIV (l/h) | 13.6 | i |
| CLr (l/h) | 7.0 | j |
| CLint,u (µl/min/pmol of isoform) | k | |
| CLint,u,2D6 | 0.32 | |
| CLint,u,3A | 0.006 | |
| CLint,u,1A2 | 0.008 | |
| fm and fe (2D6 EM) (%) | e, l | |
| fm,2D6 | 33 | |
| fm,3A | 11 | |
| fm,1A2 | 5 | |
| fe | 51 |
Qgut, hybrid parameter of blood flow and drug permeability; Vss, volume of distribution at steady state.
Reported in Ghasemi and Saaidpour (2007).
Reported in Cody and DeTitta (1979).
Predicted using physicochemical parameters in Simcyp. Reported B/P ratio in rodents is 1.07 (Yamahata et al., 1996).
Reported in Vanholder et al. (1988) and Boehringer Ingelheim (2011).
Mean reported bioavailability is 92% (range 88–96%) following a single oral dose of clonidine (Frisk-Holmberg et al., 1981; Arndts et al., 1983). Simcyp-predicted Fh is 0.95 and Fg is 0.99, therefore calculated Fa is 0.98.
Reported in Frisk-Holmberg et al. (1981); Anavekar et al. (1982); and Porchet et al. (1992).
Predicted according to Rodgers and Rowland (2007); estimated Vss value from i.v. dosing profiles is ∼3 l/kg (Frisk-Holmberg et al., 1981). Mean Kp values determined in rodents (Conway and Jarrott, 1980; Yamahata et al., 1996) were used, as opposed to predicted Kp values, because these values were found to better characterize the biphasic distribution of clonidine in plasma following either i.v. or oral dosing.
Mean of reported values (Frisk-Holmberg et al., 1981; Arndts et al., 1983).
Calculated by taking the product of CLIV and reported mean fe (Frisk-Holmberg et al., 1981; Arndts et al., 1983; Buchanan et al., 2009).
Back calculation from hepatic CL (CL - CLr), fm for individual P450 (see next footnote), and average population values for liver weight and hepatic P450 enzyme abundance of 137, 52, and 8 pmol/mg protein for CYP3A, 1A2, and 2D6, respectively.
Reported fm for individual P450 was calculated by taking the product of fm (i.e., 1 - fe) and the contribution from individual CYPs (67, 22, and 11% for 2D6, 3A, and 1A2, respectively) obtained in human liver microsomes (Claessens et al., 2010).
Results
Prediction of THEO PK in Pregnancy Using PBPK Model Incorporating CYP1A2 Suppression Based on Caffeine Data
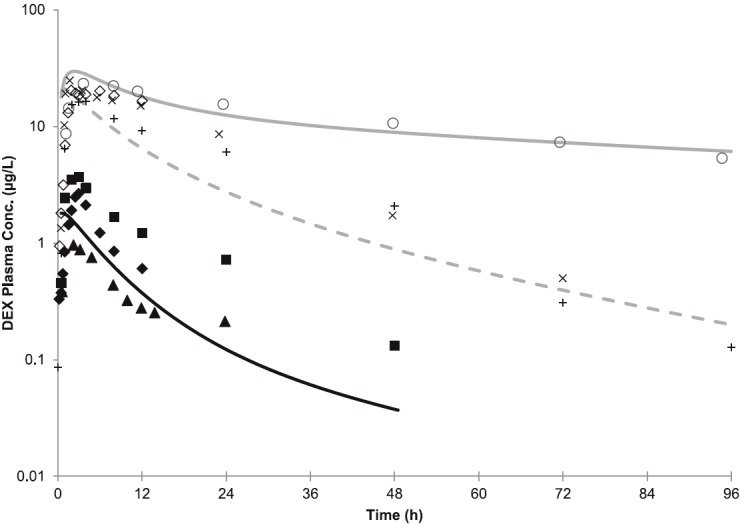
The disposition of THEO following multiple PO doses during T3 and PP was predicted (Gardner et al., 1987). Briefly, the disposition of THEO was assessed in 10 pregnant, nonsmoking asthmatic women who had been continuously maintained on sustained-release theophylline. Twenty-four hours preceding the study, all subjects were switched to immediate-release theophylline tablets, and the last dose was given before midnight of the study day. After overnight fasting, a single oral dose of theophylline (Somophyllin liquid, 259 mg) was administered. Compared with PP (range of 14–58 weeks PP), THEO CLORAL during T1 (13–19 weeks) and T2 (23–28 weeks) was not significantly altered. THEO CLORAL during T3 (range of 34–39 weeks) was reduced and remained suppressed during the immediate PP period (9–13 weeks PP) (Gardner et al., 1987). Hence, systemic exposures of THEO obtained during 14–58 weeks PP were considered to represent baseline levels, and those obtained during the immediate PP period (9–13 weeks PP) were excluded. The predicted mean THEO AUC ratio (AUCR) (PP:T3), Cmax ratio (PP:T3), and Cmin ratio (PP:T3) were 0.76, 0.95, and 0.66, compared with the observed values of 0.75, 0.89, and 0.72, respectively (Fig. 1; Supplemental Table 1). All predictions met the verification criterion (i.e., the predicted/observed of mean AUC, Cmax, and Cmin were in the range of 0.9–1.1). Predicted mean THEO AUCRs for PP:T1 and PP:T2 were 0.79 and 0.77, compared with observed values of 0.99 and 0.95, respectively (Supplemental Table 1). THEO plasma unbound fraction was predicted to be modestly increased from 58% during postpartum to 66% in T3, consistent with observed values (59% PP versus 68% T3). THEO CLr was predicted to be increased from 0.45 l/h during postpartum to 0.68 l/h in T3, a 52% increase that is comparable to the observed 48% reported by Frederiksen et al. (1986).
Fig. 1.

Predicted and observed plasma concentration-time profiles of THEO following multiple oral doses during T3 and PP. The solid line represents the predicted mean postpartum profile. The dashed line represents the predicted mean T3 profile. Mean observed data are overlaid (●, postpartum profile; ○, T3 profile) (Gardner et al., 1987). Error bars represent standard deviations. Conc., concentration.
Prediction of PK for CYP2D6 Substrates in Pregnancy
MET Prediction to Inform CYP2D6 Induction in Pregnancy.
The mean AUCs of MET (100 mg single oral dose) in nonpregnant, CYP2D6 EM and PM subjects, or in the presence of the inhibitor (quinidine) were quantitatively predicted by the modified (see Materials and Methods) MET model (i.e., predicted/observed in the range of 0.9–1.2) (Fig. 2; Supplemental Table 2). Specifically, the predicted AUC PM/EM ratio of 4.1 matched well with the observed ratio of 4.5 (Hamelin et al., 2000; Sharma et al., 2005). The predicted mean AUCI (the plasma AUC in the presence of an inhibitor)/AUC for victim-perpetrator pair MET (100 mg single oral dose) and quinidine (100 mg daily for 6 days) is 3.3-fold, compared with the observed AUCR of 3.2-fold (Johnson and Burlew, 1996). The corresponding predicted/observed of mean Cmax and Cmin were in the range of 0.7–0.9 and 1.3–1.4, respectively.
Fig. 2.

(A) Predicted and observed plasma concentration-time profiles of MET after administration of a single oral dose of 100 mg to nonpregnant, CYP2D6 EMs and PMs. The solid line represents the predicted mean profile in EMs. The dashed line represents the predicted mean profile in PMs. The mean observed data in nonpregnant EMs (● and ■) and PMs (▲ and ♦) (Hamelin et al., 2000; Sharma et al., 2005) are overlaid, as are the mean observed data in postpartum women (○) (Hogstedt et al., 1985). (B) Predicted and observed plasma concentration-time profiles of MET (100 mg orally) during T3 and PP. The solid line represents the predicted mean postpartum profile. The dashed line represents the predicted mean T3 profile. The mean observed data are overlaid (●, postpartum profile; ○, T3 profile) (Hogstedt et al., 1985). Error bars represent standard deviations. Conc., concentration.
MET exposure in pregnant women was assessed (Hogstedt et al., 1985), and the observed increase in CLORAL, during pregnancy, was used to deconvolute the magnitude of increase in CYP2D6 activity after accounting for other pregnancy-related components of MET CLORAL (CYP3A–mediated CL, CLr and protein binding). In this study, the disposition of MET following i.v. and oral dosing was studied in five women who developed hypertension during pregnancy and after delivery. The change in systemic clearance following i.v. dosing of MET (10 mg) during pregnancy versus postpartum was insignificant, although there was a trend toward higher CLIV during T3 (T3 versus PP: 82.8 ± 15.6 versus 39 ± 4.8 l/h; n = 5). The mean CLORAL following a single oral dose of 100 mg during pregnancy was almost quadrupled (range: 2–13-fold). Although the CYP2D6 genotype of the five study subjects was not determined, comparison of reported individual AUC values following oral dosing to literature values (Johnson and Burlew, 1996; Hamelin et al., 2000; Sharma et al., 2005) confirmed that the systemic exposures of all five subjects were comparable to those of EM subjects and were significantly lower than those of PM subjects (Hamelin et al., 2000; Sharma et al., 2005) (Fig. 2A). The PBPK model incorporating 200% induction of CYP2D6 during T3 predicted a mean AUCR (PP:T3) of 3.0, mean Cmax ratio (PP:T3) of 2.8, and mean Cmin ratio (PP:T3) of 3.5 compared with the observed ratios of 3.6 ± 2.3, 2.4 ± 1.3, and 2.0 ± 2.5, respectively (Fig. 2B). With the exception of the Cmin ratio, the model-predicted AUCR and Cmax ratio met the verification criterion (Supplemental Table 2). The predicted MET plasma unbound fraction was 88% during PP versus 90.7% in T3, consistent with the observed values (89% ± 11% PP versus 90.7% ± 17% T3).
PAR PK Prediction in Pregnancy.
We modified a previously published PAR PBPK model (see Materials and Methods) and predicted single-dose (SD; 30 mg) and steady-state (SS; 30 mg daily) PAR AUC in both EM and PM nonpregnant individuals. The mean AUC0-inf (plasma AUC extrapolated to infinity) or AUCss,0-tau [plasma AUC over the dosing interval (tau) at steady state] in nonpregnant, CYP2D6 EM and PM subjects was quantitatively predicted by the modified PAR model (i.e., predicted/observed in the range of 0.8–1.2) (Fig. 3A; Supplemental Table 3). The model-predicted mean SD and SS Cmax and Cmin in EMs met the verification criterion. In PMs, the predicted/observed values of mean SD and SS Cmax and Cmin were in the range of 1.0–1.3 (Supplemental Table 3). PAR exposure in pregnant women was predicted based on the study design described by Ververs et al. (2009). In this study, subjects were genotyped, and steady-state (Css,ave) PAR plasma concentrations were examined in each of the three trimesters but not postpartum. Women who were genotyped as EM showed steadily decreasing plasma paroxetine concentrations during the course of pregnancy. During T3, the median Css,ave plasma concentration declined to 5 ng/ml (range 0.6–19.6 ng/ml) following the daily dose of 19.9 ± 8.8 mg (range 3–40 mg), compared with the median Css,ave plasma concentration of 18.4 ng/ml (range 3.3–66 ng/ml) in historical controls receiving 20 mg daily (Sindrup et al., 1992a). These observations correspond to a median Css,ave ratio (PP:T3) of 3.7 (Fig. 3B). The PBPK model incorporating 200% induction of CYP2D6 during T3 predicted a mean PAR Css,ave ratio (PP:T3) of 7.1 following 20 mg daily (14 days). Sensitivity analysis suggested that a 100% induction of CYP2D6 during T3 was required to recover the observed change in PAR Css,ave ratio (PP:T3) (predicted value 4.1) (Fig. 3B; Supplemental Table 4). Furthermore, CYP2D6 activity was induced modestly by 10 and 25% in T1 and T2, respectively, to recover the observed changes in median PAR Css ratios PP:T1 and PP:T2 of 1.6 and 1.9, respectively (unpublished data).
Fig. 3.

(A) Predicted and observed plasma concentration-time profiles of PAR following single and chronic dosing of 30 mg (orally) to nonpregnant, CYP2D6 EMs and PMs. The mean observed data in nonpregnant EMs (○ and ●) and PMs (□ and ■) are overlaid (● and ■, SS; ○ and □, SD) (Sindrup et al., 1992b). (B) Predicted and observed steady-state (Css) PAR plasma concentrations following 20 mg daily during T3 and PP. The gray bars represent predicted Css and Css ratio (PP:T3) assuming 200% induction (Ind.) of CYP2D6, and the black bars represent predicted Css and Css ratio (PP:T3) assuming 100% induction of CYP2D6. The white bars represent observed median Css in nonpregnant historical controls (Sindrup et al., 1992b), in pregnant women during T3 (Ververs et al., 2009), and calculated Css ratio (PP:T3) based on observed median Css.
DEX PBPK Model Prediction.
The modified (see Materials and Methods) DEX model-predicted mean AUC in nonpregnant, CYP2D6 EM and PM subjects following the administration of a single oral dose of 30 mg DEX met the verification criterion (i.e., predicted/observed values within the range of 0.9–1.0) (Fig. 4; Supplemental Table 5). Specifically, the predicted AUC PM/EM ratio of 65.0 was comparable to the observed ratio of 73.5 (predicted/observed ratio of 0.9). In addition, the predicted mean AUCI/AUC for the victim-perpetrator pair DEX (30 mg single oral dose) and quinidine (50 mg single oral dose given 1 hour prior to the DEX dose) was 15.9-fold, compared with an observed mean AUCI/AUC of 20.8-fold (predicted/observed ratio of 0.8) (Capon et al., 1996; Abdul Manap et al., 1999). The model-predicted mean Cmax in the presence/absence of quinidine in nonpregnant, CYP2D6 EMs met the verification criterion (i.e., predicted/observed values within the range of 0.9–1.1) (Fig. 4; Supplemental Table 5). The mean Cmax in nonpregnant, CYP2D6 PMs was slightly overpredicted (predicted/observed of 1.3). The mean Cmin in the presence and absence of quinidine in nonpregnant, CYP2D6 EMs was underpredicted (predicted/observed of 0.2 and 0.5, respectively). However, model-predicted mean Cmin in nonpregnant, CYP2D6 PMs met the verification criterion (predicted/observed of 0.8). Furthermore, the predicted mean cumulative amount (0.06 mg) of DEX (30 mg orally) excreted in urine (Ae,0-24h) in EMs was also in reasonable agreement with the observed data: 0.075 ± 0.167 mg (Abduljalil et al., 2010) and 0.153 ± 0.155 mg (Jones et al., 1996) (Fig. 5A).
Fig. 4.
(A) Predicted and observed plasma concentration-time profiles of DEX after administration of a single oral dose of 30 mg to nonpregnant, CYP2D6 EMs and PMs, or in the presence of a strong CYP2D6 inhibitor quinidine (50 mg daily). The black and gray solid lines represent the predicted mean profile in EMs and in PMs, respectively. The dashed line represents the predicted mean profiles in EMs in the presence of quinidine. The mean observed data in nonpregnant EMs (■, Abdul Manap et al., 1999; ♦, Gorski et al., 2004; ▴, Abduljalil et al., 2010) and PMs (○, Capon et al., 1996; ◊, Gorski et al., 2004) are overlaid. The mean observed data (+, X) in nonpregnant EMs in the presence of quinidine are overlaid (+, Abdul Manap et al., 1999; X, Capon et al., 1996). Conc., concentration.
Fig. 5.
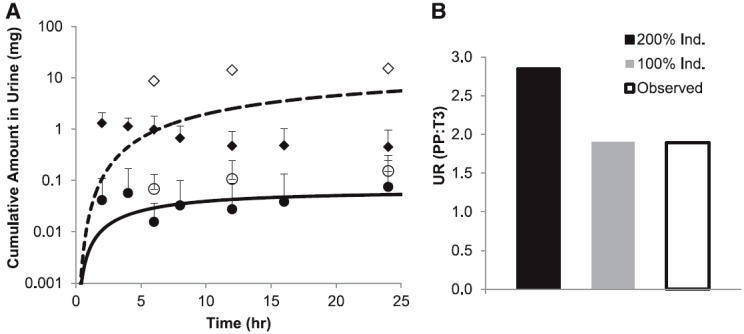
(A) Predicted mean time course of the amount (mg) of DEX (solid line) and DXO (dashed line) excreted in urine after administration of a single oral dose of 30 mg to nonpregnant, CYP2D6 EMs. Average observed DEX (○, Jones et al., 1996; ●, Abduljalil et al., 2010) and DXO (◊, Jones et al., 1996; ♦, Abduljalil et al., 2010) data in nonpregnant EMs are overlaid. Error bars represent standard deviations. (B) Predicted and observed UR (DEX/DXO) (PP:T3) following 30 mg (orally). The black bar represents predicted UR (PP:T3) assuming 200% induction of CYP2D6, and the gray bar represents predicted UR (PP:T3) assuming 100% induction of CYP2D6. The white bars represent observed UR (PP:T3) (Tracy et al., 2005).
Since plasma concentration-time data for DEX are not available in pregnant subjects, a semi-PBPK model to predict the cumulative amount of DXO excreted in urine was constructed (see Materials and Methods). The model-predicted Ae,0-24h of DXO in EMs, following the administration of a single oral dose of 30 mg, was within the range of the observed values (9.6 mg predicted versus 1.3–15.3 mg observed) (Jones et al., 1996; Abduljalil et al., 2010) (Fig. 5A). Further, the predicted PP UR0-24h (0-24 hour urinary ratio) (DEX/DXO) of 0.0065 in 2D6 EMs matched the reported median PP UR0-24h of 0.0063 [90% confidence interval (CI): 0.0037–0.027; n = 25) (Tracy et al., 2005) and the reported UR0-72h (mean: 0.0082; range: 0.0007–0.028) in nonpregnant, CYP2D6 EMs (n = 11) (Borges et al., 2005). The observed median T3 DEX UR0-24h was 0.0033 (90% CI: 0.0015–0.0086), compared with the median PP DEX UR0-24h of 0.0063 (90% CI: 0.0037–0.027). These observations correspond to a median DEX UR (PP:T3) of 1.9 ± 1.2. The PBPK model incorporating 200% induction of CYP2D6 during T3 predicted a mean DEX UR (PP:T3) of 2.9. Sensitivity analysis by varying CYP2D6 activity in the range of 50–250% suggested that a 100% induction of CYP2D6 during T3 was required to recover the observed change in DEX UR (predicted value 1.9) (Fig. 5B; Supplemental Table 6). The reported median DEX UR PP:T1 and PP:T2 is 1.6 and 1.9, respectively, suggesting the magnitudes of CYP2D6 induction during T1 and T2 are similar to that of T3.
CLO PBPK Model Prediction.
The constructed CLO PBPK model was first verified by comparing the predicted versus the observed disposition kinetics of an i.v. dose of 1.79–2.35 µg/kg to nonpregnant healthy volunteers (Frisk-Holmberg et al., 1981). The predicted/observed AUC0-inf was in the range of 1.1–1.2 (Supplemental Table 7). The predicted/observed Cmin, 24h (minimum plasma concentration sampled at 24 hours post-dose) was 0.4 (2.35 µg/kg) and 1.0 (1.79 g/kg). The PBPK model was also verified against the disposition kinetics following the administration of a single oral dose of 0.1–0.3 mg to nonpregnant healthy volunteers. Model-predicted AUC0-inf, Cmax, and Cmin, 24h all met the verification criterion (Fig. 6A; Supplemental Table 7). The PBPK model incorporating 200% induction of CYP2D6 during T3 predicted a mean AUCR (PP:T3) of 2.2 (observed value 1.7) (Buchanan et al., 2009). Sensitivity analysis suggested that a 100% induction of CYP2D6 during T3 better recovered the observed AUCR (PP:T3) (predicted value 1.8) (Fig. 6B; Supplemental Table 8). Because clonidine is a substrate of renal transporter organic cation transporter, the current PBPK model accounted for a pregnancy-induced increase in GFR and OCT-mediated secretion (measured by metformin CLsecretion) (Eyal et al., 2010; Higgins et al., 2012), and predicted that CLO CLr increased from 116.8 ml/min to 182.7 ml/min. If CLr was kept constant during T3, both 100 and 200% induction of CYP2D6 during T3 (1.48 and 1.84, respectively; Supplemental Table 8) could recover the observed AUCR (PP:T3) of 1.7.
Fig. 6.

(A) Observed (Obs.; symbols) and predicted (Pred.; lines) plasma concentration-time profiles of clonidine after administration of a single oral dose of 0.1, 0.2, and 0.3 mg to nonpregnant, CYP2D6 EMs. Gray filled circles: observed data (0.1 mg); open symbols: observed data (0.2 mg) (Porchet et al., 1992); black filled circles: observed data (0.3 mg) (Cunningham et al., 1994). (B) Observed and/or simulated and plasma concentration-time profiles of clonidine 0.15 mg (orally) during T3 and PP. The black solid line represents the predicted mean postpartum profile. The gray dashed line represents the predicted mean T3 profile assuming 200% induction (Ind.) of CYP2D6, and the black dashed line represents the predicted mean T3 profile assuming 100% induction of CYP2D6. Observed (dose normalized to 0.15 mg) mean T3 profile (symbols) is overlaid (Buchanan et al., 2009). Error bars represent standard deviations. Conc., concentration.
Discussion
The pregnancy PBPK model populated with CYP1A2 activity change based on caffeine salivary clearance quantitatively predicted THEO disposition during T3. The pregnancy effect on THEO is smaller than the decrease in CYP1A2 activity (reported by caffeine data), as THEO has significant renal clearance (15%) and minor CYP3A–mediated clearance (7%), both of which increase during T3, and counteracts the decrease in 1A2 activity. Based on the 1A2 decrease during T1 and T2 reported by the caffeine data, a modest increase (<23%) in THEO AUC during T1 and T2 was predicted. Such a modest decrease may not be detectable in the clinic or be clinically significant. Indeed, the observed data show a lack of pregnancy effect on THEO disposition during these periods. Additional pregnancy PK data on other 1A2 substrates are needed to confirm or refute whether the assumed 1A2 activity suppression based on caffeine data during T1 and T2 can recover the disposition of other 1A2 substrates (such as clozapine).
The increase in CYP2D6 activity during pregnancy is intriguing because 2D6 is not inducible by xenobiotics, and only hepatocyte nuclear factor-4α has been shown to have a role in regulating 2D6 transcription (Corchero et al., 2001). Given that MET has linear PK and is a well accepted 2D6 probe drug (fm,2D6 = 84%) with minor involvement from other clearance pathways (CYP3A–mediated CL and CLr), the pregnancy PBPK model was populated with 2D6 activity change based on CLORAL of MET. The lack of significant pregnancy-induced effect following i.v. dosing is not surprising. MET is an intermediate-to-high extraction ratio drug, and CLIV is reflective of both the magnitude of hepatic blood flow and 2D6-mediated intrinsic clearance. The lack of pregnancy-induced effect on CLIV suggests that hepatic blood flow does not increase significantly during T3. This is consistent with the conclusion drawn from a meta-analysis of literature data on the direct assessment of hepatic blood flow in pregnant women (Abduljalil et al., 2012).
Because in vitro PAR metabolic data did not recover observed metabolic clearance in nonpregnant EM and PM individuals, we modified a published PAR model by incorporating an unidentified pathway (CLint,other) into the IVIVE model. At steady state (20 mg daily), this CLint,other contributes <10% of PAR clearance in EMs and ∼50% in PMs (see Table 3). CLint,other was assumed not to be affected by pregnancy. Under this assumption, the magnitude of 2D6 induction would be slightly overestimated by assuming this CLint,other pathway is not induced. However, if the contrary is true and CLint,other is suppressed (more likely; see below), the impact of this minor pathway on estimating the magnitude of CYP2D6 induction would be minimal in 2D6 EMs (<10%). A 2D6 induction of 100%, as opposed to 200%, recovered the observed Css (PP:T3) in EMs. Interestingly, in PMs, the median PAR Css was 48, 65, and 71 µg/l during T1, T2, and T3, respectively (n = 2) (Ververs et al., 2009). In comparison, the reported Css in nonpregnant PMs is 80 ± 16 µg/l (n = 3) (Sindrup et al., 1992a). From this very limited data set, we speculate that, in PMs where CLint,other and CYP3A contribute equally to PAR clearance, CLint,other is suppressed during pregnancy, similar to 1A2. This suppression counteracts the effect of CYP3A induction.
DEX is the most sensitive CYP2D6 probe substrate with the highest fm,2D6 among all the drugs included in the model verification set. Therefore, we would expect the systemic exposure of DEX to be reduced substantially in pregnant women. However, such evaluation of DEX plasma concentration-time profiles in pregnant women is not available in literature. Nonetheless, Wadelius et al. (1997) reported a change in DEX plasma concentration (2 hours post dose, ∼ Tmax) of 2.3-fold (PP:T3, range 1.5– 4.9-fold) in CYP2D6 EMs (n = 13). Despite the expected variability associated with Cmax, this change in DEX concentration is in line with ∼100% induction of 2D6: model-predicted DEX AUCR (PP:T3) and Cmax (PP:T3) were 2.4 and 3.0 in 2D6 EMs (unpublished data). A 200% induction of 2D6 would overpredict Cmax (PP:T3) by 91%.
Since the pregnancy effect on DEX UR0-24h was evaluated, we developed a semi-PBPK model of DXO to predict this UR. Construction of a fully mechanistic DXO model is not possible, mainly because once DXO is formed by CYP2D6, significant glucuronidation of DXO in hepatic and extrahepatic tissues occurs, and the appropriate scaler for IVIVE of this clearance is not available (Lutz and Isoherranen, 2012). However, this limitation is not expected to impact our ability to predict DEX UR0-24h, as the latter is based on the total DXO amount excreted in urine, and free and conjugated DXO are mostly recovered in urine (range of recovery 40.2–85%) (Rostami-Hodjegan et al., 1999). The developed model quantitatively predicted mean Ae,DEX, Ae,DXO, and mean DEX UR0-24h in nonpregnant, 2D6 EMs. It is important to note that the interindividual and interstudy variability in observed Ae,DEX and Ae,DXO in nonpregnant, 2D6 EMs is substantial, possibly due to the heterogeneity of the 2D6 EM population (i.e., allelic variant-specific 2D6 activity) and urine pH dependency of DEX CLr (Abduljalil et al., 2010). The PBPK model incorporating 200% induction of CYP2D6 during T3 overpredicted mean DEX UR (PP:T3) by 50%. To recover the observed change, 2D6 activity would need to be induced less than 200%, or the CLr of DEX would need to be increased by 2.5-fold. In the current PBPK model, DEX CLr is assumed to be mainly filtration clearance, as DEX has not been identified as a substrate of major renal transporters. Recent evidence suggests DEX may be secreted by the kidneys (unpublished data, J. D. Lutz and N. Isoherranen). Nevertheless, until confirmed, we concluded that 100% induction of CYP2D6 during T3 was required to recover the observed change in DEX UR.
In pregnant women, CLr (153 ± 67 ml/min) of CLO (Buchanan et al., 2009) did not deviate significantly from that obtained in a Japanese male population (183 ± 55 ml/min) (Fujimura et al., 1994). Therefore, the authors attributed the increase in apparent oral clearance of clonidine during pregnancy to a change in its nonrenal clearance (i.e., CYP2D6). On closer examination, the reported CLr in pregnant women is higher than calculated CLr (fe*CLIV) based on mean fe and mean CLIV in the literature (116.8 ml/min; see Table 5). Nevertheless, if CLr was kept constant during T3, both 100 and 200% induction of 2D6 during T3 could recover the observed AUCR (PP:T3). This finding is not surprising, because CLO AUCR (PP:T3) is not a sensitive reporter of changes in CYP2D6 activity (fm,2D6 = 30%) when the latter is masked by a change or lack of change in CLr, the major elimination pathway of CLO (fe = 41–62%) (Zamek-Gliszczynski et al., 2009).
The previous analyses suggest that CYP2D6 induction during pregnancy could range from 100 to 200%. To determine if this range could be narrowed, we expanded our sensitivity analysis to recover a possible range of 2D6 induction that brackets 80–125% of the observed MET, PAR, DEX, and CLO data in pregnancy. We found these ranges did not overlap, indicating the drugs evaluated reported a different magnitude of CYP2D6 induction, even after accounting for interstudy variability. The reason for these discrepancies is not clear, although we suspect it may be related to the study design being less than optimal. For example, the MET study has a limited sample size, and the interindividual variability of the observed data is large; the PAR dose used varied from 3 to 40 mg in the PAR study, and the reported PAR concentrations normalized to the mean dose of 20 mg can be misleading for a drug with nonlinear kinetics. Additional limitations include the lack of concentration-time profile (PAR and DEX) or the use of urinary metabolic ratio as an index of enzyme activity (DEX) in the published reports. Therefore, to definitively assess the magnitude of CYP2D6 induction during pregnancy, we propose that a PK study with the most sensitive 2D6 probe DEX, where the plasma concentration-time profile of DEX is measured, be conducted during various stages of pregnancy and postpartum. In the absence of such data, we can only conclude that the CYP2D6 induction during the third trimester ranges from 100 to 200%.
The underlying mechanism for the hepatic isoform-specific and gestational state–specific induction during pregnancy is not fully understood. Data from human hepatocyte incubation with pregnancy-related hormones suggest that the rising concentrations of various hormones in maternal blood, including placental growth hormone, progesterone, corticosteroids, and estrogens, contributes to induction of some of these isoforms (Jeong, 2010; Dickmann and Isoherranen, 2013). In contrast, suppression of CYP1A2 activity during pregnancy may be due to the increase in circulating concentration of cytokines (e.g., interleukin-1β and interleukin-6), which suppress 1A2 mRNA expression in human hepatocytes (Dickmann et al., 2011). However, the mechanisms for CYP2D6 induction during pregnancy still remain unknown, and further mechanistic studies are warranted to fill this knowledge gap.
In summary, we have 1) shown that our PBPK model can quantitatively predict the disposition of the CYP1A2 drug THEO during T3; 2) defined the range of 2D6 induction during T3 to be 100–200% through modeling MET, PAR, DEX, and CLO disposition during pregnancy; and 3) shown that our PBPK model allows extrapolation beyond model drugs studied (e.g., caffeine and metoprolol) to other drugs with well characterized ADME characteristics (e.g., THEO, PAR). Previously, we have shown that such extrapolation can also be made for CYP3A–metabolized drugs (Ke et al., 2012). Our study also highlights the importance of further mechanistic and probe drug studies pertaining to CYP2D6 induction during pregnancy. Since conducting PK studies in pregnant women is challenging, we propose that this refined PBPK model be used to evaluate different dosing regimens of CYP3A4-, 1A2-, and 2D6-metabolized drugs during pregnancy.
Supplementary Material
Acknowledgments
The authors thank Drs. William J. Jusko (State University of New York, Buffalo), Timothy Tracy (University of Kentucky, Lexington), Uwe Fuhr (University of Cologne, Cologne, Germany), Mia Wadelius (Uppsala University, Uppsala, Sweden), and Mary Herbert (University of Washington, Seattle) for providing clinical PK data used for model validation.
Abbreviations
- ADME
absorption, distribution, metabolism, and excretion
- AUC
area under the curve
- AUCR
AUC ratio
- B/P
blood-to-plasma concentration ratio
- CI
confidence interval
- CL
clearance
- CLH
hepatic metabolic clearance
- CLint,u
unbound intrinsic clearance
- CLORAL
oral clearance
- CLr
renal clearance
- CLO
clonidine
- Cmax
maximum plasma concentration
- Cmin
minimum plasma concentration
- Css
steady-state plasma concentration
- DEX
dextromethorphan
- DXO
dextrorphan
- EM
extensive metabolizer
- Fa
fraction absorbed
- Fg
intestinal bioavailability
- Fh
hepatic bioavailability
- fm
fraction metabolized of total body clearance
- fu,p
fraction unbound in plasma
- GFR
glomerular filtration rate
- IVIVE
in vitro-in vivo extrapolation
- ka
first-order absorption rate constant
- Kp
tissue-to-plasma partition coefficient
- MET
metoprolol
- P450
cytochrome P450
- PAR
paroxetine
- PBPK model
physiologically based pharmacokinetic model
- PK
pharmacokinetic
- PM
poor metabolizer
- PP
postpartum
- SD
single dose
- SS
steady state
- T1
T2, and T3, first, second, and third trimesters
- THEO
theophylline
- UR
urinary metabolic ratio
Authorship Contributions
Participated in research design: Ke, Nallani, Zhao, Rostami-Hodjegan, Isoherranen, Unadkat.
Conducted experiments: Ke.
Contributed new reagents or analytic tools: Rostami-Hodjegan.
Performed data analysis: Ke.
Wrote or contributed to the writing of the manuscript: Ke, Nallani, Zhao, Rostami-Hodjegan, Isoherranen, Unadkat.
Footnotes
This work was supported by the Food and Drug Administration Office of Women’s Health and a visiting fellowship from Simcyp Limited (now part of Certara). The clonidine pharmacokinetics study in pregnancy was supported in part by a grant from the National Institutes of Health Eunice Kennedy Shriver National Institute of Child Health and Human Development [Grant U10HD047892]. The content is solely the responsibility of the authors and does not necessarily represent the official views of the Eunice Kennedy Shriver National Institute of Child Health and Human Development or the National Institutes of Health.
 This article has supplemental material available at dmd.aspetjournals.org.
References
- Abdul Manap R, Wright CE, Gregory A, Rostami-Hodjegan A, Meller ST, Kelm GR, Lennard MS, Tucker GT, Morice AH. (1999) The antitussive effect of dextromethorphan in relation to CYP2D6 activity. Br J Clin Pharmacol 48:382–387 [DOI] [PMC free article] [PubMed] [Google Scholar]
- Abduljalil K, Frank D, Gaedigk A, Klaassen T, Tomalik-Scharte D, Jetter A, Jaehde U, Kirchheiner J, Fuhr U. (2010) Assessment of activity levels for CYP2D6*1, CYP2D6*2, and CYP2D6*41 genes by population pharmacokinetics of dextromethorphan. Clin Pharmacol Ther 88:643–651 [DOI] [PubMed] [Google Scholar]
- Abduljalil K, Furness P, Johnson TN, Rostami-Hodjegan A, Soltani H. (2012) Anatomical, physiological and metabolic changes with gestational age during normal pregnancy: a database for parameters required in physiologically based pharmacokinetic modelling. Clin Pharmacokinet 51:365–396 [DOI] [PubMed] [Google Scholar]
- Albers GW, Atkinson RP, Kelley RE, Rosenbaum DM, Dextrorphan Study Group (1995) Safety, tolerability, and pharmacokinetics of the N-methyl-D-aspartate antagonist dextrorphan in patients with acute stroke. Stroke 26:254–258 [DOI] [PubMed] [Google Scholar]
- Anavekar SN, Jarrott B, Toscano M, Louis WJ. (1982) Pharmacokinetic and pharmacodynamic studies of oral clonidine in normotensive subjects. Eur J Clin Pharmacol 23:1–5 [DOI] [PubMed] [Google Scholar]
- Anderson GD. (2005) Pregnancy-induced changes in pharmacokinetics: a mechanistic-based approach. Clin Pharmacokinet 44:989–1008 [DOI] [PubMed] [Google Scholar]
- Arndts D, Doevendans J, Kirsten R, Heintz B. (1983) New aspects of the pharmacokinetics and pharmacodynamics of clonidine in man. Eur J Clin Pharmacol 24:21–30 [DOI] [PubMed] [Google Scholar]
- Bertelsen KM, Venkatakrishnan K, Von Moltke LL, Obach RS, Greenblatt DJ. (2003) Apparent mechanism-based inhibition of human CYP2D6 in vitro by paroxetine: comparison with fluoxetine and quinidine. Drug Metab Dispos 31:289–293 [DOI] [PubMed] [Google Scholar]
- Boehringer Ingelheim (2011) Product label for CATAPRES® (Clonidine Hydrochloride) oral tablet.
- Borges S, Li L, Hamman MA, Jones DR, Hall SD, Gorski JC. (2005) Dextromethorphan to dextrorphan urinary metabolic ratio does not reflect dextromethorphan oral clearance. Drug Metab Dispos 33:1052–1055 [DOI] [PubMed] [Google Scholar]
- Brown HS, Ito K, Galetin A, Houston JB. (2005) Prediction of in vivo drug-drug interactions from in vitro data: impact of incorporating parallel pathways of drug elimination and inhibitor absorption rate constant. Br J Clin Pharmacol 60:508–518 [DOI] [PMC free article] [PubMed] [Google Scholar]
- Buchanan ML, Easterling TR, Carr DB, Shen DD, Risler LJ, Nelson WL, Mattison DR, Hebert MF. (2009) Clonidine pharmacokinetics in pregnancy. Drug Metab Dispos 37:702–705 [DOI] [PMC free article] [PubMed] [Google Scholar]
- Capon DA, Bochner F, Kerry N, Mikus G, Danz C, Somogyi AA. (1996) The influence of CYP2D6 polymorphism and quinidine on the disposition and antitussive effect of dextromethorphan in humans. Clin Pharmacol Ther 60:295–307 [DOI] [PubMed] [Google Scholar]
- Claessens AJ, Risler LJ, Eyal S, Shen DD, Easterling TR, Hebert MF. (2010) CYP2D6 mediates 4-hydroxylation of clonidine in vitro: implication for pregnancy-induced changes in clonidine clearance. Drug Metab Dispos 38:1393–1396 [DOI] [PMC free article] [PubMed] [Google Scholar]
- Cody V, DeTitta GT. (1979) The molecular conformation of clonidine hydrochloride, an α-adrenergic agonist. Journal of Crystal and Molecular Structure 9:33–43 [Google Scholar]
- Conway EL, Jarrott B. (1980) Clonidine distribution in the rat: temporal relationship between tissue levels and blood pressure response. Br J Pharmacol 71:473–478 [DOI] [PMC free article] [PubMed] [Google Scholar]
- Corchero J, Granvil CP, Akiyama TE, Hayhurst GP, Pimprale S, Feigenbaum L, Idle JR, Gonzalez FJ. (2001) The CYP2D6 humanized mouse: effect of the human CYP2D6 transgene and HNF4alpha on the disposition of debrisoquine in the mouse. Mol Pharmacol 60:1260–1267 [DOI] [PubMed] [Google Scholar]
- Cunningham FE, Baughman VL, Peters J, Laurito CE. (1994) Comparative pharmacokinetics of oral versus sublingual clonidine. J Clin Anesth 6:430–433 [DOI] [PubMed] [Google Scholar]
- Dickmann LJ, Isoherranen N. (2013) Quantitative Prediction of CYP2B6 Induction by Estradiol During Pregnancy: Potential Explanation for Increased Methadone Clearance During Pregnancy. Drug Metab Dispos 41:270–274 [DOI] [PubMed] [Google Scholar]
- Dickmann LJ, Patel SK, Rock DA, Wienkers LC, Slatter JG. (2011) Effects of interleukin-6 (IL-6) and an anti-IL-6 monoclonal antibody on drug-metabolizing enzymes in human hepatocyte culture. Drug Metab Dispos 39:1415–1422 [DOI] [PubMed] [Google Scholar]
- Eyal S, Easterling TR, Carr D, Umans JG, Miodovnik M, Hankins GD, Clark SM, Risler L, Wang J, Kelly EJ, et al. (2010) Pharmacokinetics of metformin during pregnancy. Drug Metab Dispos 38:833–840 [DOI] [PMC free article] [PubMed] [Google Scholar]
- Frederiksen MC, Ruo TI, Chow MJ, Atkinson AJ., Jr (1986) Theophylline pharmacokinetics in pregnancy. Clin Pharmacol Ther 40:321–328 [DOI] [PubMed] [Google Scholar]
- Frisk-Holmberg M, Paalzow L, Edlund PO. (1981) Clonidine kinetics in man—evidence for dose dependency and changed pharmacokinetics during chronic therapy. Br J Clin Pharmacol 12:653–658 [DOI] [PMC free article] [PubMed] [Google Scholar]
- Fujimura A, Ebihara A, Ohashi K, Shiga T, Kumagai Y, Nakashima H, Kotegawa T. (1994) Comparison of the pharmacokinetics, pharmacodynamics, and safety of oral (Catapres) and transdermal (M-5041T) clonidine in healthy subjects. J Clin Pharmacol 34:260–265 [DOI] [PubMed] [Google Scholar]
- Gardner MJ, Schatz M, Cousins L, Zeiger R, Middleton E, Jusko WJ. (1987) Longitudinal effects of pregnancy on the pharmacokinetics of theophylline. Eur J Clin Pharmacol 32:289–295 [DOI] [PubMed] [Google Scholar]
- Ghasemi J, Saaidpour S. (2007) Quantitative structure-property relationship study of n-octanol-water partition coefficients of some of diverse drugs using multiple linear regression. Anal Chim Acta 604:99–106 [DOI] [PubMed] [Google Scholar]
- Gorski JC, Huang SM, Pinto A, Hamman MA, Hilligoss JK, Zaheer NA, Desai M, Miller M, Hall SD. (2004) The effect of echinacea (Echinacea purpurea root) on cytochrome P450 activity in vivo. Clin Pharmacol Ther 75:89–100 [DOI] [PubMed] [Google Scholar]
- Hamelin BA, Bouayad A, Méthot J, Jobin J, Desgagnés P, Poirier P, Allaire J, Dumesnil J, Turgeon J. (2000) Significant interaction between the nonprescription antihistamine diphenhydramine and the CYP2D6 substrate metoprolol in healthy men with high or low CYP2D6 activity. Clin Pharmacol Ther 67:466–477 [DOI] [PubMed] [Google Scholar]
- Hardman JG, Limbird LE, Gilman AG, editors (2001) Goodman and Gilman's The Pharmacological Basis of Therapeutics, 10th ed, McGraw-Hill, New York [Google Scholar]
- Hendeles L, Massanari M, Weinberger M. (1985) Update on the pharmacodynamics and pharmacokinetics of theophylline. Chest 88(2, Suppl)103S–111S [DOI] [PubMed] [Google Scholar]
- Hendeles L, Weinberger M. (1983) Theophylline. A “state of the art” review. Pharmacotherapy 3:2–44 [DOI] [PubMed] [Google Scholar]
- Hodge LS, Tracy TS. (2007) Alterations in drug disposition during pregnancy: implications for drug therapy. Expert Opin Drug Metab Toxicol 3:557–571 [DOI] [PubMed] [Google Scholar]
- Högstedt S, Lindberg B, Peng DR, Regårdh CG, Rane A. (1985) Pregnancy-induced increase in metoprolol metabolism. Clin Pharmacol Ther 37:688–692 [DOI] [PubMed] [Google Scholar]
- Ito K, Hallifax D, Obach RS, Houston JB. (2005) Impact of parallel pathways of drug elimination and multiple cytochrome P450 involvement on drug-drug interactions: CYP2D6 paradigm. Drug Metab Dispos 33:837–844 [DOI] [PubMed] [Google Scholar]
- Jamei M, Dickinson GL, Rostami-Hodjegan A. (2009) A framework for assessing inter-individual variability in pharmacokinetics using virtual human populations and integrating general knowledge of physical chemistry, biology, anatomy, physiology and genetics: A tale of ‘bottom-up’ vs ‘top-down’ recognition of covariates. Drug Metab Pharmacokinet 24:53–75 [DOI] [PubMed] [Google Scholar]
- Jeong H. (2010) Altered drug metabolism during pregnancy: hormonal regulation of drug-metabolizing enzymes. Expert Opin Drug Metab Toxicol 6:689–699 [DOI] [PMC free article] [PubMed] [Google Scholar]
- Johnson JA, Burlew BS. (1996) Metoprolol metabolism via cytochrome P4502D6 in ethnic populations. Drug Metab Dispos 24:350–355 [PubMed] [Google Scholar]
- Jones DR, Gorski JC, Haehner BD, O’Mara EM, Jr, Hall SD. (1996) Determination of cytochrome P450 3A4/5 activity in vivo with dextromethorphan N-demethylation. Clin Pharmacol Ther 60:374–384 [DOI] [PubMed] [Google Scholar]
- Jornil J, Jensen KG, Larsen F, Linnet K. (2010) Identification of cytochrome P450 isoforms involved in the metabolism of paroxetine and estimation of their importance for human paroxetine metabolism using a population-based simulator. Drug Metab Dispos 38:376–385 [DOI] [PubMed] [Google Scholar]
- Kanaan M, Daali Y, Dayer P, Desmeules J. (2008) Lack of interaction of the NMDA receptor antagonists dextromethorphan and dextrorphan with P-glycoprotein. Curr Drug Metab 9:144–151 [DOI] [PubMed] [Google Scholar]
- Kaye CM, Haddock RE, Langley PF, Mellows G, Tasker TC, Zussman BD, Greb WH. (1989) A review of the metabolism and pharmacokinetics of paroxetine in man. Acta Psychiatr Scand Suppl 350:60–75 [DOI] [PubMed] [Google Scholar]
- Ke AB, Nallan SC, Zhao P, Rostami-Hodjegan A, Unadkat JD.(2012) A PBPK model to predict disposition of CYP3A-metabolized drugs in pregnant women: verification and discerning the site of CYP3A induction. Clin Pharmacol Ther: Pharmacometrics & Systems Pharmacology DOI: 10.1038/psp.2012.2. [DOI] [PMC free article] [PubMed] [Google Scholar]
- Gaohua L, Abduljalil K, Jamei M, Johnson TN, Rostami-Hodjegan A. (2012) A pregnancy physiologically based pharmacokinetic (p-PBPK) model for disposition of drugs metabolized by CYP1A2, CYP2D6 and CYP3A4. Br J Clin Pharmacol 74:873–885 [DOI] [PMC free article] [PubMed] [Google Scholar]
- Lu G, Abduljalil K, Jamei M, Johnson TN, Soltani H, Rostami-Hodjegan A. (2012) Physiologically-based pharmacokinetic (PBPK) models for assessing the kinetics of xenobiotics during pregnancy: achievements and shortcomings. Curr Drug Metab 13:695–720 [DOI] [PubMed] [Google Scholar]
- Lutz JD, Isoherranen N. (2012) Prediction of relative in vivo metabolite exposure from in vitro data using two model drugs: dextromethorphan and omeprazole. Drug Metab Dispos 40:159–168 [DOI] [PMC free article] [PubMed] [Google Scholar]
- Martin RS, Henningsen RA, Suen A, Apparsundaram S, Leung B, Jia Z, Kondru RK, Milla ME (2008) Kinetic and thermodynamic assessment of binding of serotonin transporter inhibitors. J Pharmacol Exp Ther 327:991–1000 [DOI] [PubMed] [Google Scholar]
- Moghadamnia AA, Rostami-Hodjegan A, Abdul-Manap R, Wright CE, Morice AH, Tucker GT. (2003) Physiologically based modelling of inhibition of metabolism and assessment of the relative potency of drug and metabolite: dextromethorphan vs. dextrorphan using quinidine inhibition. Br J Clin Pharmacol 56:57–67 [DOI] [PMC free article] [PubMed] [Google Scholar]
- Obach RS, Walsky RL, Venkatakrishnan K. (2007) Mechanism-based inactivation of human cytochrome P450 enzymes and the prediction of drug-drug interactions. Drug Metab Dispos 35:246–255 [DOI] [PubMed] [Google Scholar]
- Porchet HC, Piletta P, Dayer P. (1992) Pharmacokinetic-pharmacodynamic modeling of the effects of clonidine on pain threshold, blood pressure, and salivary flow. Eur J Clin Pharmacol 42:655–661 [DOI] [PubMed] [Google Scholar]
- Rodgers T, Rowland M. (2007) Mechanistic approaches to volume of distribution predictions: understanding the processes. Pharm Res 24:918–933 [DOI] [PubMed] [Google Scholar]
- Rostami-Hodjegan A, Kroemer HK, Tucker GT. (1999) In-vivo indices of enzyme activity: the effect of renal impairment on the assessment of CYP2D6 activity. Pharmacogenetics 9:277–286 [DOI] [PubMed] [Google Scholar]
- Rowland M, Peck C, Tucker G. (2011) Physiologically-based pharmacokinetics in drug development and regulatory science. Annu Rev Pharmacol Toxicol 51:45–73 [DOI] [PubMed] [Google Scholar]
- Sharma A, Pibarot P, Pilote S, Dumesnil JG, Arsenault M, Bélanger PM, Meibohm B, Hamelin BA. (2005) Modulation of metoprolol pharmacokinetics and hemodynamics by diphenhydramine coadministration during exercise testing in healthy premenopausal women. J Pharmacol Exp Ther 313:1172–1181 [DOI] [PubMed] [Google Scholar]
- Sindrup SH, Brøsen K, Gram LF. (1992a) Pharmacokinetics of the selective serotonin reuptake inhibitor paroxetine: nonlinearity and relation to the sparteine oxidation polymorphism. Clin Pharmacol Ther 51:288–295 [DOI] [PubMed] [Google Scholar]
- Sindrup SH, Brøsen K, Gram LF, Hallas J, Skjelbo E, Allen A, Allen GD, Cooper SM, Mellows G, Tasker TC, et al. (1992b) The relationship between paroxetine and the sparteine oxidation polymorphism. Clin Pharmacol Ther 51:278–287 [DOI] [PubMed] [Google Scholar]
- Sirmans SM, Pieper JA, Lalonde RL, Smith DG, Self TH. (1988) Effect of calcium channel blockers on theophylline disposition. Clin Pharmacol Ther 44:29–34 [DOI] [PubMed] [Google Scholar]
- St-Pierre MV, Spino M, Isles AF, Tesoro A, MacLeod SM. (1985) Temporal variation in the disposition of theophylline and its metabolites. Clin Pharmacol Ther 38:89–95 [DOI] [PubMed] [Google Scholar]
- Stringer KA, Mallet J, Clarke M, Lindenfeld JA. (1992) The effect of three different oral doses of verapamil on the disposition of theophylline. Eur J Clin Pharmacol 43:35–38 [DOI] [PubMed] [Google Scholar]
- Tang-Liu DD, Williams RL, Riegelman S. (1982) Nonlinear theophylline elimination. Clin Pharmacol Ther 31:358–369 [DOI] [PubMed] [Google Scholar]
- Tjia JF, Colbert J, Back DJ. (1996) Theophylline metabolism in human liver microsomes: inhibition studies. J Pharmacol Exp Ther 276:912–917 [PubMed] [Google Scholar]
- Tracy TS, Venkataramanan R, Glover DD, Caritis SN, National Institute for Child Health and Human Development Network of Maternal-Fetal-Medicine Units (2005) Temporal changes in drug metabolism (CYP1A2, CYP2D6 and CYP3A Activity) during pregnancy. Am J Obstet Gynecol 192:633–639 [DOI] [PubMed] [Google Scholar]
- Venkatakrishnan K, Obach RS. (2005) In vitro-in vivo extrapolation of CYP2D6 inactivation by paroxetine: prediction of nonstationary pharmacokinetics and drug interaction magnitude. Drug Metab Dispos 33:845–852 [DOI] [PubMed] [Google Scholar]
- Ververs FF, Voorbij HA, Zwarts P, Belitser SV, Egberts TC, Visser GH, Schobben AF. (2009) Effect of cytochrome P450 2D6 genotype on maternal paroxetine plasma concentrations during pregnancy. Clin Pharmacokinet 48:677–683 [DOI] [PubMed] [Google Scholar]
- Wadelius M, Darj E, Frenne G, Rane A. (1997) Induction of CYP2D6 in pregnancy. Clin Pharmacol Ther 62:400–407 [DOI] [PubMed] [Google Scholar]
- Yamahata T, Minaki Y, Nishikawa H, Esumi Y, Jin Y, Takao A. (1996) Metabolic fate of clonidine (IV): plasma protein binding of clonidine in vitro and in vivo and transfer to fetus and milk in rats after subcutaneous administration of clonidine. Drug Metab Pharmacokinet 11:404–410 [Google Scholar]
- Yang J, Jamei M, Yeo KR, Tucker GT, Rostami-Hodjegan A. (2007) Prediction of intestinal first-pass drug metabolism. Curr Drug Metab 8:676–684 [DOI] [PubMed] [Google Scholar]
- Yu A, Haining RL. (2001) Comparative contribution to dextromethorphan metabolism by cytochrome P450 isoforms in vitro: can dextromethorphan be used as a dual probe for both CTP2D6 and CYP3A activities? Drug Metab Dispos 29:1514–1520 [PubMed] [Google Scholar]
Associated Data
This section collects any data citations, data availability statements, or supplementary materials included in this article.