

Abstract
We have analyzed pharmacokinetic data for glycerol phenylbutyrate (also GT4P or HPN-100) and sodium phenylbutyrate with respect to possible dosing biomarkers in patients with urea cycle disorders (UCD).
Study Design
These analyses are based on over 3000 urine and plasma data points from 54 adult and 11 pediatric UCD patients (ages 6–17) who participated in three clinical studies comparing ammonia control and pharmacokinetics during steady state treatment with glycerol phenylbutyrate or sodium phenylbutyrate. All patients received phenylbutyric acid equivalent doses of glycerol phenylbutyrate or sodium phenylbutyrate in a cross over fashion and underwent 24-hour blood samples and urine sampling for phenylbutyric acid, phenylacetic acid and phenylacetylglutamine.
Results
Patients received phenylbutyric acid equivalent doses of glycerol phenylbutyrate ranging from 1.5–31.8 g/day and of sodium phenylbutyrate ranging from 1.3–31.7 g/day. Plasma metabolite levels varied widely, with average fluctuation indices ranging from 1979% –5690% for phenylbutyric acid, 843% to 3931% for phenylacetic acid, and 881% -to 1434% for phenylacetylglutamine. Mean percent recovery of phenylbutyric acid as urinary phenylacetylglutamine was 66.4 and 69.0 for pediatric patients and 68.7 and 71.4 for adult patients on glycerol phenylbutyrate and sodium phenylbutyrate, respectively. The correlation with dose was strongest for urinary phenylacetylglutamine excretion, either as morning spot urine (r=0.730, p<0.001) or as total 24-hour excretion (r=0.791 p<0.001), followed by plasma phenylacetylglutamine AUC24-hour, plasma phenylacetic acid AUC24-hour and phenylbutyric acid AUC24-hour. Plasma phenylacetic acid levels in adult and pediatric patients did not show a consistent relationship with either urinary phenylacetylglutamine or ammonia control.
Conclusion
The findings are collectively consistent with substantial yet variable pre-systemic (1st pass) conversion of phenylbutyric acid to phenylacetic acid and/or phenylacetylglutamine. The variability of blood metabolite levels during the day, their weaker correlation with dose, the need for multiple blood samples to capture trough and peak, and the inconsistency between phenylacetic acid and urinary phenylacetylglutamine as a marker of waste nitrogen scavenging limit the utility of plasma levels for therapeutic monitoring. By contrast, 24-hour urinary phenylacetylglutamine and morning spot urine phenylacetylglutamine correlate strongly with dose and appear to be clinically useful non-invasive biomarkers for compliance and therapeutic monitoring.
INTRODUCTION
Urea Cycle Disorders (UCDs), which include several inherited enzyme and transporter deficiencies, result in the accumulation of toxic levels of ammonia in the blood and brain and can present in the neonatal period or later in life depending on the severity and type of defect (1–3). Control of hyperammonemia, the major cause of morbidity and mortality in UCD patients, is a major objective of treatment (4–5).
UCD patients whose symptoms are not adequately controlled with diet alone are generally treated with alternate pathway drugs such as sodium phenylbutyrate, which is approved in the US (trade name: BUPHENYL®) (sodium phenylbutyrate) Powder and Tablets) and Europe (trade name: AMMONAPS®) for the chronic treatment of UCDs and lowers ammonia by enhancing excretion of waste nitrogen in the form of phenylacetylglutamine. Although sodium phenylbutyrate has been used for the treatment of UCDs since at least 1979, comparatively little information is available to guide physicians regarding its optimal dosing (6–8).
Blood ammonia is routinely evaluated; however, ammonia values vary up to 10-fold over the course of a day, even in well controlled patients, a fact which limits the use of random blood ammonia for dose adjustment (9, 10). The major metabolites of sodium phenylbutyrate and glycerol phenylbutyrate metabolites, phenylbutyric acid, phenylacetic acid and phenylacetylglutamine, all have comparatively short circulating half lives and vary many-fold during the day (9, 10). For example, in a study of pediatric UCD patients with three times daily dosing of sodium phenylbutyrate or glycerol phenylbutyrate, daily plasma phenylacetic acid values ranged from <1 to 148 ug/mL on sodium phenylbutyrate and <1 to 244 ug/mL on glycerol phenylbutyrate (10).
Moreover, in adult UCD patients, Lee et al have reported differences in systemic exposure to PBA (plasma PBA AUC0–24 hour of 740 vs 540 ug* h/mL) despite nearly identical urinary recovery of the administered dose of PBA as PAGN (54%) after sodium phenylbutyrate and glycerol phenylbutyrate treatment (9). A similar disparity between systemic exposure and urinary recovery of administered dose of PBA as sodium phenylbutyrate and glycerol phenylbutyrate has also been reported in pediatric UCD patients (10). These findings suggest that metabolite blood levels may not fully reflect waste nitrogen removal and exhibit variability which limits their utility for therapeutic monitoring.
Glycerol phenylbutyrate is an investigational agent being developed for UCDs. It has the same mechanism of action as sodium phenylbutyrate, except that, unlike sodium phenylbutyrate which is a salt, glycerol phenylbutyrate is a short chain triglyceride consisting of 3 molecules of phenylbutyric acid attached to glycerol in ester linkage that contains no sodium and is hydrolyzed in the small intestine by pancreatic lipases to release phenylbutyric acid (8, 9, 11). Upon absorption, phenylbutyric acid is converted via β-oxidation to phenylacetic acid, which is conjugated with L-glutamine by phenylacetyl CoA: L glutamine N acetyltransferase found in primates liver and kidney to form PAGN to form phenylacetylglutamine, which is excreted in the urine and mediates excretion of waste nitrogen (13,14). The glycerol phenylbutyrate clinical trials, for which sodium phenylbutyrate has served as the approved comparator, have afforded the opportunity to systematically evaluate the clinical utility of blood and urine metabolites as dosing biomarkers.
MATERIALS AND METHODS
Study Design and Treatments
Clinical Studies
Pharmacokinetic data from 3 switch over studies in UCD patients are presented in these analyses. Patients received exclusively sodium phenylbutyrate or the equivalent dose of glycerol phenylbutyrate during each period. Studies UP1204-003 and HPN-100-005 were open-label, fixed sequence switchover studies completed by 10 adult and 11 pediatric (6–17yr) UCD patients, respectively. Study HPN-100-006 was a pivotal, randomized, active-controlled, cross-over study completed by 44 adult UCD patients and designed to establish the non-inferiority of glycerol phenylbutyrate to sodium phenylbutyrate as assessed by venous ammonia. In all three studies, patients were on a stable dose of sodium phenylbutyrate and were clinically controlled at entry. Patients received sodium phenylbutyrate or an equivalent dose of glycerol phenylbutyrate divided into 3 daily doses taken with meals for 7–14 days, sufficient to reach steady state (9. 10, 11, 12). At the end of each period, in a controlled clinical setting, serial blood samples (8 to 11 samples) for measurement of ammonia and drug metabolites were obtained as well as urine samples for measurement of phenylbutyric acid, phenylacetic acid and phenylacetylglutamine. The similarity of study design and measurements allows pooling of the data across all three studies.
Biochemical Analyses
Sodium phenylbutyrate and glycerol phenylbutyrate metabolites including phenylbutyric acid, phenylacetic acid, and phenylacetylglutamine were measured by a validated liquid chromatography tandem mass spectrometry method whereby data were acquired and processed (integrated) using Analyst (version 1.4) (Applied Biosystems, Inc.) and the peak area information analyzed in relation to separate standard curves for phenylbutyric acid, phenylacetic acid, and phenylacetylglutamine at the bioanalytical laboratory, Quest Pharma Services (9, 10, 12, 15). Although other metabolites of phenylbutyric acid such as phenylbutyrlglutamine or phenyacetylglycine have been reported in humans (16), these metabolites were not detected in plasma samples and accounted for less than 1% of the administered doses of phenylbutyric acid in adult UCD patients (9) and, therefore, were not evaluated in the present study. Venous ammonia was measured by the accredited hospital laboratory at each site.
Pharmacokinetic and Ammonia Sampling
Blood samples for analysis of venous ammonia, phenylbutyric acid, phenylacetic acid and phenylacetylglutamine (major glycerol phenylbutyrate and sodium phenylbutyrate metabolites) were collected on the last day of dosing with either sodium phenylbutyrate or glycerol phenylbutyrate at various time points that included 0, 30 min, and 1, 2, 4, 5, 6, 8, 12, 16, 20 and 24 hours post-first dose. The number and timing of blood samples varied per study, however, times 0, 4, 8, 12 and 24 hours after the first daily dose were common between all 3 studies and time points 0, 2, 4, 8, 12, 16, 20 and 24 hours were common between at least 2 studies. Lunch and dinner typically were eaten after the 4 and 8 hour collections, respectively. Urine was collected in aliquots of 0–12 hours (beginning with the first dose of the day) and 12–24 hours.
Pharmacokinetic Analyses
Pharmacokinetic parameters of phenylbutyric acid, phenylacetic acid and phenylacetyl glutamine in plasma and urine were calculated using a validated version of WinNonlin® Enterprise (Version 5.2). Statistical analyses were performed using WinNonlin v.5.2 (LinMix Module). Plasma PK parameters, including mean and coefficient of variation (standard deviation [SD], expressed as a percentage of the mean), were calculated using actual time-concentration profiles for each subject and included the following: Area under the concentration versus time curve from time 0 (pre-dose) to 24 hours (AUC0–24), was calculated using the linear trapezoid rule, maximum plasma concentration at steady state (Cmaxss), and minimum plasma concentration at steady state (Cminss) among other PK parameters. However, for practical purposes in this analysis, trough plasma levels were defined as plasma levels obtained at the 24-hour time point after observed overnight fasting. Peak plasma levels were defined as plasma levels at 12-hour time points, which is approximately 2 hours after dinner and the third and last daily dose of study drug. The amount of PAGN excreted in urine over 24 hours was calculated by multiplying urine volume with urinary concentrations. The fluctuation between maximum and minimum plasma concentrations of plasma metabolites (PBA, PAA and PAGN) was assessed for each subject using the following formula .
Statistical Analyses
The correlation of total dose of sodium phenylbutyrate or glycerol phenylbutyrate with urine and plasma metabolites using the Spearman rank-order correlation was performed. Data were summarized using descriptive statistics and presented by treatment group and overall (i.e., data from both treatment groups). The administered dose was correlated with plasma AUC0–24, peak (12-hour time point) and trough (24-hour time point) levels of ammonia, phenylbutyric acid, phenylacetic acid and phenylacetyl glutamine and with morning concentration of phenylacetyl glutamine in urine as well as 24-hour excretion of phenylacetyl glutamine as the major urinary metabolite.
RESULTS
Analysis Data Set
A total of 65 UCD patients, including 11 pediatric patients ages 6–17, were enrolled. The majority of patients were female and OTC subtype. Each patient received an equivalent amount of sodium phenylbutyrate or glycerol phenylbutyrate; the dose of glycerol phenylbutyrate was calculated based on each patient’s prescribed dose of sodium phenylbutyrate at the time of enrollment, which ranged from 197 – 476 mg/kg with a mean of 321 mg/kg. Pediatric patients received slightly lower total doses as compared to adults (Table 1).
Table 1.
Patient Demographics
| Demographic Characteristics (Safety Population) | UP 1204-003 (N = 14) | HPN-100-006 (N = 45) | HPN-100-005 (N = 11) | |
|---|---|---|---|---|
|
| ||||
| Sex, N (%) | Male | 5 (35.7) | 14 (31.1) | 1 (9.1) |
| Female | 9 (64.3) | 31 (68.9) | 10 (90.9) | |
|
| ||||
| Age (years) at screening visit | Mean (SD) | 35.71 (16.3) | 32.73 (13.5) | 10.18 (3.9) |
| Median | 30.00 | 28.00 | 10.00 | |
|
| ||||
| UCD Subtype N (%) | OTC | 12 (85.7) | 40 (88.9) | 9 (81.8) |
| CPS 1 | 0 | 2 (4.4) | 0 | |
| ARG | 0 | – | 0 | |
| ASS | 1 (7.1) | 3 (6.7) | 1 (9.1) | |
| ASL | 0 | – | 1 (9.1) | |
| HHH | 1 (7.1) | – | 0 | |
|
| ||||
| Daily dose of NaPBA (g) | Mean (SD) | 13.49 (6.075) | 14.54 (6.808) | 12.41 (4.392) |
| Median | 12.78 | 15.00 | 10.50 | |
|
| ||||
| Duration of NaPBA Treatment (mo) | Mean (SD) | 97.89 (88.4) | 128.57 (97.4) | 74.68 (48.2) |
| Median | 84.00 | 120.00 | 76.0 | |
|
| ||||
| Dose during study (grams of PBA/day) Mean (SD) | NaPBA | 12.22 (4.048) | 12.33 (5.582) | 10.90 (3.858) |
| GPB | 12.36 (3.917) | 12.50 (5.529) | 11.10 (3.805) | |
ARG = arginase deficiency; ASS = argininosuccinate synthetase deficiency; ASL = argininosuccinate lyase deficiency; CPS = carbamyl phosphate synthetase deficiency; HHH = ornithine translocase deficiency; OTC = ornithine transcarbamylase deficiency; SD = standard deviation; UCD = urea cycle disorder; GPB= Glycerol Phenylbutyrate, NaPBA = sodium phenylbutyrate (BUPHENYL®); HA = Hyperammonemic Crisis.
Correlates of Drug Dose with Metabolites and Ammonia
Table 2 summarizes the PK parameters in all studies. Plasma metabolites varied several fold during the day and showed a high degree of variability with fluctuation indices, a measure of difference between minimum and maximum concentration at steady state, ranging form approximately 800% to more than 5000%. The fluctuation index was highest with the parent metabolite phenylbutyric acid (5690% in pediatric patients receiving glycerol phenylbutyrate) and lowest with the terminal metabolite phenylacetylglutamine (881% in adult patients receiving glycerol phenylbutyrate). With the exception of phenylbutyric acid in pediatric patients, fluctuation indices tended to be smaller after glycerol phenylbutyrate administration than sodium phenylbutyrate. Total plasma exposure (AUC24-hour) and maximum exposure (Cmax) were lower in adult patients following glycerol phenylbutyrate treatment than sodium phenylbutyrate, while in pediatric patients it was slightly higher following glycerol phenylbutyrate treatments for all metabolites. However, the minimum concentrations (Cmin) of all metabolites were consistently higher after glycerol phenylbutyrate treatment than sodium phenylbutyrate in either adults or pediatric patients. The 24-hour excretion of urinary phenylacetylglutamine ranged from 11 to 14 grams and was similar between the two drugs and in adults and pediatric populations. The percent recovery of the administered dose of phenylbutyric acid as urinary phenylacetylglutamine was also similar between the two drugs, with a mean of 66.4% and 69.0% in pediatrics to 68.7% and 71.4% in adults for glycerol phenylbutyrate and sodium phenylbutyrate respectively (Table 2). The total administered dose correlated positively with urinary phenylacetylglutamine (Figure 1) as well as with blood metabolites (Table 3). While many correlations achieved statistical significance, the strongest correlations for the dose of either glycerol phenylbutyrate or sodium phenylbutyrate were observed for 24-hour excretion of urinary phenylacetylglutamine (r = 0.795; p < 0.001 and r = 0.800; p < 0.001, Spearman rank order, respectively) followed by plasma phenylacetylglutamine, plasma phenylacetic acid, and plasma phenylbutyric acid assessed as AUC0–24 or, generally less strongly, as peak (12-hour time point) or trough (24-hour time point). The total dose also correlated positively and significantly with concentration of urinary phenylacetylglutamine on spot urine.
Table 2.
Pharmacokinetics of Glycerol Phenylbutyrate (GPB) or Sodium Phenylbutyrate (NaPBA) in Adult and Pediatric Patients with UCDs
| PK Variable | Study UP 1204-003 Adult Patients (N = 10) | Study HPN-100-006 Adult Patients (N = 44) | Study HPN-100-005 Pediatric Patients (N = 11) | |||
|---|---|---|---|---|---|---|
| GPB | NaPBA | GPB | NaPBA | GPB | NaPBA | |
| Plasma PBA - Mean (%CV) | ||||||
| AUC0–24 (μg h/mL) | 540 (60) | 739 (49) | 433 (77) | 508 (73) | 631 (45) | 236 (105) |
| Cmax-ss (μg/mL) | 70.1 (65) | 141 (44) | 51.9 (67) | 80.9 (65) | 95.6 (42) | 37.4 (102) |
| Cmin-ss (μg/mL) | 2.87 (265) | 0.59 (255) | 1.44 (201) | 0.09 (392) | 1.50 (100) | 0.37 (171) |
| % Fluctuation | 3016 (107) | 4864 (70) | 2582 (85) | 3579 (114) | 5690 (57) | 1979 (124) |
| Plasma PAA- Mean (%CV) | ||||||
| AUC0–24 (μg h/mL) | 574.6 (169) | 595.6 (124) | 447 (130) | 599 (92) | 964 (64) | 773 (73) |
| Cmax-ss (μg/mL) | 40.5 (148) | 53.0 (95) | 38.5 (103) | 52.2 (80) | 90.5 (69) | 75.1 (64) |
| Cmin-ss (μg/mL) | 7.06 (311) | 3.56 (194) | 2.11 (381) | 0.903 (378) | 2.99 (122) | 0.674 (131) |
| % Fluctuation | 843 (72) | 956 (62) | 1368 (92) | 2150 (103) | 3483 (53) | 3931 (85) |
| Plasma PAGN- Mean (%CV) | ||||||
| AUC0–24 (μg h/mL) | 1098 (44) | 1133 (31) | 1127 (62) | 1252 (57) | 1378 (40) | 1015 (45) |
| Cmax-ss (μg/mL) | 71.9 (56) | 83.3 (26) | 78.6 (56) | 86.8 (52) | 105 (34) | 74.8 (37) |
| Cmin-ss (μg/mL) | 12.1 (134) | 16.8 (86) | 15.1 (138) | 9.09 (155) | 13.1 (65) | 4.6 (66) |
| % Fluctuation | 1145 (85) | 952 (120) | 881 (74) | 1434 (58) | 1001 (85) | 1917 (55) |
| U-PAGN 0–24 hour Excretion- Mean (%CV) | ||||||
| Ae (g) | 10.8 (25) | 12.2 (48) | 13.5 (52) | 13.6 (52) | 12.5 (56.9) | 12.5 (51) |
| Fe % dose | NA | NA | 68.7 (25) | 71.4 (26) | 66.4 (24) | 69.0 (24) |
Ae = amount excreted after dose; AUC = area under the concentration versus time curve; CL/F = apparent clearance; Cmax = maximum plasma concentration at a steady state; Fe = fraction excreted in urine; GPB = glycerol phenylbutyrate; min = minimum; NA = not available; NaPBA = sodium phenylbutyrate; PAA = phenylacetic acid; PAGN = phenylacetylglutamine; PBA = phenylbutyric acid; PK = pharmacokinetic; SD = standard deviation; SS = steady state; Tmax = time maximum plasma concentration; UCD = urea cycle disorder; U-PAGN = urinary phenylacetylglutamine.
Figure 1.
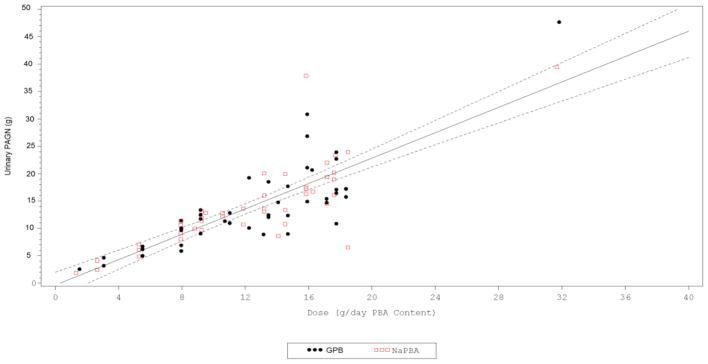
Urinary phenylacetylglutamine excretion versus total dose of glycerol phenylbutyrate or sodium phenylbutyrate administered. A strong correlation was observed between 24-hour urinary phenylacetylglutamine (PAGN) excretion and total daily administered dose of either glycerol phenylbutyrate (GPB) (r=0.821 p<0.001) or sodium phenylbutyrate (r= 0.788; p<0.001). Depicted are the data from 3 controlled studies of glycerol phenylbutyrate (GPB) vs. sodium phenylbutyrate (NaPBA) in UCD patients ages 6 and above. Black circles represent GPB and red squares represent NaPBA. Urinary PAGN is expressed as total micrograms of phenylacetylglutamine excretion over 24 -hour. Dose is expressed as total grams of PBA delivered orally either as GPB or NaPBA.
Table 3.
Correlation of Total Dose with Glycerol Phenylbutyrate (GPB) or Sodium Phenylbutyrate (NaPBA) Metabolites
| Metabolite | Variable | GPB (N = 65) | NaPBA (N = 65) | Overall (N = 130) | |||
|---|---|---|---|---|---|---|---|
| Coefficient (r)a | p-valuea | Coefficient (r)a | p-valuea | Coefficient (r)a | p-valuea | ||
| U-PAGN Excretion | 0–24–h | 0.795 | < 0.001 | 0.800 | < 0.001 | 0.791 | < 0.001 |
| 0–12 h | 0.683 | < 0.001 | 0.731 | < 0.001 | 0.685 | < 0.001 | |
| 12–24 h | 0.738 | < 0.001 | 0.780 | < 0.001 | 0.747 | < 0.001 | |
| Plasma PAGN | AUC0–24 | 0.709 | < 0.001 | 0.731 | < 0.001 | 0.716 | < 0.001 |
| 24 h (trough) | 0.791 | < 0.001 | 0.640 | < 0.001 | 0.699 | < 0.001 | |
| 12 h (peak) | 0.524 | < 0.001 | 0.629 | < 0.001 | 0.559 | < 0.001 | |
| Plasma PAA | AUC0–24 | 0.516 | < 0.001 | 0.579 | < 0.001 | 0.535 | < 0.001 |
| 24 h (trough) | 0.442 | < 0.001 | 0.117 | 0.376 | 0.406 | < 0.001 | |
| 12 h (peak) | 0.442 | < 0.001 | 0.532 | < 0.001 | 0.482 | < 0.001 | |
| Plasma PBA | AUC0–24 | 0.474 | < 0.001 | 0.602 | < 0.001 | 0.534 | < 0.001 |
| 24 h (trough) | 0.520 | < 0.001 | −0.031 | 0.816 | 0.285 | 0.002 | |
| 12 h (peak) | 0.524 | < 0.001 | 0.629 | < 0.001 | 0.559 | < 0.001 | |
AUC0–24 = area under the concentration from time 0 (pre-dose) to 24 hours, Cmax = maximum plasma concentration, Cmin = minimum plasma concentration, PAA = phenylacetic acid, PAGN = phenylacetylglutamine, PBA = phenylbutyric acid, U-PAGN = urinary phenylacetylglutamine, GPB = glycerol phenylbutyrate. NaPBA = sodium phenylbutyrate.
Correlation obtained using the Spearman rank-order correlation.
There was a weak and mostly positive correlation between blood ammonia and metabolite levels (Table 4). Although some achieved statistical significance, (phenylacetic acid AUC24-hour (r=0.238 p=0.008), the correlations appeared inconsistent and weak with correlation coefficients ranging from −0.004 to 0.236 (Table 4).
Table 4.
Correlation of Blood Ammonia with Glycerol Phenylbutyrate (GPB) or Sodium Phenylbutyrate (NaPBA) Metabolites
| Metabolite | Variable | GPB (N=65) | NaPBA (N=65) | Overall (N=130) | |||
|---|---|---|---|---|---|---|---|
| Coefficient (r)a | p-valuea | Coefficient (r)a | p-valuea | Coefficient (r)a | p-valuea | ||
| U-PAGN Excretion | 0–24–h | 0.088 | 0.485 | 0.183 | 0.144 | 0.141 | 0.109 |
| 0–12 h | 0.278 | 0.025 | 0.122 | 0.333 | 0.204 | 0.020 | |
| 12–24 h | −0.045 | 0.719 | 0.197 | 0.115 | 0.068 | 0.445 | |
| Plasma PAGN | AUC0–24 | −0.087 | 0.497 | 0.138 | 0.277 | 0.028 | 0.759 |
| 24 h (trough) | −0.097 | 0.444 | 0.037 | 0.774 | −0.042 | 0.634 | |
| 12 h (peak) | −0.036 | 0.783 | 0.127 | 0.315 | 0.050 | 0.580 | |
| Plasma PAA | AUC0–24 | 0.129 | 0.317 | 0.340 | 0.007 | 0.236 | 0.008 |
| 24 h (trough) | −0.078 | 0.553 | 0.154 | 0.244 | 0.011 | 0.904 | |
| 12 h (peak) | 0.172 | 0.182 | 0.251 | 0.044 | 0.228 | 0.010 | |
| Plasma PBA | AUC0–24 | 0.040 | 0.756 | 0.227 | 0.074 | 0.131 | 0.142 |
| 24 h (trough) | −0.082 | 0.535 | 0.173 | 0.195 | 0.011 | 0.903 | |
| 12 h (peak) | −0.037 | 0.775 | 0.005 | 0.970 | −0.004 | 0.962 | |
PAA = phenylacetic acid, PAGN = phenylacetylglutamine, PBA = phenylbutyric acid, U-PAGN = urinary phenylacetylglutamine, GPB = glycerol phenylbutyrate. NaPBA = sodium phenylbutyrate.
Correlation obtained using the Spearman rank-order correlation.
DISCUSSION
Twenty-four hour pharmacokinetic profiles of 65 UCD patients receiving both sodium phenylbutyrate and glycerol phenylbutyrate for treatment of their UCD in 3 cross over studies have been analyzed in relation to total exposure to plasma metabolites, urinary excretion of terminal metabolites and correlation of plasma and urine metabolites with the administered dose. Plasma metabolite concentrations vary greatly during the day after TID dosing with either sodium phenylbutyrate or glycerol phenylbutyrate. There was high inter- and intra-subject variability noted in plasma metabolite levels. The high inter-subject variability is explained in part by a wide range of doses that the study population received. However, the intra-subject variability, as reflected in the high fluctuation indices, is explained by the short metabolite half-life and limits the utility of random measurement of plasma metabolite. Thus, the correlation of dose administered with plasma metabolites is most reliable when measured as 24-hour AUC.
Contrary to what might be expected, plasma concentration of the parent compound, phenylbutyric acid, shows the weakest correlation with dose, while plasma concentration of the terminal metabolite, phenylacetylglutamine, shows the strongest correlation. A similar pattern is observed when peak or trough plasma levels are correlated with the dose. The correlation of urinary phenylacetylglutamine excretion with the administered dose is both the strongest and most consistent. Similarly, the weak and mainly positive correlation between blood ammonia, a measure of pharmacodynamic (PD) effects of administered dose, and plasma metabolite levels likely reflects a ‘dose-to-effect’ phenomenon. The dosing of UCD patients is highly individualized and tailored to reflect the severity of each patient’s deficiency in urea synthesis and nutritional requirements.
Therefore, severely affected patients or patients with higher protein requirements such as pediatric patients may have higher levels of blood ammonia and, hence, higher drug requirements, leading to higher levels of plasma metabolites. This is in contrast to the conventional PK/PD inverse relationship whereby higher metabolite levels typically are associated with lower PD markers (e.g., lower blood pressure with higher antihypertensive drug dose).
These findings pertaining to the relative strength of the correction of metabolites with dose (urinary phenylacetylglutamine > plasma phenylacetylglutamine > plasma phenylacetic acid > plasma phenylbutyric acid) are likely explained by the unusual pharmacology of these drugs and consistent with the interpretation that a variable fraction of phenylbutyric acid absorbed from the gastrointestinal tract is converted to phenylacetic acid and/or phenylacetylglutamine prior to reaching the systemic circulation, presumably via pre-systemic or first pass metabolism (Figure 2). Enterocytes and hepatocytes, which are exposed to phenylbutyric acid prior to its reaching the systemic circulation, are both enzymatically equipped for beta oxidation and, hence, conversion of phenylbutyric acid to phenylacetic acid (17). Hepatocytes (as well as kidney) are enzymatically equipped to conjugate phenylacetic acid with glutamine to form phenylacetylglutamine (18). Therefore, entrocytes and hepatocytes presumably constitute the pre-systemic compartment in which phenylbutyric acid exerts its nitrogen scavenging activity, at least in part, through formation of phenylacetylglutamine prior to its reaching the systemic circulation. This mechanistic interpretation is supported by population PK modeling of several thousand data points (15). By contrast, most phenylacetylglutamine presumably must pass through the systemic circulation in order to reach the kidneys for excretion, although it is possible that some intrarenal conversion of phenylacetic acid to phenylacetylglutamine may occur (18), whereas phenylacetic acid exhibits intermediate behaviour (Figure 2).
Figure 2.

Presystemic and systemic metabolism of glycerol phenylbutyrate and sodium phenylbutyrate. Unlike most other drugs which need to reach the systemic circulation to exert their effect, PBA delivered either as GPB or NaPBA does not need to reach the systemic circulation to mediate urinary excretion of waste nitrogen in the form of PAGN. Rather, phenylbutyric acid (PBA) released by dissolution of sodium phenylbutyrate (NaPBA) or by pancreatic lipases via hydrolysis of glycerol phenylbutyrate (GPB) undergoes partial pre-systemic (1st pass) metabolism to phenylacetic acid (PAA) and/or phenylacetylglutamine (PAGN) in enterocytes and/or hepatocytes. Patient to patient variability in the degree of 1st pass metabolism accounts for differences in systemic exposure to PBA, PAA, and PAGN despite similar urinary recovery of PAGN. The kidney is also enzymatically equipped to conjugate PAA with PAGN to form PAGN.
Based on the present findings a single plasma metabolite level, peak or trough, is unlikely to reliably reflect either the dose or drug administered or drug effect. In contrast, urinary phenylacetylglutamine, either collected over 24-hour or as a single morning spot sample after a period of fasting, correlates strongly with dose. While measurement of phenylacetic acid, which has been reported to be associated with reversible toxicity when administered IV to cancer patients (19, 20), may be useful for safety monitoring, the considerable variability of blood metabolite levels, their weaker correlation with dose, as well as practical considerations, limit their utility for therapeutic and compliance monitoring.
By contrast, either 24-hour urinary phenylacetylglutamine or morning spot urine phenylacetylglutamine appear to be clinically useful non-invasive biomarkers for monitoring compliance and the need for dose adjustment. However, unlike the conclusions reached by Brusilow in his pioneering work exploring phenylacetylglutamine as an alternative to urea for excretion of waste nitrogen, phenylbutyric acid is not completely, or nearly so converted to urinary phenylacetylglutamine (7, 8). Rather, the conversion of orally administered phenylbutyric acid, either as sodium phenylbutyrate or glycerol phenylbutyrate, to urinary phenylacetylglutamine is variable among patients and averages between 60 and 75% in both pediatric and adult patients. Thus, quantitative assessment of how effectively a given patient utilizes his or her dose of drug for purposes of waste nitrogen excretion should not be based on administered dose, but rather on measurement of urinary phenylacetylglutamine output.
Highlights.
Relation of administered dose of phenylbutyrate compounds and plasma and urinary metabolites is described
First pass mechanism and degrees of absorption of phenylbutyrate compounds is discussed
The variability of plasma metabolites levels is discussed
Urinary PAGN is discussed as a practical biomarker for dose adjustment and assessing compliance
Acknowledgments
This study was sponsored by Hyperion Therapeutics. The authors gratefully acknowledge and thank the efforts of the Study Coordinators and nursing staff who made these trials possible, including N. Schrager (Mount Sinai School of Medicine), A. Donovan, J. Crawford, Pediatric TRU Staff, K. Defouw, J. Balliet (The Medical College of Wisconsin), M. Keuth, N. O’Donnell (Long Beach Memorial Hospital), M. Hussain, E. Bailey, M. Ambreen (The Hospital for Sick Children, University of Toronto, ON, Canada), C. Bailey, A. Lang (The University of Utah), J. Perry, V. de Leon, A. Niemi, K. Cusmano (Stanford University), T. Carlson, J. Parker (University of Minnesota), S. Burr (Children’s Hospital Colorado), K. Simpson (Children’s National Medical Center), K. Regis (Nationwide Children’s Hospital), A. Behrend, T. Marrone (Oregon Health Sciences University), N. Dorrani (University of California, Los Angeles), C. Heggie (Case Western Reserve University), S. Mortenson (Maine Medical Center), S. Deward (Children’s Hospital of Pittsburgh), K. Murray, C. Dedomenico (Tufts Medical Center), C. Gross (University of Florida), L. Brody (Seattle Children’s Hospital), M. Mullins, S. Carter, A. Tran, J. Stuff, TCH General Clinical Research Center nursing staff (Baylor), K. Lisam (Hyperion), as well as the Clinical and Translational Science Awards/General Clinical Research Center Grants (Baylor College of Medicine, M01RR00188; Case Western Reserve University, UL1RR024989; Clinical and Translational Science Institute at Children’s National Medical Center NIH/NCRR, UL1RR31988; Medical College of Wisconsin, UL1RR31973; Mount Sinai School of Medicine, UL1RR29887; Oregon Health & Science University, UL1RR24140; Stanford University, UL1RR25744; Tufts University, UL1RR25752; University of California, Los Angeles, UL1RR33176; University of Colorado, UL1RR25780; University of Florida, UL1RR29890; University of Minnesota, UL1RR33183; University of Pittsburgh, UL1RR24153, UL1TR000005; University of Utah, UL1RR25764; University of Washington, UL1RR25014), the Urea Cycle Disorders Consortium (NIH Grant U54RR019453) and grants from the O’Malley Foundation and Kettering Fund which provided support. SCS. Nagamani is an awardee of the National Urea Cycle Disorders Foundation Research Fellowship.
List of Abbreviations
- ASL
argininosuccinate lyase deficiency
- ASS
argininosuccinate synthetase deficiency
- AUC0–24
24 hour area under the curve
- CV%
coefficient of variation
- DSMB
Data Safety and Monitoring Board
- GPB
glycerol phenylbutyrate (generic name for glyceryl tri (4-phenylbutyrate), also referred to as HPN-100)
- ITT
intention to treat
- NaPBA
sodium phenylbutyrate
- NH324-hour AUC
ammonia 24-hour area under the curve
- OTC
ornithine transcarbamylase deficiency
- PAA
phenylacetic acid
- PAGN
phenylacetylglutamine
- PBA
phenylbutyric acid
- PK
pharmacokinetic
- UCD
urea cycle disorder
- ULN
upper limit of normal
- U-PAGN24-hour Excr
PAGN excreted in urine over 24 hours
Footnotes
Conflict of Interest Statement: M. Mokhtarani, K. Dickinson, D Coakley, T Moors, and B.F. Scharschmidt are/were employees of Hyperion at the time of the study. None of the other authors have a financial interest in Hyperion, although payments were made by Hyperion to the following institutions: Mount Sinai School of Medicine (G. Diaz, PI), The Medical College of Wisconsin (W. Rhead, PI), Children’s National Medical Center (U. Lichter, PI), Long Beach Memorial Hospital (J. Bartley, PI), The Hospital for Sick Children (A. Feigenbaum, PI), The University of Utah (N. Longo, PI), Stanford University (W. Berquist, PI), University of Minnesota (S. Berry, PI), Children’s Hospital Colorado (R. Gallagher, PI), Nationwide Children’s Hospital (D. Bartholemew, PI), Oregon Health Sciences University (C. Harding, PI), Tufts Medical Center (M. Korson, PI), Case Western Reserve University (S. McCandless, PI), Maine Medical Center (W. Smith, PI), Children’s Hospital of Pittsburgh (J. Vockley, PI), SNBL (S. Bart, PI), Westchester Medical Center (D. Kronn, PI), University of Florida (R. Zori, PI), University of California, Los Angeles (S. Cederbaum, PI), Seattle Children’s Hospital (J. Merritt, PI), Baylor College of Medicine (B. Lee, PI) for services provided in the conduct of the study.
ClinicalTrials.gov Identifier: NCT00551200, NCT00947544, NCT00992459, NCT00947297
Publisher's Disclaimer: This is a PDF file of an unedited manuscript that has been accepted for publication. As a service to our customers we are providing this early version of the manuscript. The manuscript will undergo copyediting, typesetting, and review of the resulting proof before it is published in its final citable form. Please note that during the production process errors may be discovered which could affect the content, and all legal disclaimers that apply to the journal pertain.
References
- 1.Brusilow SW, Maestri NE. Urea cycle disorders: diagnosis, pathophysiology, and therapy. Adv Pediatr. 1996;43:127–170. [PubMed] [Google Scholar]
- 2.Summar ML, Dobbelaere D, Brusilow S, Lee B. Diagnosis, symptoms, frequency and mortality of 260 patients with urea cycle disorders from a 21-year, multicentre study of acute hyperammonaemic episodes. Acta Paediatr. 2008;97:1420–1425. doi: 10.1111/j.1651-2227.2008.00952.x. [DOI] [PMC free article] [PubMed] [Google Scholar]
- 3.Tuchman M, Lee B, Lichter-Konecki U, Summar ML, Yudkoff M, Cederbaum SD, et al. Cross-sectional multicenter study of patients with urea cycle disorders in the United States. Molec Genetics Metab. 2008;94:397–402. doi: 10.1016/j.ymgme.2008.05.004. [DOI] [PMC free article] [PubMed] [Google Scholar]
- 4.Batshaw ML, Brusilow S, Waber L, Blom W, Brubakk AM, Burton BK, et al. Treatment of inborn errors of urea synthesis: activation of alternative pathways of waste nitrogen synthesis and excretion. N Engl J Med. 1982;306:1387–1392. doi: 10.1056/NEJM198206103062303. [DOI] [PubMed] [Google Scholar]
- 5.Enns GM, Berry SA, Berry GT, Rhead WJ, Brusilow SW, Hamosh A. Survival after treatment with phenylacetate and benzoate for urea-cycle disorders. N Engl J Med. 2007;356:2282–2292. doi: 10.1056/NEJMoa066596. [DOI] [PubMed] [Google Scholar]
- 6.Brusilow SW, Valle DL, Batshaw M. New Pathways of nitrogen excretion in inborn errors of urea synthesis. Lancet. 1979;314:452–4. doi: 10.1016/s0140-6736(79)91503-4. [DOI] [PubMed] [Google Scholar]
- 7.Brusilow SW. Phenylacetylglutamine may replace urea as a vehicle for waste nitrogen excretion. Pediatr Res. 1991;29:147–150. doi: 10.1203/00006450-199102000-00009. [DOI] [PubMed] [Google Scholar]
- 8.Brusilow SW, Finkelstein J. Restoration of nitrogen homeostasis in a man with ornithine transcarbamylase deficiency. Metabolism. 1993;42:1336–1339. doi: 10.1016/0026-0495(93)90135-b. [DOI] [PubMed] [Google Scholar]
- 9.Lee B, Rhead W, Diaz GA, Scharschmidt BF, Mian A, Shchelochkov O, et al. Phase 2 comparison of a novel ammonia scavenging agent with sodium phenylbutyrate in patients with urea cycle disorders: Safety, pharmacokinetics and ammonia control. Molecular Genetics & Metabolism. 2010;100:221–228. doi: 10.1016/j.ymgme.2010.03.014. [DOI] [PMC free article] [PubMed] [Google Scholar]
- 10.Lichter-Konecki U, Diaz GA, Merritt JL, II, Feigenbaum A, Jomphe C, Marier JF, et al. Ammonia control in children with urea cycle disorders (UCDs); Phase 2 comparison of sodium phenylbutyrate and glycerol phenylbutyrate. Molecular Genetics and Metabolism. 2011;103:323–329. doi: 10.1016/j.ymgme.2011.04.013. [DOI] [PMC free article] [PubMed] [Google Scholar]
- 11.McGuire BM, Zupanets IA, Lowe ME, Xiao X, Syplyviy VA, Monteleone J, et al. Pharmacology and Safety of Glycerol Phenylbutyrate in Healthy Adults and Adults with Cirrhosis. Hepatology. 2010;51:2077–2085. doi: 10.1002/hep.23589. [DOI] [PMC free article] [PubMed] [Google Scholar]
- 12.Diaz GA, Bartley J, Longo N, Berquist W, Feigenbaum A, et al. Phase 3 blinded, randomized, crossover comparison of sodium phenylbutyrate (NaPBA) and glycerol phenylbutyrate (GPB): Ammonia (NH3) control in adults with urea cycles disorders (UCDs) Mol Genet Metab. 2011;102:276. doi: 10.1016/j.ymgme.2011.04.013. (abstract; manuscript submitted) [DOI] [PMC free article] [PubMed] [Google Scholar]
- 13.Webster LT, Siddiqui UA, Lucas SV, Strong JM, Mieyal JJ. Identification of separate acyl- CoA:glycine and acyl-CoA:Lglutamine N-acyltransferase activities in mitochondrial fractions from liver of rhesus monkey and man. J Biol Chem. 1976;251:3352–3358. [PubMed] [Google Scholar]
- 14.Batshaw ML, MacArthro RB, Tuchman M. Alternative pathway therapy for urea cycle disorders: twenty years later. J of Pediatr. 2001;138:S46–S45. doi: 10.1067/mpd.2001.111836. [DOI] [PubMed] [Google Scholar]
- 15.Monteleone JPR, Mokhtarani M, Diaz GA, Rhead W, et al. Population PK analysis of glycerol phenylbutyrate (GPB) and sodium phenylbutyrate (NaPBA) in adult and pediatric patients with urea cycle disorders (UCD) Molec Genetics and Metab. 2012;105:343. (Abstract presented at the 2012 meeting of the Society For Inherited Metabolic Diseases in Charlotte, March 31 – April 3, 2012) [Google Scholar]
- 16.Comte B, Kasumov T, Pierce BA, Puchowicz MA, Scott ME, et al. Identification of phenylbuterylglutamine, a new metabolite of phenylbutyrate metabolism in humans. Journal of Mass Spectrometry. 2002;37:581–590. doi: 10.1002/jms.316. [DOI] [PubMed] [Google Scholar]
- 17.Kormanic K, Kang H, Cuebas D, Scharschmidt BF, Vockley J, Mohsen A-W. Role of medium chain acyl-CoA dehydrogenase in the metabolism of sodium phenylbutyrate. Molec Genetics and Metab. 2012;105:329. doi: 10.1016/j.ymgme.2012.10.009. (Abstract presented at the 2012 meeting of the Society For Inherited Metabolic Diseases in Charlotte, March 31 – April 3, 2012) [DOI] [PMC free article] [PubMed] [Google Scholar]
- 18.Moldave K, Meister A. Synthesis of phenylacetylglutamine by human tissue. J Biol Chem. 1957;229:463–76. [PubMed] [Google Scholar]
- 19.Thibault A, Samid D, Cooper MR, Figg WD, Tompkins AC, Patronas N, et al. Phase I study of phenylacetate administered twice daily to patients with cancer. Cancer Research. 1995;75:2932–2938. doi: 10.1002/1097-0142(19950615)75:12<2932::aid-cncr2820751221>3.0.co;2-p. [DOI] [PubMed] [Google Scholar]
- 20.Thibault A, Cooper M, Figg W, Venzon D, Sartor A, Tompkins A, et al. Phase I and Pharmacokinetic Study of Intravenous Phenylacetate in Patients with Cancer. Cancer Research. 1994;54:1690–1694. [PubMed] [Google Scholar]