Abstract
Background
The Distal Contractile Integral (DCI) is an index of contractile vigor in high-resolution esophageal pressure topography (EPT) calculated as the product of amplitude, duration, and span of the distal esophageal contraction. The aim of this study was to develop an automated algorithm calculating DCI.
Methods
DCI was calculated conventionally using ManoView™ software in EPT studies from 72 controls and 20 patients and compared to the calculation using a MATLAB™ ‘region growing’ algorithm. This algorithm first established the spatial limits of the distal contraction (the proximal pressure trough to either the distal pressure trough or to the superior margin of the lower esophageal sphincter at rest). Pixel-by-pixel horizontal line segments were then analyzed within this span starting at the pressure maximum and extending outward from that point. The limits of ‘region-growing’ were defined either by the spatial DCI limits or by encountering a pressure < 20 mmHg. DCI was then calculated as the total units of mmHg-s-cm greater than 20 mmHg within this domain.
Key Results
Excellent correlation existed between the two methods (r=0.98, p<0.001). DCI values obtained with the conventional calculation were slightly but significantly greater than with the region-growing algorithm. Differences were attributed to the inclusion of vascular pressures in the conventional calculation or to differences in localization of the distal limit of the DCI.
Conclusions & Inferences
The proposed region-growing algorithm provides an automated method to calculate DCI that limits inclusion of vascular pressure artifacts and minimizes the need for user input in data analysis.
Keywords: biomedical signal processing, esophageal manometry, esophageal pressure topography, region growing, distal contractile integral
INTRODUCTION
In high resolution esophageal pressure topography (EPT) the vigor of the distal esophageal contraction is characterized by its amplitude, duration, and vertical length (1–3). The resulting metric is termed Distal Contractile Integral (DCI) and calculated as the product of the mean amplitude of the contraction (excluding the 20 mmHg footprint) times its duration times its length between the proximal (P) pressure trough and either the distal (D) pressure trough or the proximal margin of the lower esophageal sphincter (LES). The DCI is expressed in units of mmHg-s-cm. In the Chicago Classification for esophageal motility disorders in EPT hypertensive peristalsis is defined as a mean DCI greater than 5,000 mmHg-s-cm in the context of normal contractile latency (2). An extreme phenotype of hypercontractility is defined by the presence of at least one test swallow resulting in a contraction with a DCI > 8,000 mmHg-s-cm (4). Consequently, the DCI is a fundamental parameter to identify hypertensive motility disorders in EPT.
The current method to calculate DCI consists of manually delineating a space-time box encompassing the distal esophageal contraction, calculating the average intraluminal pressure within that box and multiplying that value (less 20 mmHg) by the duration and the length of the box (2). Even if the calculation is automated with the software provided by the manufacturer this method requires user input to delineate the space-time box of interest. It may also lead to the inclusion of extraneous pressure signals within that box in the computation such as repetitive vascular artifacts that are separated from the major contractile complex.
Region-growing is an algorithmic method for image segmentation. This signal processing technique automatically extracts features from an image which are then further used for a variety of classification tasks (5). Basically, a point of interest is identified on the image based on a characteristic such as density and adjacent areas are then systematically interrogated to see if they also possess that characteristic. Region-growing has fairly wide applications in medical image analysis such as quantifying the size or volume of mass lesions in ultrasound or CT imaging (6–7). The application of region-growing to calculate DCI may provide an entirely automated method minimizing the need for user input and automatically excluding many pressure artifacts. The aim of this study was to develop and test an automatic region-growing algorithm for calculating DCI in clinical EPT studies.
SUBJECTS AND METHODS
Subjects
EPT studies of 72 healthy volunteers (40 males, mean age 27 years, range 19–48 years) were included in this analysis. Volunteers were recruited by advertisement or word of mouth and had no history of esophageal symptoms (heartburn, regurgitation, dysphagia), previous gastro-intestinal surgery, or significant medical illness. The study protocol was approved by the Northwestern University Institutional Review Board and informed consent was obtained from each subject.
Twenty patients (4 males, mean age 56 years, range 24–78) selected from a set of 2,000 clinical EPT studies were also studied. Patients with absent peristalsis or prior gastro-intestinal surgery were excluded. Patients were selected with the criterion that they exhibited at least one test swallow with a DCI (calculated with the software provided by the manufacturer) greater than 4,000 mmHg-s-cm but no swallow with a DCI greater than 10,000 mmHg-s-cm. The rationale for this criterion was for the selected studies to include at least one swallow with a DCI value close to the thresholds for defining hypertensive peristalsis and hypercontractility.
High Resolution Manometry (HRM) Protocol
HRM studies were done with a 4.2 mm outer diameter solid-state assembly with 36 circumferential sensors spaced at 1-cm intervals (Given Imaging, Los Angeles, CA). Before recording, transducers were calibrated at 0 and 300 mmHg using externally applied pressure. Studies were done in a supine position after at least a 6-hr fast. The manometry assembly was placed transnasally and positioned to record from the hypopharynx to the stomach with about 3 intra-gastric sensors. The catheter was fixed in place by taping it to the nose. The manometric protocol included a 5-min period to assess basal sphincter pressure and ten 5-ml water swallows.
DCI calculation with ManoView™ software
For each swallow, DCI was firstly calculated using ManoView™ software (Given Imaging, Los Angeles, CA). Instances of failed swallows were excluded. One reviewer manually delineated the proximal and distal limits of the space-time box for inclusion in the DCI. The proximal limit (P) was identified as the pressure minimum between the proximal and distal contraction or at the distal margin of the break in the 20-mmHg isobaric contour if a break was present. The distal limit of the space time box was either the distal pressure trough (D) or the proximal margin of the LES at 20 mmHg isobaric contour after the termination of the peristalsis, depending on whether or not a pressure minimum, D, was present. The DCI value was then calculated automatically by the software for each swallow.
DCI calculation with region-growing algorithm
The region-growing algorithm for DCI calculation was written in MATLAB™ (Version 6, 2000, The MathWorks Inc., Natick, MA, U.S.A.), a computer program customized for processing binary data. Manometric data were exported from ManoView™ into MATLAB™. Instances of failed peristalsis were excluded.
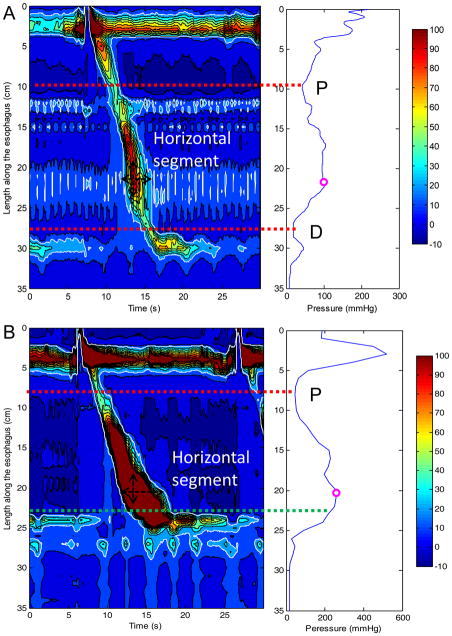
The logic of the region-growing algorithm was as follows. First, a maximal spatial pressure variation plot of the greatest contractile pressure at each locus along the esophagus was calculated to identify the spatial positions of P and D (if present) (8) (Figure 1). Specifically, the spatial position of P was located at the minimal pressure point between the proximal and the distal esophageal segments (upper red dotted horizontal line in Figure 1). The spatial position of D was located at the minimal pressure point between the distal esophagus and the proximal border of the EGJ (lower red dotted horizontal line in Figure 1A). If no minimal pressure point was identified between the distal esophagus and the EGJ, the distal limit was located at the proximal margin of the EGJ after the termination of peristalsis (lower green dotted horizontal line in Figure 1B). Secondly, pixel-by-pixel horizontal line segments were then analyzed for the segment spanning from P to the distal limit of the DCI region. The starting point for the “region-growing” algorithm was the maximal pressure point on the spatial pressure variation plot. The search was extended outward proximally and distally from that point. The limits of region-growing were defined by intersecting the proximal or distal limits of the region of interest or by encountering a pressure < 20 mmHg. Finally DCI was calculated as the volume of the defined pressure domain greater than 20 mmHg and expressed as mmHg-s-cm.
Figure 1.
Methodology for the location of proximal (P) and distal (D) pressure troughs. Panel A (left) represents a typical EPT plot for a swallow in a control subject. The 20-mmHg isobaric contour is identified by the white line. The corresponding maximal spatial pressure variation plot (right Panel A) depicts the greatest contractile pressure at each axial position along the esophagus. This plot is used for an automated localization of P and D. P is identified as the lowest pressure trough in the proximal esophagus (upper red dotted line) and D as the lowest pressure through in the distal esophagus (lower red dotted line). The location of the pressure maximum is also indicated. The region growing algorithm begins at the horizontal segment corresponding to the pressure maximum (black horizontal double arrow) and then extends proximally and distally from that segment (white dashed arrow). Panel B (left) represents the swallow of greatest DCI in a patient with the corresponding maximal pressure variation plot to the right. In this case, no pressure trough is identified in the distal esophagus and the upper margin of the esophagogastric junction (EGJ) represented by the green dotted line is instead used as the distal limit for the region growing algorithm.
Statistical Analysis
The mean DCI and the greatest individual DCI were given for each subject. Data were expressed as mean (± SD) and 5th, 25th, 50th, 75th and 95th percentiles. The paired t-test was used to compare the mean and the greatest DCI obtained from the 2 different methods of DCI calculation. Pearson’s correlation coefficient was also calculated to assess the relationship between the two DCI calculations.
RESULTS
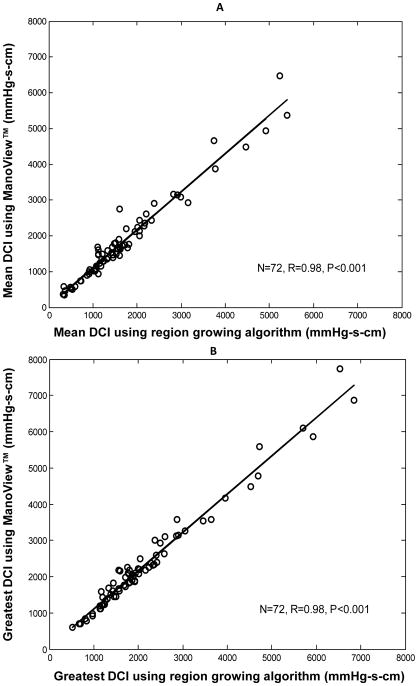
Table 1 summarizes the DCI data calculated using ManoView™ software and region growing algorithm for 72 controls. The values given by ManoView™ were significantly greater than those given by the region growing algorithm (p < 0.01 for mean DCI and for the greatest DCI). The mean differences between the 2 methods of calculation were 136 (± 232) and 174 (± 242) mmHg-s-cm for the mean and the greatest DCI respectively. The linear correlation was very strong between the two methods (r=0.98, p<0.001 for mean DCI and r=0.98, p<0.001 for greatest DCI, Figure 2).
Table 1.
Mean and greatest DCI values calculated using ManoView™ software and region-growing algorithm developed in MATLAB™ for 72 normal subjects.
| Percentiles | Mean ±SD | Range | |||||
|---|---|---|---|---|---|---|---|
| 5th | 25th | 50th | 75th | 95th | |||
| Mean DCI (mmHg-s-cm) | |||||||
| Region-growing algorithm | 381 | 1074 | 1455 | 2034 | 4391 | 1690±1092 | 324–5407 |
| ManoView™ | 512 | 1064 | 1600 | 2215 | 4649 | 1840±1190 | 343–6479 |
| Greatest DCI (mmHg-s-cm) | |||||||
| Region-growing algorithm | 806 | 1322 | 1815 | 2411 | 5605 | 2175±1337 | 518–6850 |
| ManoView ™ | 791 | 1446 | 2073 | 2613 | 5835 | 2350±1430 | 604–7732 |
Figure 2.
Correlation of DCI values calculated using ManoView™ software and region-growing algorithm for 72 control subjects. Data are presented for mean DCI in Panel A and for the greatest DCI in Panel B.
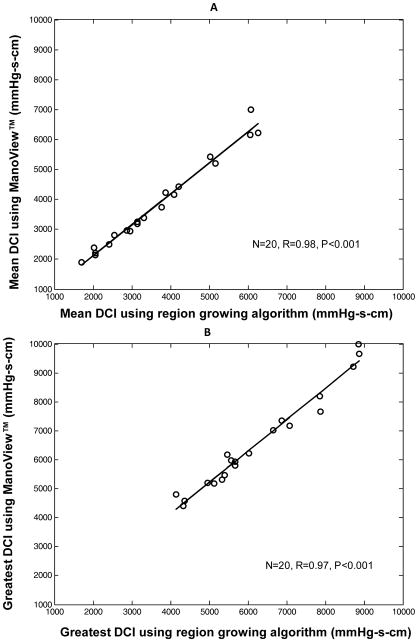
In the 20 patients selected because their EPT study contained a test swallow with DCI (calculated with ManoView™ software) between 4,000 and 10,000 mmHg-s-cm, the values given with ManoView™ were also greater (Table 2, p<0.01). The mean difference between the 2 methods was 323 (± 317) mmHg-s-cm. Figure 3 illustrates the very strong linear correlation between the 2 methods of calculation for these patients (r=0.97, p<0.001).
Table 2.
Greatest DCI values calculated using ManoView™; software and region-growing algorithm developed in MATLAB™ for 20 selected patients with a swallow of marginally abnormal DCI.
| Percentiles | Mean ±SD | Range | |||||
|---|---|---|---|---|---|---|---|
| 5th | 25th | 50th | 75th | 95th | |||
| Greatest DCI (mmHg-s-cm) | |||||||
| Region-growing algorithm | 4328 | 5233 | 5668 | 7461 | 8869 | 6242±1526 | 4141–8895 |
| ManoView ™ | 4485 | 5254 | 6090 | 7513 | 9828 | 6564±1677 | 4400–9990 |
Figure 3.
Correlation of DCI values calculated using ManoView™ software and region-growing algorithm for 20 patients with greatest DCI between 4,000 and 10,000 mmHg-s-cm. Data are presented for mean DCI in Panel A and for the greatest DCI in Panel B.
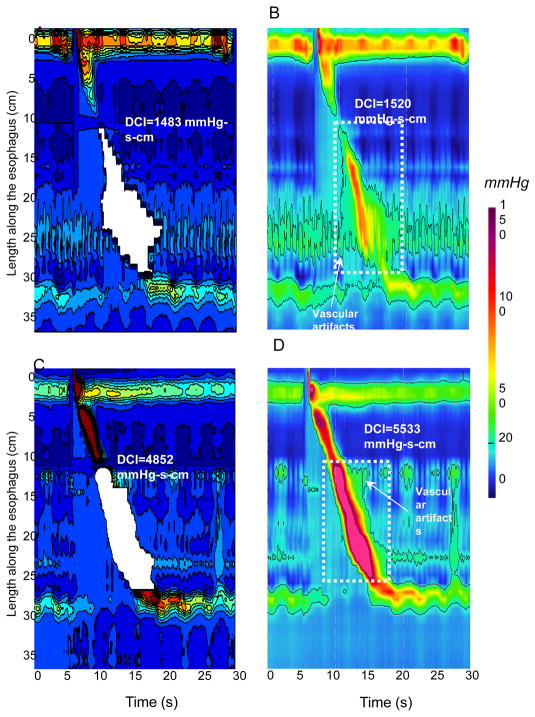
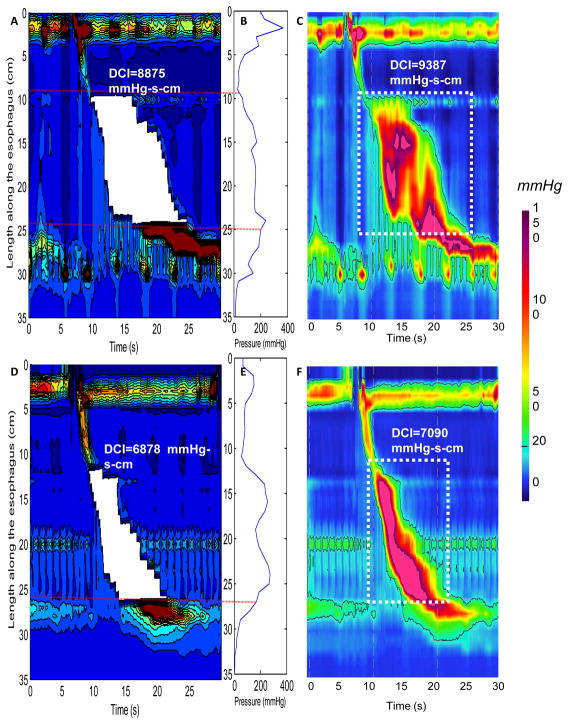
The region growing algorithm provided a lesser DCI value than the ManoView™ calculation in 59 control subjects (82%) and 18 patients (90%). Inclusion of pressures attributable to vascular pulsations in ManoView™ software calculation might explain some of this difference. The examples illustrated in Figure 4 demonstrate how the region-growing algorithm had the effect of excluding some vascular artifact from the calculation. Another source of discrepancy between methods was attributable to the location of distal limit for DCI calculation. This is illustrated in Figure 5 for 2 of the patients studied. From the maximal spatial pressure variation plots in panels B and E, it is evident that no pressure minima existed between the distal esophageal segment and the EGJ. In these cases, the proximal margin of the EGJ after the termination of peristalsis was utilized as the user-defined distal limit of DCI calculation.
Figure 4.
Examples of discrepancies attributable to vascular artifacts between the region-growing algorithm and ManoView™ software. The same swallow is depicted in MATLAB™ for the region growing algorithm (Panels A and C) and in ManoView™ (Panels B and D) for a normal swallow and for a borderline DCI swallow respectively. In Panels A and C the white area corresponds to the area of DCI calculation with the region-growing algorithm. In Panels B and D the white dotted boxes delineate space-time boxes for DCI calculation using ManoView™. Using the region growing algorithm the swallow presented in Panel C is considered as normal whereas the same swallow is classified as hypertensive using ManoView™ (Panel D).
Figure 5.
Examples of utilization of the proximal margin of the esophago-gastric junction (EGJ) after the end of peristalsis as distal limit for calculating DCI. Panels A and D show DCI values of two individual swallows from two patients calculated using the region-growing algorithm. The white areas correspond to the area of DCI calculation. Panels B and E represent the corresponding maximal spatial pressure variation plots for the EPT presented in Panels A and B, respectively. Panels C and F represent DCI calculation using ManoView™ for the same swallows presented in Panels A and B respectively. The space-time box in which DCI is calculated using ManoView™ is delineated by the white dotted lines.
DISCUSSION
We developed and tested an automated region-growing algorithm for calculating DCI in clinical EPT studies. DCI calculations in 72 normal subjects and 20 patients with a swallow characterized by a marginally abnormal DCI (between 4,000 and 10,000 mmHg-s-cm) demonstrated that the proposed automatic region-growing algorithm gave DCI values very similar to, although slightly less than using ManoView™ software. The magnitude of the differences was small and unlikely to be clinically relevant. Hence, the region growing algorithm described offers the advantages of minimizing the required user input for calculating DCI and of excluding vascular artifact from the calculation.
The method of DCI calculation presented in this study is rapid and automated, an adaptation of conventional region-growing methodology to the task of EPT interpretation. Conventional region-growing methods use pixels as the basic elements of regions (5–6). The algorithm proposed here uses horizontal line segments as the basic element of a region owing to the nature of how data are acquired in an HRM study. An added benefit of using line segments centered on the maximal pressure value in the distal segment is that it makes the calculation process faster (7). Key to the reproducibility of the DCI calculation is identifying the spatial limits to be included in the calculation. Because the DCI calculation excludes pressure below 20 mmHg, a fixed pressure threshold of 20 mmHg can be used as a uniform criterion for delineating the margins of line segments. Similarly, the proximal limit is readily identifiable as either the pressure minima, often referred to as the transition zone (9), or the point at which the pressure diminishes to 20 mmHg. The greatest potential for variability is in localization of the distal limit for the DCI calculation. In instance in which there is a pressure minimum between the distal contraction (the combination of S2 and S3 as defined by Clouse (10)), and the LES, this is straightforward. However, in instances such as illustrated in Figure 5 no such minima exists and the user-defined proximal margin of the LES (or EGJ) is alternatively used. Still, this is a point also used in delineating the proximal margin for the calculation of the Integrated Relaxation Pressure (IRP) so it does not add to the steps required of the user in the interpretation process.
Another advantage of the region-growing algorithm is the exclusion of pressure artifacts that occur either before or after the distal contraction. This could be of importance in instances of swallows with borderline abnormal DCI. Pressure artifacts encountered in EPT data are essentially usually attributable to cardiovascular pulsation from structures neighboring of the esophagus, especially in supine position (11). These pressure signals will be included in the DCI calculation with ManoView™ software as presented in Figure 4. Although some advanced signal processing techniques, such as empirical mode decomposition (12), wavelet decomposition (13) and adaptive and median filtering (14), have been shown to improve the quality of esophageal manometric data, an active interaction between the user processing the data and the computer program is required. The proposed region-growing algorithm does not require any prior information about the EPT data, and does not require any intervention by the person processing the data and can be implemented for on-line processing. Note, however, that although vascular signals separated from the main contractile complex by a pressure trough of less than 20 mmHg will automatically be excluded by the region growing algorithm those that are superimposed on it will necessarily be included. Similarly, although intrabolus pressure compartmentalized between the main contractile complex and the EGJ will be automatically excluded when less than 20 mmHg, this will be included in the calculation when greater than 20 mmHg, a condition that implies abnormal EGJ relaxation.
Finally normative data for DCI have been established using the calculation method included in the ManoView™ software calculation owing to the calculation methodology employed. Our results suggest a statistically significant difference between the values obtained with the 2 methods of calculation in control subjects. In theory the thresholds should be re-defined for the diagnosis of hypertensive peristalsis or hypercontractility in EPT using this new method of DCI calculation. However the differences are relatively small and probably not clinically relevant.
In conclusion, the proposed automated region-growing algorithm calculates DCI on EPT plots with minimal user input beyond what is already required to identify the timing of the test swallow and the localization of the sphincteric zones. The ability of the automated region-growing algorithm performed well compared to DCI calculation by an expert user utilizing ManoView™ software. As such, the algorithm described provides another building block for the automated analysis of EPT studies.
Acknowledgments
Funding: Supported by R01 DK56033 (PJK) and R01 DK079902 (JEP) from the Public Health Service
Abbreviations
- DCI
distal contractile integral
- EPT
esophageal pressure topography
- HRM
high-resolution manometry
- EGJ
esophago-gastric junction
Footnotes
AUTHOR CONTRIBUTIONS
Zhiyue Lin: Analysis and interpretation of data, drafting of the manuscript, approval of the final version
Sabine Roman: Analysis and interpretation of data, revising the manuscript critically, approval of the final version
John E. Pandolfino: Study concept and design, analysis and interpretation of data, approval of the final version
Peter J. Kahrilas: Study concept and design, revising of the manuscript critically, approval of the final version
COMPETING INTERESTS
ZL, JEP and PJK have no competing interest; SR has served as consultant for Given Imaging and Addex Pharma.
References
- 1.Ghosh SK, Pandolfino JE, Zhang Q, Jarosz A, Shah N, Kahrilas PJ. Quantifying esophageal peristalsis with high-resolution manometry: a study of 75 asymptomatic volunteers. Am J Physiol Gastrointest Liver Physiol. 2006;290:G988–997. doi: 10.1152/ajpgi.00510.2005. [DOI] [PubMed] [Google Scholar]
- 2.Pandolfino JE, Fox MR, Bredenoord AJ, Kahrilas PJ. High-resolution manometry in clinical practice: utilizing pressure topography to classify oesophageal motility abnormalities. Neurogastroenterol Motil. 2009;21:796–806. doi: 10.1111/j.1365-2982.2009.01311.x. [DOI] [PMC free article] [PubMed] [Google Scholar]
- 3.Pandolfino JE, Ghosh SK, Rice J, Clarke JO, Kwiatek MA, Kahrilas PJ. Classifying esophageal motility by pressure topography characteristics: a study of 400 patients and 75 controls. Am J Gastroenterol. 2008;103:27–37. doi: 10.1111/j.1572-0241.2007.01532.x. [DOI] [PubMed] [Google Scholar]
- 4.Roman S, Lin Z, Kwiatek MA, et al. Jackhammer esophagus: a symptomatic phenotype of hypertensive contraction in high resolution esophageal pressure topography (EPT) Gastroenterology. 2011;140:S-231. [Google Scholar]
- 5.Hojjatoleslami SA, Kittler J. Region growing: a new approach. IEEE Trans Image Process. 1998;7:1079–1084. doi: 10.1109/83.701170. [DOI] [PubMed] [Google Scholar]
- 6.Poonguzhali S, Ravindran G. A complete automatic region growing method for segmentation of masses on ultrasound images. Intl Conf on Biomedical and Pharmaceutical Engineering; 2006. pp. 88–92. [Google Scholar]
- 7.Yuch HY, Lin Z, Hu P. A fast algorithm for region growing and feature extraction. Journal of Dalian University of Technology. 1991;31:353–359. [Google Scholar]
- 8.Roman S, Lin Z, Pandolfino JE, Kahrilas PJ. Distal Contraction Latency: A Measure of Propagation Velocity Optimized for Esophageal Pressure Topography Studies. Am J Gastroenterol. 2011;106:443–451. doi: 10.1038/ajg.2010.414. [DOI] [PMC free article] [PubMed] [Google Scholar]
- 9.Ghosh SK, Janiak P, Schwizer W, Hebbard GS, Brasseur JG. Physiology of the esophageal pressure transition zone: separate contraction waves above and below. Am J Physiol Gastrointest Liver Physiol. 2006;290:G568–576. doi: 10.1152/ajpgi.00280.2005. [DOI] [PubMed] [Google Scholar]
- 10.Clouse RE, Staiano A. Topography of the esophageal peristaltic pressure wave. Am J Physiol. 1991;261:G677–684. doi: 10.1152/ajpgi.1991.261.4.G677. [DOI] [PubMed] [Google Scholar]
- 11.Babaei A, Mittal RK. Cardiovascular compression of the esophagus and spread of gastro-esophageal reflux. Neurogastroenterol Motil. 2011;23:45–51. e43. doi: 10.1111/j.1365-2982.2010.01606.x. [DOI] [PubMed] [Google Scholar]
- 12.Liang H, Lin QH, Chen JD. Application of the Empirical Mode Decomposition to the analysis of esophageal manometric data in gastroesophageal reflux disease. Conf Proc IEEE Eng Med Biol Soc. 2004;1:620–623. doi: 10.1109/IEMBS.2004.1403234. [DOI] [PubMed] [Google Scholar]
- 13.Najmabadi M, Devabhaktuni VK, Sawan M, Mayrand S, Fallone CA. A new approach to analysis and modeling of esophageal manometry data in humans. IEEE Trans Biomed Eng. 2009;56:1821–1830. doi: 10.1109/TBME.2009.2016976. [DOI] [PubMed] [Google Scholar]
- 14.Lin Z, Pandolfino JE, Kwiatek MA, Kahrilas PJ. Adaptative and median signal filtering to reduce vascular and respiration artifacts in high resolution esophageal pressure topography (HREPT) studies. Gastroenterology. 2010;138:S465. [Google Scholar]


