Abstract
Background
Cystic echinococcosis is a global parasitic disease caused by infection with Echinococcus granulosus larvae with potentially life-threatening complications in humans. To date, the status of the immune cells believed to be associated with the pathogenicity of E. granulosus infection has not been demonstrated clearly.
Methodology/Principal Findings
In this study, we developed a multiplex flow cytometry assay to investigate the systemic immune status of innate and adaptive immunity at 30, 180, 360 days post-infection (dpi) in mice infected with E. granulousus. At 30 dpi, an increase in the number of CD11b+ and CD11c+ antigen-presenting cells (APCs) was observed. This was accompanied by the slight down-regulated expression of the co-stimulatory molecule MHC-II, indicating the impairment of APCs in early infection through the release of secretory-excretory products. In all infected groups, we observed a significant increase in innate immune cells, including APCs and GR-1+ cells, and a dramatic increase in the myeloid-derived suppressor cells (MDSC) expressing CD11b+/GR-1+. Moreover, the upregulation of the activated markers CD69, CD44, CD40L, and the downregulation of CD62L were observed in the CD4+ and CD8+ T cells following infection. Regulatory T cells expressing CD4+/CD25+/FoxP3 + increased significantly over the course of infection.
Conclusions
Our findings demonstrate that the microenvironment in the peripheral immune system after E. granulosus infection changes in subtle but detectably ways, especially during the persistent period of infection. We found that T cells were activated following infection, but observed that the significant increase of immunosuppressive cells such as MDSC and Treg cells could inhibit T cell response to E. granulosus antigens. We suggest these cells may play a neglected but key role in the downregulation of the immune response in long-term parasitic infection. Understanding the basic functions and temporal interactions of these immunosuppressive cells will pave the way for new strategies of parasite vaccine design.
Introduction
Cystic echinococcosis (CE, or hydatid disease) is a chronic endemic helminthic disease caused by infection with metacestodes (larval stages) of the tapeworm Echinococcus granulosus, and is one of the most widespread zoonotic diseases in humans in both developing and developed countries [1], [2], [3]. The hydatid cysts of E. granulosus develop as unilocular fluid-filled bladders within the internal organs (mainly the liver and lungs) of humans and other intermediate hosts. Clinical symptoms are mild during the early stage of infection when the cysts are gradually growing. At later stages, however, the parasite may physically damage tissues and organs and cause them to become dysfunctional. The spontaneous or provoked rupture of a parasitic cyst can be fatal. In addition, anaphylactic reactions, including urticaria, edema, respiratory symptoms, and anaphylactic shock, are well documented for CE [4]. Existing data suggests that the status of innate and adaptive immune cells changes following infection and that these changes are closely related to the pathogenicity of the disease in humans. However, the status of the innate and adaptive immune cells and their contributions to E. granulosus cyst progression remains poorly understood. Elucidating the characteristics of these immune cells will help develop new strategies for treatments.
Previous studies have focused mainly on the Th2 cell responses and cytokine profiles following E. granulosus infection, as these benefit parasite growth and development [5]. The results of these studies show that later stages of the infection are characterized by more dominant Th2 activity with elevated IL-4 and IL-10 levels and reduced IFN-gamma output in ConA- and antigen-stimulated splenocytes [5]. The circumparasitic leucocytes produce mainly IL-10 at five months post-infection [6]. In addition, the E/S products released by the parasites play key roles in immune evasion [7], [8]. E. granulosus escapes the host's immunosurveillance by interfering with monocyte differentiation and by modulating dendritic cells (DC) maturation [7]. This observation has been confirmed by the induction of apoptosis in DC and CD4+ CD25+ FoxP3 + T cells using cestode E/S-products [8], which suggests an important role for parasite persistence during chronic echinococcosis. However, systematic studies of host immune responses following E. granulosus infection are still lacking, and therefore, little information is available regarding the nature of these responses.
In this study, we investigated several immune cell populations involved in both innate and adaptive host immunity at various times post-infection in mice infected with E. granulosus. We aimed to (i) characterize host immune responses during the development of E. granulosus cysts in intermediate hosts and (ii) determine the interaction between the parasite and its host.
Materials and Methods
Ethics statement
This study was carried out in strict accordance with the recommendations in the Guide for the Care and Use of Laboratory Animals of the National Institute of Parasitic Diseases, Chinese Center for Disease Control and Prevention. The protocol was approved by the Laboratory Animal Welfare & Ethics Committee (LAWEC), National Institute of Parasitic Diseases, Chinese Center for Diseases Control and Prevention (Permit Number: IPD 2011-006). All surgery was performed under sodium pentobarbital anesthesia, and all efforts were made to minimize suffering.
Mice, parasites and infection
Female Balb/c mice (aged 6 to 8 weeks) were purchased from the SLAC Laboratory (Shanghai, China) and were bred in the University facilities. The protoscoleces were obtained by aseptically puncturing the fertile bovine hydatid cysts according to protocols detailed in Baz et al. [9] and Andrew and John [10]. Briefly, the parasites were washed several times using phosphate buffered saline (PBS), pH 7.2, containing 1000 µg/mL penicillin and 1000 U/mL streptomycin (Invitrogen, Frederick, MD). The parasite vitality was determined by eosin exclusion [11]. Only parasite batches exhibiting over 90% vitality were used.
The Balb/c mice were inoculated intraperitoneally (in accordance with Araj et al. [12]) with 200 µL of a suspension containing 2000 live protoscoleces in PBS, whereas mice injected with 200 µL PBS were used as the controls. The mice were bred and housed normally until used for experimentation.
Preparation of cell suspensions
Single cell suspensions were prepared from the murine spleens and peripheral blood after 30, 180, 360 day post-infection (dpi) with E. granulosus protoscoleces. First, the peripheral blood was collected, and the anticoagulant heparin sodium was added. Next, the mice were sacrificed and were soaked in 75% alcohol for 2 minutes. Finally, the sterile spleens were collected and placed in a clean plate. After two washes with PBS, the splenocytes were squeezed using the plunger of a 5 mL syringe and were passed through a 200 µm cell strainer (BD Biosciences) into 50 mL centrifuge tubes. The cell precipitations were washed using PBS and were centrifuged at 1000 rpm for 5 min. The cell precipitations, including splenocytes and peripheral blood cells, were hemolyzed in a solution containing 0.15 mol/L NH4Cl, 1 mmol/L KHCO3, 0.1 mmol/L EDTA and H2O (pH 7.2) for 5 min and were washed in PBS. The samples were spun at 300×g, incubated with anti-CD16/32 Fc-receptor blocking antibody for 10 min and washed in FACS buffer (2% BGS, 0.1% NaN3 in PBS) before surface staining. In this study, we omitted density gradient or enzymatic digestion steps to avoid selection bias, the loss of cells, and the modification of surface marker expression or cell function.
Flow cytometry
The immune cells isolated from the mouse spleens or from the peripheral blood of mice were analyzed by flow cytometry. The spleen cells and the matched peripheral blood cells were harvested from infected and non-infected mice at different times post-infection. The aliquots of whole blood (100 µL), anticoagulated with EDTA, were incubated with the appropriate combinations of fluorescence-conjugated monoclonal antibodies. After lysing the erythrocytes with FACS lysing solution (BD Biosciences, Heidelberg, Germany), the cells were washed once in PBS (supplemented with 1% FCS and 0.2% NaN3) before assaying.
The cell suspensions were prepared in complete RPMI 1640. The non-specific binding sites were blocked for 30 min at 4°C using ice-cold PBS supplemented with 1% normal rat serum. After two washes, the cells were stained using the following anti-mouse antibodies: PerCP-CD8a (clone 53-6.7), FITC-CD4 (clone GK1.5), PerCP-Cy5.5–CD4 (clone GK1.5), APC-CD25 (clone PC61.5), PE-FoxP3 (clone MF-14), APC-IL-17R (clone PAJ-17R), FITC-CD11b (clone M1/70), PE-Ly-6G/Ly-6C (GR-1; clone R86-8C5), PE-CD40 (clone 3/23), Alexa Fluor 488-CD11c (clone N418), APC-I-A/I-E (MHC-II; clone M5/114.15.2), PE-CD3 (clone 17A2), and APC-CD45R/B220 (clone RA3-6B2). The antibodies were purchased from BD Biosciences (San Jose, CA). The anti-mouse CD69 PE (clone H1.2F3), CD154 APC (CD40L, clone MR1), CD44 APC (clone IM7), CD62L PerCP-Cy5.5 (clone MEL-14), was purchased from eBioscience (eBioscience, San Diego, CA). The incubation was performed for 30 min at 4°C. The CD4+ CD25+ FoxP3+ staining was performed according to the protocol provided in the Mouse Regulatory T cell staining Kit (eBioscience). The stained cells were analyzed on a FACS-Calibur SE flow cytometer (BD Biosciences). Prior to analysis, PI (propidiun iodide) was added to the cell suspensions to exclude the dead cells from the data acquisition. The data were analyzed using the FlowJo software package(Tree Star Inc., Stanford, USA).
Proliferation assay
T cell proliferation was measured as previously described [13]. Briefly, splenic mononuclear cells from infected or control mice were stimulated with 3.5 µg/mL conA (Sigma-Aldrich, USA) for three days. After that, CCK-8 (10 µL/well) was added 4 h before harvesting. Data are the mean cpm ± SD of triplicate wells. Proliferation index was calculated as: cpm (conA stimulated group)/cpm (untreated group).
Statistical analysis
Statistical analyses were performed using SPSS version 16.0 (Statistical Package for Social Sciences, Chicago, IL). Statistical significance was determined using Student's t-test and differences were considered statistically significant at P<0.05.
Results
We found no significant differences in immune responses among the control groups of mice of different ages indicating that the spleen and peripheral blood content can be regarded as relatively stable under unchallenged conditions. Therefore, the untreated animals were used as baseline controls to calculate the P-values.
Regulation of MHC-II expression in antigen presenting cells following infection
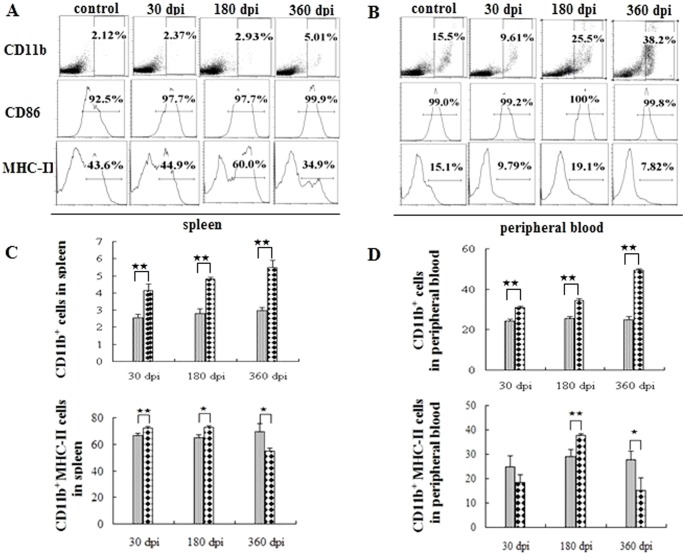
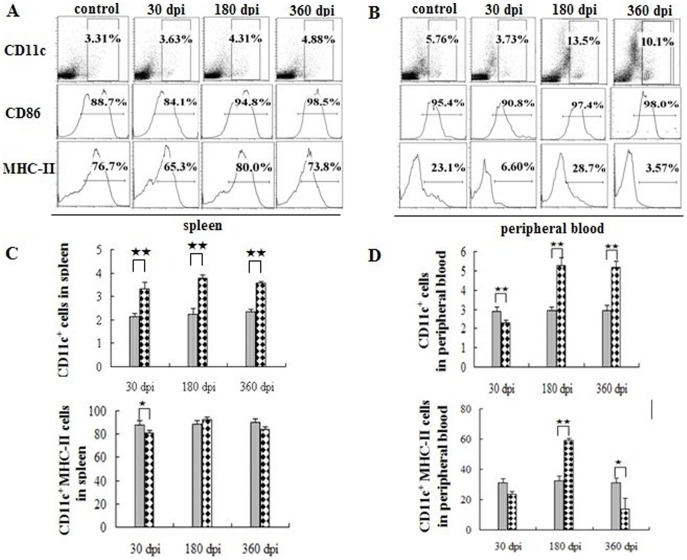
Initially, we determined the antigen presenting cells (APCs) and the expression of the surface markers. The number of CD11b+ and CD11c+ cells in the peripheral immune system gradually increased post-infection (Fig. 1, Fig. 2). The CD86 expressed in these cells was also up-regulated following infection (Fig. 1A, 1B and Fig. 2A, 2B, middle). The expression of MHC-II in APCs showed a dramatic fluctuation in peripheral blood. In the spleen, more than 80% of the APCs cells expressed MHC-II over the entire course of the infection (Fig. 1C, 2C, lower). There was an up-regulation of MHC-II expression in the CD11b+ cells at 30 dpi and 180 dpi, however, the expression was apparently down-regulated at 360 dpi (Fig. 1C and 1D, left). Nevertheless, it exhibited the highest percentage of CD11b+ cells among the three groups. The fluctuation of the CD11c+ cells, which was similar to that seen for CD11b+ cells, exhibited an apparent increase post-infection (Fig. 2C and 2D). In the peripheral blood, MHC-II expression in APCs was apparently down-regulated at 30 dpi and 360 dpi, but there was a significant increase observed at 180 dpi (Fig. 1D and Fig. 2D).
Figure 1. CD11b+ macrophages in the peripheral immune system post-infection.
Proportion of CD11b+ cells in the spleen (A) and in the peripheral blood (B) in one of the six mice at 30, 180, 360 days post-infection (dpi). The age-matched control data are not shown in full because the levels are similar. Proportion of CD11b+ cells (C), CD11b+ MHC-II (D) in the peripheral immune system. The ash lattice pillars and the black lattice pillars represent the control and infected groups respectively. Plotted data are means ± SD of six mice. ★, P<0.05; ★★, P<0.01.
Figure 2. CD11c+ dentritic cells in the peripheral immune system post-infection.
Proportion of CD11c+ cells in the spleen (A) and in the peripheral blood (B) in one of the six mice at 30, 180, 360 dpi. The age-matched control data are not shown in full. Proportion of CD11c+ cells (C) and CD11c+ MHC-II (D) in the peripheral immune system. The ash lattice pillars and the black lattice pillars represent the control and infected groups respectively. Plotted are means ± SD of six mice. ★, P<0.05; ★★, P<0.01.
T cells were activated following infection
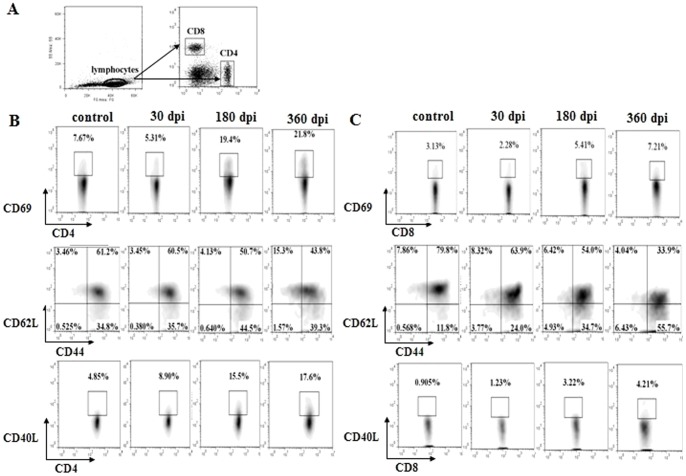
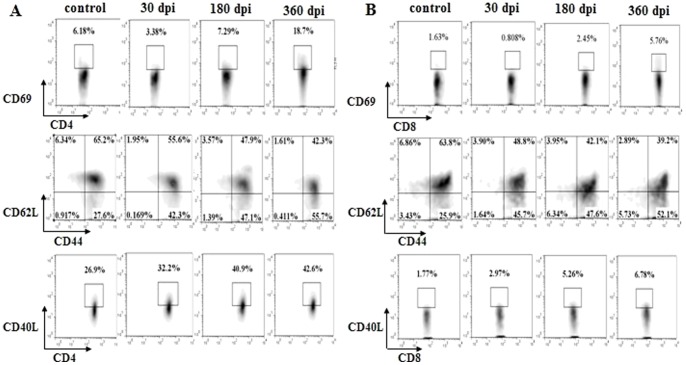
The number of T cells increased gradually following infection, although the infected spleens were not enlarged (data not shown). To determine whether the T cells were activated following infection, we stained the T lymphocytes for the expression of the activation markers CD69 [14], CD44/CD62L [15], CD40L [16]. The expression of CD69 in the CD4+ and CD8+ T cells was much lower at 30 dpi, however, a significant increase in expression levels was observed at 180 and 360 dpi (Fig. 3B, 3C and Fig. 4A, 4B, upper). The expression of CD44 and CD40L in the CD4+ and CD8+ T cells was gradually up-regulated post-infection, while the expression of CD62L was down-regulated (Fig. 3B, 3C, Fig. 4A, 4B, middle and lower). These data demonstrated that the T cells were activated following infection.
Figure 3. T cell activation in the spleen post-infection.
(A) The gating strategies used for T cell activation analysis. (B) Proportion of CD4+/CD69+, CD4+/CD44+/CD62L+, CD4+/CD40L+ T cells in the spleen in one of the three mice at 30, 180, 360 dpi. (C) Proportion of CD8+/CD69+, CD8+/CD44+/CD62L+, CD8+/CD40L+ T cells in the spleen in one of the three mice at 30, 180, 360 dpi. The age-matched control data are not shown in full.
Figure 4. T cell activation in the peripheral blood post-infection.
(A) Proportion of CD4+/CD69+, CD4+/CD44+/CD62L+, CD4+/CD40L+ T cells in the peripheral blood in one of the three mice at 30, 180, 360 dpi. (B) Proportion of CD8+/CD69+, CD8+/CD44+/CD62L+, CD8+/CD40L+ T cells in the peripheral blood in one of the three mice at 30, 180, 360 dpi. The age-matched control data are not shown in full. The gating strategies used for T cell activation analysis in the peripheral blood are the similar with Fig. 3A.
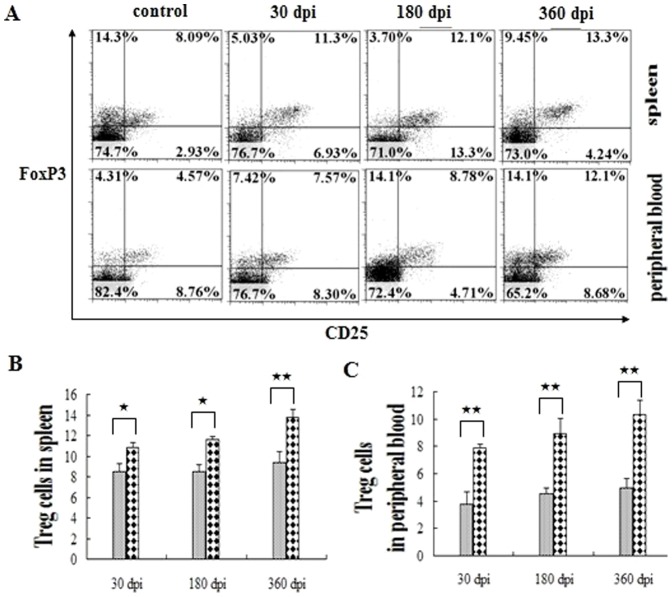
Meanwhile, we investigated the CD4+ CD25+ FoxP3 + T cells (regulatory T cells, Tregs) in the peripheral immune system (Fig. 5). The ratio of Tregs maintained a significantly higher level than that of the control group throughout the experiment, revealing their important role in suppressing the T cell activation post-infection (Fig. 5).
Figure 5. Regulatory T cells in the peripheral immune system post-infection.
(A) Proportion of Treg cells in the peripheral immune system. The comparison of Treg cells in the spleen and peripheral blood in six mice are shown in (B) and (C), respectively. The ash lattice pillars and the black lattice pillars represent the control and infected groups respectively. The data represent the means ± SD of six mice. ★, P<0.05; ★★, P<0.01.
Accumulation of myeloid-derived suppressor cells following infection
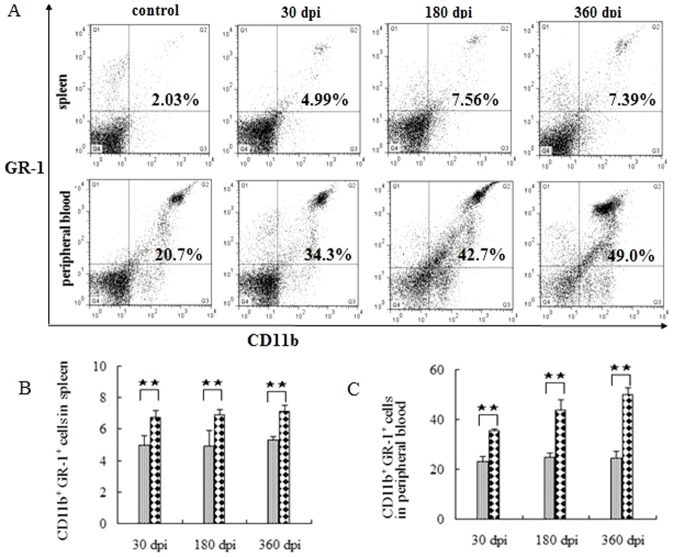
In addition, the myeloid-derived suppressor cells (MDSC), defined as CD11b+ GR-1+ cells that contribute to tumor evasion, were investigated. The level of GR-1+ cells decreased at 30 dpi, but returned to normal levels at 180 dpi, and was significantly higher than in the control group (data not shown). The MDSC levels increased significantly following infection, especially in the peripheral blood (Fig. 6), demonstrating that MDSC plays an important role in the parasitic immune evasion through unknown mechanisms.
Figure 6. MDSC in the peripheral immune system post-infection.
(A) Proportion of MDSC in one of the six mice at 30, 180, 360 dpi. The data showing the MDSC in the aged-matched controls are not shown in full because the levels are similar in every group. The comparison of MDSC in the spleen and peripheral blood are shown in (B) and (C), respectively. The data represent the means ± SD for six mice. ★, P<0.05; ★★, P<0.01.
The proliferation of T cells was significantly inhibited following infection
To clarify the implications of the peripheral activation of splenocytes following infection, we performed functional stimulation tests. Proliferation assays using conA as stimulus revealed a significant decline in the proliferation index of splenic T-cells from infected spleens compared with control mice (Fig. 7). However, the ability of T cell proliferation was restored gradually post-infection (Fig. 7), suggesting T cell activation in the persistent period infection. In turn, this finding confirmed the vigorous inhibition of T cell response induced by immunosuppressive cells following infection.
Figure 7. Splenocyte proliferation post-infection.
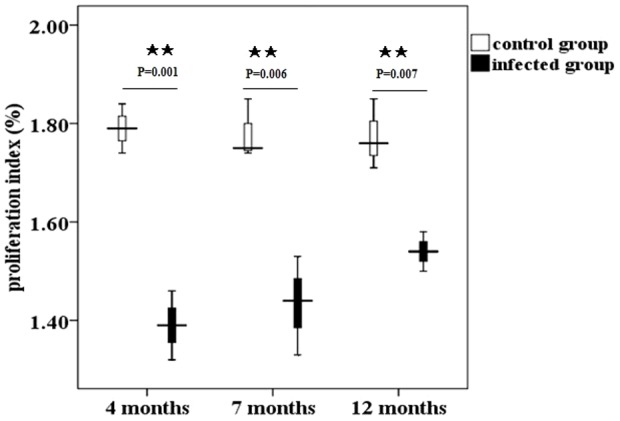
Proliferation index of splenocytes from mice at four, seven, and twelve months post- infection measured by CCK-8 kit. The data represent the means ± SD for triplicate wells. ★, P<0.05; ★★, P<0.01.
Discussion
Using multiplex flow cytometry, we described the key events in the cellular immune infiltration and activation following E. granulosus protoscoleces infection in Balb/c mice. We observed subtle changes in the microenvironments of both the spleen and the peripheral blood, including the infiltration and activation of innate APCs. In addition, we demonstrated for the first time the sequential activation of T lymphocytes and the accumulation of MDSC. Moreover, we observed a decrease in the proliferation index of splenic T cells stimulated with ConA, which reveals the vigorous suppressive effects induced by groups of suppressive cells in the peripheral system following infection.
In this study, we found that E. granulosus infection influenced the expression of MHC-II in the APCs and observed that the expression of MHC-II in the APCs declined at 30 dpi. There are several possible explanations for these observations. With the protoscoleces intrusion, the APCs were mobilized to present parasitic antigens, which could partly explain the APC depletion. In addition, E/S products released during the early period of infection can inhibit the activation of APCs and even cause apoptosis [8], which may mediate early immunosuppression. However, the immunosuppressive mechanisms have been established in the persistent period. At 180 dpi, the expression of MHC-II in the APCs was restored to normal levels. The fluctuation of MHC-II expression levels in the APCs demonstrates the complexity of the regulatory mechanisms that occur during the course of persistent infection. It is likely that the parasitic infection does not impair the expression of CD86 in the APCs because the up-regulation of CD86 in the APCs was observed in the infected groups.
The effect of anti-parasite immunity depends on the activation status of the T-lymphocytes. Naïve T cells are commonly characterized by the surface expression of L-selectin (CD62L) and the absence of the activation markers CD44, CD69 [15]. Naïve T cells can respond to novel pathogens that the immune system has not yet encountered. Recognition by a naïve T cell clone of its cognate antigen results in the initiation of an immune response. In turn, this results in the T cell acquiring an activated phenotype, which is indicated by the up-regulation of surface makers CD25+, CD44+, CD69+ and may further differentiate into a memory T cell [17]. Our results revealed that T cells were activated post-infection. Understanding why they could not eliminate the parasite infection through the host immune response requires further investigation. Han et al (2008) reported that CD69+ CD4+ CD25− cells can suppress the host immune response to tumor cells [18]. The mechanism involves the inhibition of T cell activation through the TGF- beta pathway. Consistent with this observation, a high expression of TGF-beta is induced in E. granulosus-infected patients [19], [20]. It is possible that the CD69+ CD4+ CD25− T cells play an immunosuppressive role in anti-parasite immunity. Meanwhile, consistent with other research work, increased levels of Treg cells have been found in CE patients [19] and in infected mice, revealing a role for Tregs in immune suppression in E. granulosus infection.
MDSC are a heterogeneous population of immature myeloid cells that consists of myeloid progenitors and precursors of DC, macrophages, granulocytes and myeloid cells [21]. Many studies have demonstrated that MDSC play key roles in the inhibition of anti-tumor immunity [22]–[24] through a variety of mechanisms including nutrient starvation [25], the generation of reactive oxygen and nitrogen species (ROS and RNOS) [26], [27], and the induction of regulatory T cells [28], [29]. There are few reports of MDSC in parasitic infections, such as Schistosoma [30]–[32], Leishmania donaovani [33], [34], and Toxoplasma gondii [35]–[37]. However, the MDSC-like cells in Schistosoma mansoni or Leishmania donaovani infections have not been well defined. Recent evidence in Toxoplasma gondii demonstrated that CD11b+ GR-1+ (CD11c− Mac3 lo) monocytic cells suppress the proliferation of ConA-stimulated lymphocytes [34], however, the mechanism of lung infiltration remains uncertain [35]. Therefore, the investigation of the importance of MDSC in parasitic immune evasion appears to have been neglected. In this study, the expression level of MDSC gradually increased throughout the course of the infection and was significantly higher during chronic infection. This high percentage of MDSC in the peripheral immune system demonstrates the importance of the cells in the immune response. However, to determine whether MDSC play key roles in immunosuppression during long-term infection with E. granulosus will require further investigation.
The peripheral microenvironment changed subtly following infection, although apparent pathological changes were not observed. However, under certain circumstances, the changes observed could pose a deadly threat to human. First, CE patients often manifest anaphylaxis [4]. The symptoms of anaphylaxis occur partly because of allergens in the cyst fluid, such as EgEF-1b/d [36], AE21 [37] and EgTeg [38]. In this study, E. granulosus infection did not induce apparent inflammation (data not shown). Instead, E. granulosus infection induced chronic inflammation including the infiltration of T lymphocytes, an increase numbers in APCs and GR-1+ granulocytes, and the accumulation of MDSC in the peripheral immune system. It is likely that vigorous immune responses could occur if the immune cells encounter parasitic antigens after a second exposure. In addition, neutrophils, which are known inducers of allergic reactions, represent a high percentage of the MDSC [39], [40], which contributes to a higher incidence of anaphylaxis in CE patients. Secondly, the immunosuppressive microenvironment post-infection often increases the chance of secondary pathogenic infections in the host. Therefore, disease progression is aggravated because the increased immunosuppressive cells can significantly decrease the protective immune response to a number of pathogens. Collectively, these changes contribute to pathogenetically relevant events.
Conclusions
In this study, we developed a multiplex flow cytometry assay to investigate the status of innate and adaptive immunity at various times following E. granulosus infection in mice. Our data demonstrated subtle but detectable differences in the peripheral microenvironment post-infection and revealed that complex molecular networks were involved in the immune regulation. At 30 dpi, an increase in the number of APCs was observed accompanied by the down-regulated expression of the co-stimulatory molecule MHC-II, indicating the impairment of the APCs early in infection through the release of E/S products. Our study also demonstrates for the first time that MDSC, immunosuppressive cells exhibiting anti-tumor immunity increase significantly during persistent infection with E. granulosus. T cells were activated following infection, however, the significant increase in immunosuppressive cells such as MDSC and Treg cells could inhibit T cell response to E. granulosus antigens. Understanding the basic functions and temporal interactions of these immunosuppressive cells will pave the way for new strategies of parasite vaccine design.
Acknowledgments
We would like to thank Professor Hao-Bing Zhang and Chong-Shan Liu for providing Balb/c mice infected by E. granulosus with protoscoleces.
Funding Statement
The study was supported by grants from the National Natural Science Foundation No. 30872212 (JC), 30901354(HZ), the National S & T Major Program No. 2012ZX10004-201 and 2009ZX10004-201(JC). The funders had no role in study design, data collection and analysis, decision to publish, or preparation of the manuscript.
References
- 1. Carmena D, Sánchez-Serrano LP, Barbero-Martínez I (2008) Echinococcus granulosus infection in Spain. Zoonoses Public Health 55: 156–165. [DOI] [PubMed] [Google Scholar]
- 2. Battelli G (2009) Echinococcosis: costs, losses and social consequences of a neglected zoonosis. Vet Res Commun 33: 47–52. [DOI] [PubMed] [Google Scholar]
- 3. Hotez PJ, Savioli L, Fenwick A (2012) Neglected tropical diseases of the Middle East and North Africa: review of their prevalence distribution, and opportunities for control. PLoS Negl Trop Dis 6: e1475. [DOI] [PMC free article] [PubMed] [Google Scholar]
- 4. Vuitton DA (2004) Echinococcosis and allergy. Clin Rev Allergy Immunol 26: 93–104. [DOI] [PubMed] [Google Scholar]
- 5. Amri M, Mezioug D, Touil-Boukoffa C (2009) Involvement of IL-10 and IL-4 in evasion strategies of Echinococcus granulosus to host immune response. . Eur.Cytokine Netw 20: 63–68. [DOI] [PubMed] [Google Scholar]
- 6. Rogan MT (1998) T–cell activity associated with secondary infections and implanted cysts of Echinococcus granulosus in BALB/c mice. Parasite Immunol 20: 527–533. [DOI] [PubMed] [Google Scholar]
- 7. Riganò R, Buttari B, Profumo E, Ortona E, Delunardo F, et al. (2007) Echinococcus granulosus antigen B impairs human dendritic cell differentiation and polarizes immature dendritic cell maturation towards a Th2 cell response. Infect Immun 75: 1667–1678. [DOI] [PMC free article] [PubMed] [Google Scholar]
- 8. Justin KN, Katrien P, Manfred BL, Klaus B (2012) Excretory/secretory-products of Echinnoccus multilocularis larvae induce apoptosis and tolerogenic properties in dendritic cells in vitro. PLoS Negl Trop Dis 6: e1516. [DOI] [PMC free article] [PubMed] [Google Scholar]
- 9. Baz A, Hernández A, Dematteis S, Carol H, Nieto A (1995) Idiotypic modulation of the antibody response to Echinococcus granulosus antigens. Immunology 84: 350–354. [PMC free article] [PubMed] [Google Scholar]
- 10. Macintyre AR, Dixon JB (2001) Echinococcus granulosus: regulation of leukocyte growth by living protoscoleces from horses, sheep, and cattle. Exp Parasitol 99: 198–205. [DOI] [PubMed] [Google Scholar]
- 11. Robinson RD, Arme C (1985) Echinococcus granulosus: failure of eosin-exclusion test to demonstrate death of protoscoleces. Ann Trop Med Parasitol 79: 117–123. [DOI] [PubMed] [Google Scholar]
- 12. Araj GF, Matossian RM, Frayha GJ (1977) The host response in secondary hydatidosis of mice. I. Circulating antibodies. Z Parasitenkd 52: 23–30. [DOI] [PubMed] [Google Scholar]
- 13. Janson PC, Winerdal ME, Marits P, Thorn M, Ohlsson R, et al. (2008) FOXP3 promoter demethlation reveals the committed Treg population in humans. PLoS ONE 3: e1612. [DOI] [PMC free article] [PubMed] [Google Scholar]
- 14. Yamashita I, Nagata T, Tada T, Nakayama T (1993) CD69 cell surface expression identifies developing thymocytes which audition for T cell antigen receptor-mediated positive selection. Int Immunol 5: 1139–1150. [DOI] [PubMed] [Google Scholar]
- 15. De Rosa SC, Herzenberg LA, Roederer M (2001) 11-color, 13-parameter flow cytometry: identification of human naïve T cells by phenotype, function, and T-cell receptor diversity. Nat Med 7: 245–8. [DOI] [PubMed] [Google Scholar]
- 16. Schonbeck U, Libby P (2001) The CD40/CD154 receptor/ligand dyad. Cell Mol Life Sci 58: 4–43. [DOI] [PMC free article] [PubMed] [Google Scholar]
- 17. Takada K, Jameson SC (2009) Naïve T cell homeostasis: from awareness of space to a sense of place. Nat Rev Immunol 9: 823–32. [DOI] [PubMed] [Google Scholar]
- 18. Han Y, Guo Q, Zhang M, Chen Z, Cao X (2009) CD69+ CD4+ CD25− T cells, a new subset of regulatory T cells, suppress T cell proliferation through membrane-bound TGF-beta-1. J Immunol 182: 111–120. [DOI] [PubMed] [Google Scholar]
- 19.Tuxun T, Wang JH, Lin RY, Shan JY, Tai QW, et al. (2012) Th17/Treg imbalance in patients with liver cystic echinococcosis. Parasite Immunol Jul 16 .doi: 10.1111/j.1365-3024.2012.01383.x. [DOI] [PubMed] [Google Scholar]
- 20. Mezioug D, Touil Boukoffa C (2009) Cytokine profile in human hydatidosis: possible role in the immunosurveillance of patients infected with Echinococcus granulosus . Parasite 16: 57–64. [DOI] [PubMed] [Google Scholar]
- 21. Gabrilovich DI, Nagaraj S (2009) Myeloid-derived suppressor cells as regulators of the immune system [J]. Nat Rev Immunol 93: 162–174. [DOI] [PMC free article] [PubMed] [Google Scholar]
- 22. Srivastava MK, Zhu L, Harris-White M, Kar U, Huang M, et al. (2012) Myeloid suppressor cell depletion augments antitumor activity in lung cancer. PLoS ONE 7: e40677. [DOI] [PMC free article] [PubMed] [Google Scholar]
- 23. Watanabe S, Deguchi K, Zheng R, Tamai H, Wang LX, et al. (2008) Tumor-induced CD11b+ Gr-1+ myeloid cells suppress T cells sensitization in tumor-draining lymph nodes. J Immunol 181: 3291–3300. [DOI] [PubMed] [Google Scholar]
- 24. Kusmartsev S, Gabrilovich DI (2006) Role of immature myeloid cells in mechanisms of immune evasion in cancer. Cancer Immunol Immunother 55: 237–245. [DOI] [PMC free article] [PubMed] [Google Scholar]
- 25. Kusmartsev S, Nefedova Y, Yoder D, Gabrilovich DI (2004) Antigen-specific inhibition of CD8+ T cell response by immature myeloid cells in cancer is mediated by reactive oxygen species. J Immunol 172: 989–999. [DOI] [PubMed] [Google Scholar]
- 26. Rodríguez PC, Ochoa AC (2008) Arginine regulation by myeloid derived suppressor cells and tolerance in cancer: mechanisms and therapeutic perspectives. Immunol Rev 222: 180–91. [DOI] [PMC free article] [PubMed] [Google Scholar]
- 27. Youn JI, Nagaraj S, Collazo M, Gabrilovich DI (2008) Subsets of myeloidderived suppressor cells in tumor-bearing mice. J Immunol 181: 5791–802. [DOI] [PMC free article] [PubMed] [Google Scholar]
- 28. Serafini P, Mgebroff S, Noonan K, Borrello I (2008) Myeloid-derived suppressor cells promote cross-tolerance in B-cell lymphoma by expanding regulatory T cells. Cancer Res 68: 5439–49. [DOI] [PMC free article] [PubMed] [Google Scholar]
- 29. Delano MJ, Scumpia PO, Weinstein JS, Coco D, Nagaraj S, et al. (2007) MyD88-dependent expansion of an immature GR-1+ CD11b+ population induces T cell suppression and Th2 polarization in sepsis. J Exp Med 204: 1463–1474. [DOI] [PMC free article] [PubMed] [Google Scholar]
- 30. Guilliams M, Movahedi K, Bosschaerts T, Vanden-Driessche T, Chuah MK, et al. (2009) IL-10 dampens TNF/inducible nitric oxide synthase-producing dendritic cell-mediated pathogenicity during parasitic infection. J Immunol 182: 1107–118. [DOI] [PubMed] [Google Scholar]
- 31. Alvarez-Silva M, da Silva LC, Borojevic R (1993) Cell membrane-associated proteoglycans mediate extramedullar myeloid proliferation in granulomatous inflammatory reactions to schistosome egg. J Cell SCi 104: 477–484. [DOI] [PubMed] [Google Scholar]
- 32. Dutra HS, El-Cheikh MC, Azevedo SP, Rossi MI, Borojevic R (1998) Murine schistosomiasis mansoni: experimental analysis of bone marrow and peripheral myelopoiesis. Parasitol Res 84: 668–675. [DOI] [PubMed] [Google Scholar]
- 33. Cotterell SE, Engwerda CR, Kaye PM (2000) Leishmania donovani infection of bone marrow stromal macrophages selectively enhances myelopoiesis, by a mechanism involving GM-CSF and TNF-alpha. Blood 95: 1642–1651. [PubMed] [Google Scholar]
- 34. Cotterell SE, Engwerda CR, Kaye PM (2000) Enhanced hematopoietic activity accompanies parasite expansion in the spleen and bone marrow of mice infected with Leishmania donovani . Infect Immun 68: 1840–1848. [DOI] [PMC free article] [PubMed] [Google Scholar]
- 35. Voisin MB, Buzoni-Gatel D, Velge-Roussel F (2004) Both expansion of regulatory GR-1+ CD11b+ myeloid cells and anergy of T lymphocytes participate in hyporesponsiveness of the lung-associated immune system during acute toxoplasmosis. Infect Immun 72: 5487–5492. [DOI] [PMC free article] [PubMed] [Google Scholar]
- 36. Dunay IR, Damatta RA, Fux B, Presti R, Greco S, et al. (2008) GR-1+ inflammatory monocytes are required for mucosal resistence to the pathogen Toxoplasma gondii . Immunity 29: 306–317. [DOI] [PMC free article] [PubMed] [Google Scholar]
- 37. Colebrook AL, Jenkins DD, Lightowlers MW (2002) Anti-parasitic effect of cyclosporine A on Echinococcus granulosus and characterization of the associated cyclophilin protein. Parasitology 125: 485–493. [DOI] [PubMed] [Google Scholar]
- 38. Ortona E, Margutti P, Delunardo F, Vaccari S, Riganno R, et al. (2003) Molecular and immunological characterization of the C-terminal region of a new Echinococcus granulosus heat shock protein 70. Parasite Immunol 25: 119–126. [DOI] [PubMed] [Google Scholar]
- 39. Vuitton DA, Bresson-Hadni S, Delabrousse E, Mantion GA (2004) Liver and parasitic diseases. Gastroenterol Clin Biol 28: 1122–37. [DOI] [PubMed] [Google Scholar]
- 40. Panopoulos AD, Watowich SS (2008) Granulocyte colony-stimulating factor: molecular mechanisms of action during steady state and ‘emergency’ hematopoiesis. Cytokine 42: 277–288. [DOI] [PMC free article] [PubMed] [Google Scholar]


