

Abstract
Background
Current guidelines recommend minimally invasive breast biopsy (MIBB) as the “gold standard” for the diagnosis of breast lesions. The purpose of this study was to describe geographic patterns and time trends in the use of MIBB in Texas.
Methods
We used 100% Texas Medicare claims data (2000–2008) to identify women ≥66 years who underwent breast biopsy. Biopsies were classified as open or minimally invasive (MIBB). Time trends, racial/ethnic variation, and geographic variation in the use of biopsy techniques were examined.
Results
A total of 87,165 breast biopsies were performed on 75,518 breast masses in 67,582 women. 65.8% of the initial biopsies were MIBB. Radiologists performed 70.3% and surgeons 26.2% of MIBB. Surgeons performed 94.2% of open biopsies. Hispanic women were less likely to undergo MIBB (55.9%) compared to white (66.6%) and black (68.9%) women (p<0.0001). Women undergoing MIBB were also more likely to live in metropolitan areas and have higher income and educational levels (p<0.0001). The rate of MIBB increased from 44.4% in 2001 to 79.1% in 2008 (p<0.0001). There are clear geographic patterns in MIBB use with highest use near major cities. While rates are increasing overall, rates of improvement in the use of MIBB vary significantly across geographic regions and remain persistently low in more rural areas.
Conclusion
Despite an increase in the use of MIBB over time, MIBB use was consistently lower than recommended. We must identify specific barriers in rural areas to effectively change practice and achieve the statewide goal of 90% MIBB.
Keywords: breast cancer, breast mass, core biopsy, minimally invasive breast biopsy
INTRODUCTION
Over the past decade, improvements in both early detection and treatment have led to steady declines in breast cancer mortality rates.1,2 For both suspicious lesions found on mammography and palpable breast masses, biopsy is essential to establish a diagnosis of breast cancer thus allowing timely treatment. Historically, open surgical biopsies such as incisional and excisional biopsies were performed for definitive diagnosis.
Minimally invasive breast biopsy (MIBB) includes fine needle aspiration (FNA) and core needle biopsies with or without image guidance and/or vacuum assistance. MIBB is as accurate as open biopsy for the diagnosis of malignancy, particularly when combined with image guidance and vacuum assistance.3–5 Additionally, MIBB allows for preoperative multidisciplinary consultation.4 As use of MIBB increased, there has been a concomitant decrease in the number of surgical procedures, decreased time between diagnosis and definitive treatment, improved resource utilization, and decreased overall costs compared to open biopsy.4,6–11 Lastly, improved cosmetic outcome and better pain control with MIBB may lead to improved patient satisfaction.12
In 2001, 2005, and 2009, expert consensus panels comprised of an international, interdisciplinary group of physicians specializing in the diagnosis and treatment of breast disease endorsed MIBB as the new “gold standard” diagnostic modality for breast masses.4,13,14 The American Society of Breast Surgeons, the American College of Radiology, and the National Cancer Center Network (NCCN) have since followed suit in this recommendation.15–17 Although open biopsies may still be required or preferred in certain situations, the 2009 consensus statement and NCCN have set target rates of less than 5–10% for these more invasive procedures.4,17
Despite the benefits associated with MIBB, both single-institution and population-based studies have reported rates of open biopsy are as high as 20–30%, exceeding current recommendations.4,6,18–22 The purpose of our study was to use 100% Medicare claims data to describe trends in the use of MIBB in Texas from 2001–2008, concurrent with the consensus statements. Specifically, we examined geographic and racial/ethnic variation in overall use and rates of adoption of MIBB as the preferred modality over time. Our hypothesis was that MIBB would be similarly underutilized in Texas, as reported in other population-based studies.6,10,19,21,22 Our goal was to better understand the geographic, racial/ethnic, and socioeconomic patterns and trends in use of MIBB in order to determine barriers to achieving the goal of >90% MIBB rates.
METHODS
The study was determined to be exempt from review by the UTMB Institutional Review Board.
Data Source
We used the claims and enrollment data for 100% of Medicare beneficiaries in Texas for the period 2000–2008. The Denominator File provided demographic and enrollment information for each beneficiary, including beneficiary unique identifier, state and county codes, zip code, date of birth, date of death, sex, race, age, monthly entitlement indicators (Part A/B/Both), and reasons for entitlement. The Part D Denominator File (2006–2008) was used to obtain an enhanced race/ethnicity designation based on first and last name algorithms.23 Beneficiaries who did not have Part D data available (n = 4,533) were assigned race based on the Medicare enrollment race variable. We used the outpatient Standard Analytic File (SAF), which contains claims submitted by institutional outpatient providers, and the Carrier SAF, which contains claims submitted by non-institutional providers (physicians), to identify outpatient facility services and physician services. Line HCFA Provider Specialty Codes, which link the types of providers and suppliers who are eligible to apply for enrollment in the Medicare program with the appropriate Health Care Provider Taxonomy Codes, were used to identify provider specialty. Inpatient hospital admissions and claims data were obtained from the Medicare Provider Analysis and Review files. U.S. Census data for the year 2000 provided zip code-level education and population estimates. Zip-code level income was obtained from the 2006 Zip Code Tabulation Area population estimations produced by the Dartmouth Atlas of Health Care.
Study Cohort
We used Medicare claims and enrollment data for all minimally invasive and open breast biopsies performed between 2001 and 2008 using Current Procedural Terminology (CPT) codes. The CPT codes are shown in Table 1 and the cohort selection is summarized in Figure 1. During the time period a woman may have had more than one breast mass and/or more than one biopsy on the same mass. Therefore, we considered each unique breast mass an “episode” of care. This was done in order to identify the first biopsy received for evaluation of a suspicious lesion and is the unit of analysis for the study. An episode consists of one or more biopsies occurring on the same breast within 6 months of the first biopsy. A biopsy performed on the opposite breast or any biopsy performed more than 6 months after the first biopsy was defined as a separate episode. The final cohort included 75,518 episodes (87,165 total biopsies) and 67,582 patients (Figure 1 and Table 2).
Table 1.
Initial Biopsy Modality (N=75,518)
| CPT code | Procedure | % within each modality (MIBB or Open) |
|---|---|---|
| MIBB | N=49,653 (65.8% of first biopsies) | |
| FNA | ||
| 10021 | Fine needle aspiration; not using imaging guidance | 3.8% |
| 10022 | Fine needle aspiration; using imaging guidance | 4.1% |
| Core biopsy | ||
| 19100 | Breast biopsy; percutaneous, needle core, not using imaging guidance | 9.1% |
| 19102 | Breast biopsy; percutaneous, needle core, using imaging guidance | 37.3% |
| 19103 | Biopsy of breast; percutaneous, automated vacuum assisted or rotating biopsy device, using imaging guidance | 45.7% |
| OPEN | N=25,865 (34.2% of first biopsies) | |
| 19101 | Breast biopsy; open, incisional | 9.1% |
| 19120 | Excision of cyst, fibroadenoma, or other benign or malignant tumor, aberrant breast tissue, duct lesion, nipple or areolar lesion, open, one or more lesions | 44.1% |
| 19125 | Excision of breast lesion identified by preoperative placement of radiological marker, open; single lesion | 46.8% |
FNA = fine needle aspiration, MIBB = minimally invasive breast biopsy, CPT = Common Procedural Terminology
CPT codes 10021 and 10022 identify FNA done for any reason. In order to identify those done specifically for breast lesions, we chose only those associated with a diagnosis of breast mass, benign or malignant (174.0 – 174.9, 217, 233.0, 238.3, 239.3, 610.0 – 610.9, 611.0 – 611.9).
Figure 1.
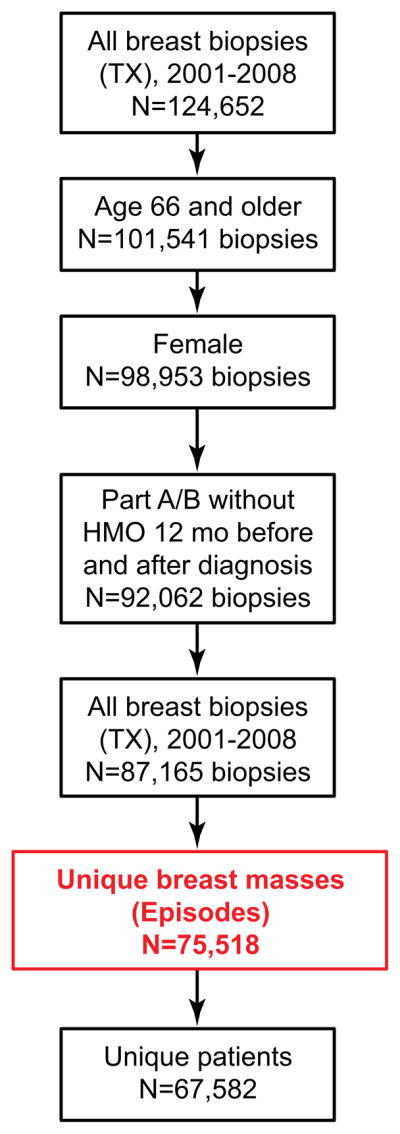
Cohort selection. Biopsies were categorized into unique “episodes” of care in order to identify the first biopsy received for evaluation of a suspicious lesion, and to establish the unit of analysis for the study. An episode consists of one or more biopsies occurring on the same breast within 6 months of the first biopsy. A biopsy performed on the opposite breast or any biopsy performed more than 6 months after the first biopsy was defined as a separate episode. The final cohort included 75,518 episodes (87,165 total biopsies) and 67,582 patients. The episode (or unique breast mass) is the unit of analysis.
Table 2.
Use of Minimally Invasive Breast Biopsy as First Biopsy within an Episode by Patient Characteristics
| MIBB N (%) | Open Biopsy N (%) | P-value | |
|---|---|---|---|
| All Episodes | 49,653 (65.8) | 25,865 (34.2) | |
| Mean Age (±SD) | 74.3 ± 6.3 | 74.2 ± 6.2 | |
| Age Group | 0.34 | ||
| 66–74 | 28,138 (65.6) | 14,752 (34.4) | |
| 75+ | 21,515 (65.9) | 11,113 (34.1) | |
| Race/Ethnicity | <0.0001 | ||
| White | 40,710 (66.6) | 20,416 (33.4) | |
| Black | 4,095 (69.0) | 1,842 (31.0) | |
| Hispanic | 4,285 (55.9) | 3,386 (44.1) | |
| Other | 534 (72.5) | 202 (27.5) | |
| Breast Cancer Diagnosis after biopsy | <0.0001 | ||
| Yes | 26,077(69.1) | 11,650 (30.9) | |
| No | 23,576 (62.4) | 14,215 (37.6) | |
| Quartile of Median Income (lowest to highest) | <0.0001 | ||
| Q1 | 11,169 (58.5) | 7,915 (41.5) | |
| Q2 | 11,992 (63.3) | 6,964 (36.7) | |
| Q3 | 12,535 (66.1) | 6,438 (33.9) | |
| Q4 | 13,949 (75.4) | 4,543 (24.6) | |
| Education (lowest to highest) | <0.0001 | ||
| Q1 | 10,988 (59.4) | 7,503 (40.6) | |
| Q2 | 11,341 (62.5) | 6,812 (37.5) | |
| Q3 | 12,142 (67.5) | 5,845 (32.5) | |
| Q4 | 13,208 (74.7) | 4,474 (25.3) | |
| Size of MSA | <0.0001 | ||
| ≥1 million | 28,510 (73.6) | 10,233 (26.4) | |
| 250,000 to <1 million | 4,406 (51.5) | 4,155 (48.5) | |
| >10,000 to <250,000 | 7,946 (63.2) | 4,633 (36.8) | |
| ≤10,000 | 8,791 (56.2) | 6844 (43.8) |
Study Outcomes
We examined the first biopsy for each episode of care. Biopsies were classified as either minimally invasive breast biopsy (MIBB) or open biopsy. CPT codes were used to identify each biopsy type (Table 1). MIBB included fine needle aspiration (FNA) and core needle biopsies. CPT codes 10021 and 10022 identify FNA done for any reason. Therefore, in order to identify FNAs done specifically for breast lesions, we chose only those associated with a diagnosis of breast mass, benign or malignant (International classification of disease (ICD-9) diagnosis codes 174.0 – 174.9, 217, 233.0, 238.3, 239.3, 610.0 – 610.9, 611.0 – 611.9). The use of image guidance and vacuum assistance technologies in MIBB was also examined (Table 1). Open surgical procedures included incisional and excisional biopsies.
Study Variables
Age was categorized as 66–74 and 75+ years. Race categories included white, black, Hispanic, and other. Median income and education levels (percentage of individuals with less than 12 years of education) at the zip code level were stratified into quartiles.
Metropolitan Statistical Area (MSA) is a classification given to regions with a core area containing a substantial population nucleus with adjacent surrounding communities that have a high degree of economic and social integration with the core area. Defined by the US Office of Management and Budget, an MSA contains a core urban area of 50,000 or more population. There are 25 MSAs in Texas. MSAs were categorized as small (<250,000 population), medium (250,000–1 million population), and large (≥1 million population). The remaining people lived in micropolitan service areas, metropolitan divisions, or combined statistical areas with 10,000 of fewer core population or smaller.24
To evaluate geographic variation in the use of MIBB we use the Hospital Service Area (HSA). HSAs are local health care markets for hospital care. The Dartmouth Atlas research group defines HSAs by aggregating Medicare claims records at the zip code level to determine service areas where a hospital or group of hospitals provides a preponderance of care.25 There are 208 HSAs in Texas.
We examined the specialty of physicians performing the initial biopsy. We also identified the specialty of the first physician a woman saw for a diagnosis of breast mass. In 40,560 of the 75,518 episodes, we were able to identify a physician visit for a diagnosis of breast mass in the 6 months prior to the biopsy claim. In the remaining patients, the breast biopsy claim was not preceded by a physician visit for breast mass. We speculate that the latter group had a higher percentage of biopsies done for abnormalities on screening mammography and therefore, no previous visit for breast mass. When a physician visit was identified, provider specialty was classified using Line HCFA Provider Specialty Codes: radiologist (codes 30, 47, 94), surgeon (02, 24, 33, 49, 77, 91), internal medicine/primary care physician (01, 08, 11, 38, 50, 97), obstetrics and gynecology (09, 15, 16), or oncologist (excluding surgical oncologist, 83, 90, 92) other (all remaining codes, mid-level providers in “other” category). Code 47 was for “independent diagnostic testing facility” and was included in the radiologist group, while 49 was for ambulatory surgery center and was included in the surgeon group. Women with a diagnosis of breast cancer or ductal carcinoma-in-situ (ICD-9 codes 233.0 or 174) in the year following the initial biopsy were classified as having breast cancer.
Statistical Analysis
Descriptive statistics were used to examine the overall use of MIBB and open biopsies during an episode, MIBB as the initial biopsy of an episode, type of MIBB technique, and the use of image guidance and vacuum assistance. Chi-square tests were used to compare use of MIBB and open biopsy by patient characteristics (age, race/ethnicity, cancer diagnosis, quartiles of income, quartiles of education, and size of MSA where treatment was received). To determine independent predictors of receipt of MIBB, we used generalized mixed linear models with general estimating equations (GEE) for parameter estimation. This was done to account for multiple episodes resulting in clusters of correlated data from each subject. Significant two-way interactions between variables were included in the final model. A Cochran-Armitage test for trend was used to examine time trends in use of MIBB techniques and MIBB use by race/ethnicity and socioeconomic status. Geographic variation in the use of MIBB as the initial biopsy of an episode was examined across HSAs in Texas, both for the overall study period and for 2001–2004 vs. 2005–2008.
All analyses were performed with SAS version 9.2 (SAS Inc., Cary, NC, USA). Statistical significance was accepted at the p<0.05 level.
RESULTS
Distribution of Patients, Episodes, and Biopsies
75,518 episodes of care (unique breast masses) were identified in 67,582 women between 2001 and 2008. Across episodes a total of 87,165 biopsies were performed. The number of overall biopsies performed in Texas ranged from a minimum of 9,831biopsies in 2001 to a maximum of 11,964 in 2003, with no clear time trend. Most patients (89.6%) had only one episode during the study period, with 9.2% of patients having two and 1.2% having three or more episodes. Only one biopsy was performed in 86.4% of episodes, two biopsies in 12.1% and three or more biopsies in 1.6% of episodes. At the time of the defined episodes, the mean age was 74.3 +/− 6.3 years (SD). For the 75,518 episodes, 56.8% of patients in the overall cohort were 66 to 74 years old, and 80.9% were white, 7.9% were black, and 10.2% were Hispanic. Most patients lived in MSAs with a population greater than one million (51.3%), while 11.3% lived in MSAs with a population of 250,000 to one million, and 16.7% lived in MSAs with 10,000 to 250,000 population, and 20.7% in non-metropolitan service areas with a population less than 10,000.
Overall Use of MIBB Techniques
Within the 75,518 episodes, 43,684 episodes had a MIBB only (57.8%), 25,576 had an open biopsy only (33.8%), and 6,258 had both (8.3%). In the patients who had both, MIBB was done as the first modality in 95.4%. For the first biopsy of each episode, 49,653 were MIBB (65.8%) and 25,865 (34.2%) were open (Table 1). Among MIBB, core needle biopsy (including non-image guided, image guided, and vacuum assisted) was used in 92.1% of women (Table 1). Fine needle aspiration, both with and without image guidance, was used least often during the study period. Image guidance (FNA, core, or vacuum assisted) was used in 87.1% of minimally invasive biopsies and vacuum assistance in 45.7% (Table 1).
Description of the Cohort and Rates of Biopsy Use by Patient Characteristics (Table 2)
In a bivariate analysis, age was not a predictor of MIBB. The percentage of patients undergoing MIBB was lower in Hispanic women (55.9%) compared to white (66.6%) and black women (68.9%, p<0.0001). Women living in areas with higher income, higher education levels, and in the most populous MSAs were likely to undergo MIBB (p<0.0001 for all). Patients who had an ultimate diagnosis of breast cancer were more likely to have undergone MIBB compared to those who did not have a cancer diagnosis (69.1% vs. 62.4%; p<0.0001). In 375 women who had an ultimate diagnosis of breast cancer, the initial open biopsy appeared to be the definitive procedure, as these women had no other breast operation.
In a multivariate model, the same factors independently predicted receipt of MIBB (Table 3). As education and income were highly correlated, education only was included in the final model. There was a significant interaction between race/ethnicity and MSA as well as race/ethnicity and education.
Table 3.
Multivariate Model: Factors Predicting Receipt of MIBB*
| FACTOR (reference group) | OR | 95% Confidence Interval |
|---|---|---|
| Year of diagnosis (per year) | 1.22 | 1.21–1.23 |
| Age (per year) | 1.00 | 0.99–1.00 |
| Race/Ethnicity | ||
| White (Hispanic) | 1.25 | 1.18–1.32 |
| Black (Hispanic) | 1.38 | 1.28–1.50 |
| Other (Hispanic) | 1.35 | 1.12–1.61 |
| Breast Cancer Diagnosis after biopsy (benign) | 1.32 | 1.27–1.36 |
| Education quartile (compared to lowest Q1) | ||
| Quartile 2 (Q1) | 1.07 | 1.02–1.12 |
| Quartile 3 (Q1) | 1.17 | 1.12–1.23 |
| Quartile 4 (Q1) | 1.45 | 1.37–1.52 |
| Size of MSA | ||
| ≥1 million (≤10,000) | 1.92 | 1.83–2.01 |
| 250,000 to <1 million (≤10,000) | 0.85 | 0.80–0.91 |
| >10,000 to <250,000 (≤10,000) | 1.24 | 1.17–1.31 |
Main effects shown in this table. Interactions between race/ethnicity and MSA, and MSA and education were significant and are included in the model.
Time trends In the Use of MIBB
The rate of MIBB as the initial biopsy in an episode of care increased every year from 44.4% in 2001 to 79.1% in 2008 (Figure 2; p<0.0001). Increasing year of diagnosis was an independent predictor of MIBB use (Table 3, OR 1.22 (per increasing year), 95% confidence interval 1.21–1.23). This was largely due to increases in the use of core needle biopsy from 44.4% of all biopsies in 2001 to 74.2% in 2008. FNA use was relatively stable and less than 7% across the time period. The use of image guidance with MIBB increased from 72.5% to 94.1% and the use of vacuum assistance increased from 40.0% to 54.6% between 2001 and 2008 (p<0.0001 for both trends).
Figure 2.

The percent of all initial biopsies performed as MIBB by year in Texas (p<0.0001). The timeline for major consensus recommendations for MIBB shown along the x-axis.
The rate of MIBB increased over time for each racial/ethnic group (p<0.0001 for all, Figure 3A), but the disparity between Hispanic women and other racial/ethnic groups remained throughout the study period. Likewise, the use of MIBB increased over time across the income (Figure 3B) and education (Figure 3C) quartiles, but disparities persisted. In no racial, education, or income group did MIBB rates exceed the recommended 90% even at the end of the time period.
Figure 3.

The percent of all initial biopsies performed as MIBB by: A) race and year, B) income and year, and C) education and year (p<0.0001 for all trends).
Geographic Analysis (Figures 4 and 5)
Figure 4.

A. The percent use of MIBB in Texas from 2001–2008 by Hospital Service Area. B. The Hispanic population as a percent of the total population by county in Texas. The national mean percent Hispanic population is 16.3%
Figure 5.

The percent use of MIBB in Texas for periods: A. 2001–2004 and B. 2005–2008.
For the time period of our study, Figure 4A illustrates the use of MIBB as the initial biopsy in an episode of care in Texas by Hospital Service Area. There was a wide range of MIBB use across HSAs, ranging from 20.6% to 89.1%. HSAs including major metropolitan areas (Houston, Austin, San Antonio, Dallas) and/or major medical centers (Lubbock, Midland, Odessa, Waco) had the highest rates of MIBB usage during the study period. Given the disparities in MIBB we found in Hispanic women we also show a map of the Hispanic population as a percent of the total population by county in Texas26 to visually correlate Hispanic density with receipt of MIBB (Figure 4B). 37,132 episodes occurred in HSAs with >70% MIBB rates (Figure 4A). In these higher use HSAs, Hispanic disparities still existed, with Hispanic women undergoing MIBB 73.4% of the time compared to 77.1%, 77.7%, and 79.5% for whites, blacks, and other racial/ethnic groups (p<0.0001).
In major cities with percentages of Hispanic patients above the national average of 16.3%, rates of MIBB were as high as major cities with smaller relative Hispanic populations. Despite similar racial/ethnic make up, rates of MIBB in border counties varied significantly by HSA, consistent with previous documented geographic variation in health care utilization.27 For example, the HSA including McAllen, known for high per capita Medicare spending, had <40% MIBB rates while El Paso, known for low spending, had >70% MIBB rates despite a similar proportion of Hispanic patients.
Figure 5(A and B) illustrates the change in MIBB use over time (2001–2004 vs. 2005–2008). Between the two time periods shown, there was an overall increase in the use of MIBB. However, rates of improvement in MIBB were variable, with the majority of areas around large cities improving to >70% but inconsistent improvement in rural areas. For example, rates of MIBB remained at <40% in McAllen and Harlingen, but increased in Brownsville (immediately adjacent to McAllen) and El Paso over the time period. In 2001–2004, only 0.5% of HSAs met the 90% MIBB benchmark. This improved to only 4.8% in 2005–2008.
Provider Patterns
For the first biopsy in each episode, 35,380 (49.5%) were performed by surgeons and 35,238 (47.0%) by radiologists, with the remaining biopsies done by a variety of specialists including gynecologists, oncologists, and primary care physicians. Of the 49,653 MIBBs, 70.3% were performed by radiologists and 26.2% by surgeons. Surgeons performed 94.2% of the 25,865 open biopsies during the study period (p<0.0001), with others being done by internists/primary care physicians (2.2%), radiologists (2.1%) and a variety of other physicians. In 40,560 of 75,518 episodes, there was a documented physician visit for a primary diagnosis of breast mass prior to first biopsy (Table 4). Episodes for which we documented a visit prior to first breast biopsy had a lower rate of MIBB (52.6%) than episodes for which we could not document a pre-biopsy visit (81.0%, P<0.0001). For episodes with a documented pre-biopsy visit, the first physician seen for a breast mass was a surgeon in 46.1%, internist/primary care physician in 35.3%, non-surgical oncologist in 9.4%, gynecologist in 6.9%, and other in 2.3%. Women with breast masses who presented to oncologists were the most likely to undergo MIBB (66.7, P<0.0001) as the first diagnostic procedure, compared to OB/GYN (58.6%), Internal Medicine/Primary Care (58.4%), or surgery (44.1%, p<0.0001).
Table 4.
Biopsy Rates based on Pre-Biopsy Physician Visit Specialty Typea
| Initial Biopsy following PhysicianVisit N=40,560a | ||
|---|---|---|
|
| ||
| Provider Typeb | MIBB N (%) | Open N (%) |
| Surgeon | 8,244 (44.1) | 10,451 (55.9) |
| Internal Medicine/PCP | 8,370 (58.4) | 5,955 (41.6) |
| Gynecologist | 1,635 (58.6) | 1,157 (41.4) |
| Oncologist | 2,541 (66.7) | 1,270 (33.3) |
Women seeing a physician for breast mass prior to biopsy claim (N=40,560).
p<0.0001
DISCUSSION
Our study is the first to examine MIBB rates in Texas and to describe associated geographic patterns that will enable us to better understand the barriers to achieving the 2009 consensus statement target of >90% MIBB rates for patients presenting with palpable breast masses and/or suspicious mammographic abnormalities.4 In Texas, between 2001 and 2008, only 65.8% of all initial biopsies for new breast lesions were MIBB. The largest increase in MIBB rates occurred in the first two years (2001–2002), which corresponded with the issuing of the 2001 consensus statement advocating the use of MIBB. Despite the increase in MIBB over time, in 2008 only 79% women underwent MIBB as the initial biopsy procedure for newly diagnosed breast mass or mammographic abnormality. Racial/socioeconomic disparities persisted, with Hispanics and patients with lower socioeconomic status being less likely to undergo a MIBB. Even in the later time period, only 4.8% of 208 HSAs in Texas met the 90% MIBB target rate.
The geographic patterns identified in our study may be the next step in understanding the barriers to achieving the higher rates of MIBB. Texas has the largest rural population in the U.S.,28,29 the greatest number of uninsured patients,30 no ethnic majority, and the largest Hispanic population in the U.S.26 HSAs including major metropolitan areas (Houston, Austin, San Antonio, Dallas) and/or major medical centers (Lubbock, Midland, Odessa, Waco), which have been shown to be associated with higher MIBB rates,6,22 had the highest rates of MIBB during the study period. Patients in rural areas may have limited access to MIBB technology, poor physician/patient education regarding changing standards of care, reduced access to health care in general, and a greater proportion of minority patients10,22 and patients with lower socioeconomic status.31
While rates of MIBB increased in Hispanic patients over time, disparities persisted, with Hispanic women being less likely than white or black women to undergo MIBB. Even in HSAs with >70% MIBB use, Hispanic patients were less likely to get MIBB. This may represent differential access to care, and different patient preferences and tumor/imaging characteristics in Hispanic women. While our study population represents a uniformly insured patient population, differential access may still be problematic. Similar to other disease processes, it is possible that Hispanic women cluster within physicians that are less likely to perform screening32 or refer for MIBB. In addition, especially in rural areas, these women may be less likely to receive regular primary care or screening mammography and may present at a later stage with palpable masses, where open biopsy may be more appropriate. The underuse of MIBB in Hispanic across HSAs likely contributes to the failure to achieve >90% MIBB rates. However, this is not the entire explanation, since MIBB in other racial groups are still <90%, even in the HSAs achieving >70% MIBB rates.
The inconsistent improvement in the use of MIBB across geographic regions with similar demographic make up suggest that, in addition to tumor characteristics (presence of a palpable mass) and patient preference (desire removal of palpable mass), physician preference and practice patterns may contribute to underuse of MIBB. Consistent with previous documented geographic variation in health care utilization across Texas,27 HSAs with reported high per capita Medicare spending (McAllen) had the lowest rates of cost-effective MIBB, and areas known for low spending (El Paso) had the highest rates, suggesting that underuse of MIBB may be related to lack cost-effective health care provision in certain regions.
While a recent single-institution interdisciplinary breast center reported a 97% rate of MIBB,12 similar results are not being achieved in the general population. Our findings are consistent with previous population-based studies. A recent Florida population-based study evaluated over 172,000 breast biopsies done for benign or malignant disease.6 Out of all biopsies, approximately 30% were done open. MIBB rates increased from 45% in 2003, but still fell short of the recommended 90%. Other population-studies have focused on breast cancer patients exclusively, and therefore lack the true denominator of all breast biopsies.10,19,21,22 These studies demonstrate slightly higher biopsy rates, ranging from 61% to 87%. The slightly higher reported rates in these studies are consistent with our observation that patients with an ultimate diagnosis of breast cancer were more likely to get MIBB. Like the Florida study, our study included all biopsies, regardless of diagnosis, allowing us to assess the true denominator (overall breast biopsy use).
Only 54% of our cohort had a documented physician visit for breast mass prior to the initial biopsy claim. Following a pre-biopsy visit, women presenting to oncologists, OB/GYNs, radiologists, or Internal Medicine/Primary Care providers with a diagnosis of breast mass were more likely to undergo MIBB than those presenting to surgeons. We suspect that the overall lower MIBB rates in this group occur because these patients were more likely to present with a palpable mass and may desire excision for peace of mind or other reasons we cannot measure. In addition, patients presenting or referred to surgeons may include a greater number of patients or masses with characteristics that favor open biopsy. The patients who did not have a visit prior to the claim were likely diagnosed with abnormalities on routine screening mammography, where the case for MIBB may be less controversial. However, the differences between specialists suggest different management of the same presentation and may provide specific groups to target for interventions focused on improving MIBB rates, such as those previously proposed in the literature. 18,19
Our study had several limitations. Our cohort was restricted to female Medicare beneficiaries age 66 years and older in the state of Texas at the time of biopsy. Because of this, our findings may not be applicable to the U.S. population or areas with younger populations. The similar findings of low MIBB rates reported by Gutwein et al. and Williams et al., which include women of all ages, suggest that the findings are generalizable to women of all ages.6,22 Medicare claims data do not contain information on patient preferences, symptoms, or physical exam findings, which may influence the choice of biopsy technique. Moreover, due to the nature of the claims data, we were only able to access information through the year 2008. As a result, we were not able to measure the effect the 2009 consensus statement recommendations4 and NCCN guidelines17 on MIBB rates.
Our study may be limited by failure to correctly identify Hispanic ethnicity. Previous studies demonstrate that large numbers of Hispanic patients are misclassified using Medicare claims enrollment data.33 However, a new algorithm using first/last names and other available information has been validated by CMS and is available in the Part D enrollment data.23 Part D enrollment information was available and used for 93% of our cohort. We would expect misclassification of Hispanics to bias our results toward the null hypothesis (no difference between racial/ethnic groups). A recent critique of previous studies in the Journal of the American College of Radiology questioned the validity of using CPT code 19125 as an open biopsy code, arguing that surgeons may use this code for surgical excisions of benign masses without prior biopsy for definitive treatment, or for malignant masses that had received prior biopsy.34 The authors demonstrated that this would then lead to underestimation of MIBB rates. We hoped to minimize this effect by including CPT code 19120 (which is specific for excisions performed on benign lesions) and by analyzing only the first biopsy of each episode of care to capture only the initial diagnostic procedure performed on a lesion. However, it is still possible that in some patients, the “biopsy” procedure was considered the definitive therapy.
Improvements in MIBB use can lower healthcare costs and improve patient care and patient satisfaction.4,6–12 In this state-wide, population-based study, we show that MIBB rates in Texas remain well below the NCCN guidelines of >90% even in large metropolitan areas, despite notable increases over time. This study identifies both Hispanic disparities and geographic variations in practice patterns as potential targets for interventions to improve MIBB rates. Strategies to improve MIBB rates may need to vary by geographic region and underlying etiology of the failure to adopt this cost-effective practice. In very rural areas where the primary problem is access to MIBB technology, MIBB rates of >90% may not be feasible. In areas such as major metropolitan areas, where racial disparities drive the failure to meet target rates, interventions need to be aimed at reducing these disparities. Finally, in some instances physician practice patterns and not patient characteristics may drive underuse of MIBB.
Acknowledgments
Supported by grants from the National Institutes of Health (1K07CA130983-01A1 and T32 DK007639), Clinical and Translational Science Award UL1TR000071, and the Cancer Prevention Research Institute of Texas (RP101207).
Footnotes
Disclosure information: Nothing to disclose.
Presented at the Southern Surgical Association 124th Annual Meeting, Palm Beach, FL, December 2012.
Publisher's Disclaimer: This is a PDF file of an unedited manuscript that has been accepted for publication. As a service to our customers we are providing this early version of the manuscript. The manuscript will undergo copyediting, typesetting, and review of the resulting proof before it is published in its final citable form. Please note that during the production process errors may be discovered which could affect the content, and all legal disclaimers that apply to the journal pertain.
References
- 1.ACS Cancer Facts & Figures 2012. 2012:9–11. Available at: http://www.cancer.org/Research/CancerFactsFigures/CancerFactsFigures/cancer-facts-figures-2012.
- 2. [Accessed 5/22, 2012];ACS Breast Cancer Facts & Figures 2011–2012. 2011 http://www.cancer.org/Research/CancerFactsFigures/BreastCancerFactsFigures/breast-cancer-facts-and-figures-2011-2012.
- 3.Fajardo LL, Pisano ED, Caudry DJ, et al. Stereotactic and sonographic large-core biopsy of nonpalpable breast lesions: results of the Radiologic Diagnostic Oncology Group V study. Acad Radiol. 2004 Mar;11(3):293–308. doi: 10.1016/s1076-6332(03)00510-5. [DOI] [PubMed] [Google Scholar]
- 4.Silverstein MJ, Recht A, Lagios MD, et al. Special report: Consensus conference III. Image-detected breast cancer: state-of-the-art diagnosis and treatment. J Am Coll Surg. 2009 Oct;209(4):504–520. doi: 10.1016/j.jamcollsurg.2009.07.006. [DOI] [PubMed] [Google Scholar]
- 5.Park HL, Kim LS. The current role of vacuum assisted breast biopsy system in breast disease. J Breast Cancer. 2011 Mar;14(1):1–7. doi: 10.4048/jbc.2011.14.1.1. [DOI] [PMC free article] [PubMed] [Google Scholar]
- 6.Gutwein LG, Ang DN, Liu H, et al. Utilization of minimally invasive breast biopsy for the evaluation of suspicious breast lesions. Am J Surg. 2011 Aug;202(2):127–132. doi: 10.1016/j.amjsurg.2010.09.005. [DOI] [PubMed] [Google Scholar]
- 7.Gruber R, Walter E, Helbich TH. Impact of stereotactic 11-g vacuum-assisted breast biopsy on cost of diagnosis in Austria. Eur J Radiol. 2009 Jan;77(1):131–136. doi: 10.1016/j.ejrad.2009.09.020. [DOI] [PubMed] [Google Scholar]
- 8.Duijm LE, Groenewoud JH, Fracheboud J, et al. Utilization and cost of diagnostic imaging and biopsies following positive screening mammography in the southern breast cancer screening region of the Netherlands, 2000–2005. Eur Radiol. 2008 Nov;18(11):2390–2397. doi: 10.1007/s00330-008-1043-5. [DOI] [PubMed] [Google Scholar]
- 9.Lind DS, Minter R, Steinbach B, et al. Stereotactic core biopsy reduces the reexcision rate and the cost of mammographically detected cancer. J Surg Res. 1998 Jul 15;78(1):23–26. doi: 10.1006/jsre.1998.5380. [DOI] [PubMed] [Google Scholar]
- 10.Friese CR, Neville BA, Edge SB, Hassett MJ, Earle CC. Breast biopsy patterns and outcomes in Surveillance, Epidemiology, and End Results-Medicare data. Cancer. 2009 Feb 15;115(4):716–724. doi: 10.1002/cncr.24085. [DOI] [PMC free article] [PubMed] [Google Scholar]
- 11.Landercasper J, Tafra L. The relationship between quality and cost during the perioperative breast cancer episode of care. Breast. 2010 Aug;19(4):289–296. doi: 10.1016/j.breast.2010.03.014. [DOI] [PubMed] [Google Scholar]
- 12.Linebarger JH, Landercasper J, Ellis RL, et al. Core needle biopsy rate for new cancer diagnosis in an interdisciplinary breast center: evaluation of quality of care 2007–2008. Ann Surg. 2011 Jan;255(1):38–43. doi: 10.1097/SLA.0b013e31823e00bf. [DOI] [PubMed] [Google Scholar]
- 13.Image-detected breast cancer: state of the art diagnosis and treatment. International Breast Cancer Consensus Conference. J Am Coll Surg. 2001 Sep;193(3):297–302. doi: 10.1016/s1072-7515(01)01017-1. [DOI] [PubMed] [Google Scholar]
- 14.Silverstein MJ, Lagios MD, Recht A, et al. Image-detected breast cancer: state of the art diagnosis and treatment. J Am Coll Surg. 2005 Oct;201(4):586–597. doi: 10.1016/j.jamcollsurg.2005.05.032. [DOI] [PubMed] [Google Scholar]
- 15. [Accessed 5/16, 2012];ASBS Percutaneous Needle Biopsy for Image Detected Breast Abnormalities. 2006 Approved June 2006: http://www.breastsurgeons.org/statements/PDF_Statements/Percutaneous_Needle_Biopsy.pdf.
- 16. [Accessed 5/16, 2012];ACR Practice Guideline for the Performance of Stereotactically Guided Breast Interventional Procedures. 2009 Revised 2009 (Res. 29): http://www.acr.org/SecondaryMainMenuCategories/quality_safety/guidelines/breast/stereotactically_guided_breast.aspx.
- 17.Bevers TB, Anderson BO, Bonaccio E, et al. NCCN clinical practice guidelines in oncology: breast cancer screening and diagnosis. J Natl Compr Canc Netw. 2009 Nov;7(10):1060–1096. doi: 10.6004/jnccn.2009.0070. [DOI] [PubMed] [Google Scholar]
- 18.Clarke-Pearson EM, Jacobson AF, Boolbol SK, et al. Quality assurance initiative at one institution for minimally invasive breast biopsy as the initial diagnostic technique. J Am Coll Surg. 2009 Jan;208(1):75–78. doi: 10.1016/j.jamcollsurg.2008.09.008. [DOI] [PubMed] [Google Scholar]
- 19.Breslin TM, Caughran J, Pettinga J, et al. Improving breast cancer care through a regional quality collaborative. Surgery. 2011 Oct;150(4):635–642. doi: 10.1016/j.surg.2011.07.071. [DOI] [PubMed] [Google Scholar]
- 20.Edge SBOR, Lepisto EM, et al. Surgical biopsy to diagnose breast cancer adversely affects outcomes of breast cancer care: Findings from the National Comprehensive Cancer Network. Annual San Antonio Breast Conference; San Antonio, TX. 2005. [Google Scholar]
- 21.Holloway CM, Saskin R, Brackstone M, Paszat L. Variation in the use of percutaneous biopsy for diagnosis of breast abnormalities in Ontario. Ann Surg Oncol. 2007 Oct;14(10):2932–2939. doi: 10.1245/s10434-007-9362-3. [DOI] [PubMed] [Google Scholar]
- 22.Williams RT, Yao K, Stewart AK, et al. Needle versus excisional biopsy for noninvasive and invasive breast cancer: report from the National Cancer Data Base, 2003–2008. Ann Surg Oncol. 2011 Dec;18(13):3802–3810. doi: 10.1245/s10434-011-1808-y. [DOI] [PubMed] [Google Scholar]
- 23.Agency for Healthcare Research and Quality. [Accessed November 20, 2012];Creation of new race ethnicity codes and socioeconomic status (SES) indicators for Medicare beneficiaries. http://www.ahrq.gov/qual/medicareindicators/medicareindicators.pdf.
- 24. [Accessed November 27, 2012];Metropolitan and Micropolitan Statistical Areas Main. 2012 May 24; http://www.census.gov/population/metro/
- 25.Wennberg J, Fisher E, Goodman D, Skinner J. Tracking the Care of Patients with Severe Chronic Illness: The Dartmouth Atlas of Health Care 2008. Health Care. 2008 [PubMed] [Google Scholar]
- 26.U.S. Bureau of the Census. The Hispanic Population: 2010. [Accessed November 20, 2012];2010 Census Briefs. http://www.census.gov/prod/cen2010/briefs/c2010br-04.pdf.
- 27.Gawande A. The cost conundrum. [Accessed November 20, 2012];The New Yorker. 2009 http://www.newyorker.com/reporting/2009/06/01/090601fa_fact_gawande.
- 28.U.S. Bureau of the Census. Census 2000 Summary File 1. Prepared by the U.S. Census Bureau; Washington, DC: 2001. [Google Scholar]
- 29.Combs S. [Accessed 6/28/2012, 2012];Texas in Focus: A Statewide View of Opportunities. http://www.window.state.tx.us/specialrpt/tif/population.html.
- 30.DeNavas-Walt C, Proctor BD, Lee CH U.S. Census Bureau. Income, Poverty, and Health Insurance Coverage in the United States: 2005. U.S. Government Printing Office; Washington, DC: 2006. Current Population Reports, P60-231. [Google Scholar]
- 31.NACRHHS. [Accessed 8/13/2012];The 2008 Report to the Secretary: Rural health and Human Services Issues. 2008 ftp://ftp.hrsa.gov/ruralhealth/committee/NACreport2008.pdf.
- 32.Bao Y, Fox SA, Escarce JJ. Socioeconomic and racial/ethnic differences in the discussion of cancer screening: “between-” versus “within-” physician differences. Health services research. 2007 Jun;42(3 Pt 1):950–970. doi: 10.1111/j.1475-6773.2006.00638.x. [DOI] [PMC free article] [PubMed] [Google Scholar]
- 33.Eggers PW, Greenberg LG. Racial and ethnic differences in hospitalization rates among aged Medicare beneficiaries, 1998. Health care financing review. 2000 Summer;21(4):91–105. [PubMed] [Google Scholar]
- 34.Levin DC, Parker L, Schwartz GF, Rao VM. Percutaneous needle vs surgical breast biopsy: previous allegations of overuse of surgery are in error. J Am Coll Radiol. 2012 Feb;9(2):137–140. doi: 10.1016/j.jacr.2011.10.002. [DOI] [PubMed] [Google Scholar]