

Abstract
Multiple myeloma (MM) is characterized by the malignant expansion of differentiated plasma cells. Although many chemotherapeutic agents display cytotoxic activity toward MM cells, patients inevitably succumb to their disease because the tumor cells become resistant to the anticancer drugs. The cancer stem cell hypothesis postulates that a small subpopulation of chemotherapy-resistant cancer cells is responsible for propagation of the tumor. Herein we report that efflux of the pluripotent stem cell dye CDy1 identifies a subpopulation in MM cell lines characterized by increased expression of P-glycoprotein, a member of the ABC (ATP-binding cassette) superfamily of transporters encoded by ABCB1. We also demonstrate that ABCB1-overexpressing MM cells are resistant to the second-generation proteasome inhibitor carfilzomib that recently received accelerated approval for the treatment of therapy-refractive MM by the U.S. Food and Drug Administration. Moreover, increased resistance to carfilzomib in sensitive MM cells following drug selection was associated with upregulation of ABCB1 cell-surface expression which correlated with increased transporter activity as measured by CDy1 efflux. We further show that chemosensitization of MM cells to carfilzomib could be achieved in vitro by cotreatment with vismodegib, a hedgehog pathway antagonist which is currently in MM clinical trials. CDy1 efflux may therefore be a useful assay to determine whether high expression of ABCB1 is predictive of poor clinical responses in MM patients treated with carfilzomib. Our data also suggest that inclusion of vismodegib might be a potential strategy to reverse ABCB1-mediated drug resistance should it occur.
Keywords: CDy1, ABCB1, multiple myeloma, carfilzomib, vismodegib, ASPM, KIF14, TMPO
Introduction
Multiple myeloma (MM), an incurable clonal plasma cell disorder, is the second most common hematologic malignancy in the United States with over 20,000 new cases and 10,000 deaths each year. Although patients initially respond to therapy, they eventually relapse because the MM cells acquire drug resistance [1]. The cancer stem cell (CSC) hypothesis predicts that a small subpopulation of cancer cells is responsible for tumor propagation [2]. Demonstration of a low percentage of clonogenic cells in the bulk tumor first prompted a search for CSCs in MM over 30 years ago [3]. By analogy to normal stem cells, CSCs are predicted to be drug-resistant due to expression of enzymes that detoxify chemotherapeutic agents (such as aldehyde dehydrogenase (ALDH) which neutralizes cyclophosphamide) or members of the ATP-binding cassette (ABC) family of transporters that efflux them out of the cells [4–7]. Despite these similarities, the relationship between drug-resistant MM cells at relapse and putative MM CSCs remains unclear, and the clinical relevance of CSCs in MM remains a matter of much debate [8]. For example, efflux of the vital dye Hoechst 33342 by the ABC family members ABCB1 or ABCG2 identifies a subpopulation of cells—termed ‘side population’ (SP)—that exhibits stem cell-like properties in a variety of normal and malignant tissues [9,10]. However, variable results have been obtained regarding the CSC-like SP phenotype in human MM cell lines and patient samples. Using this assay, Matsui’s group identified a clonogenic CD138-negative subpopulation that was resistant to lenalidomide whereas Jakubikova et al. characterized a clonogenic SP subpopulation that primarily expressed CD138 and was sensitive to lenalidomide [11,12].
Chang and colleagues recently reported the synthesis of a vital dye CDy1 that distinguishes embryonic stem cells and induced pluripotent stem cells [13,14]. Because a MYC-centered transcriptional network has been associated with an embryonic stem cell gene expression signature in other cancers [15,16], and activation of this proto-oncogene is a recurring event in MM pathogenesis [17], we set out to investigate the existence and properties of a CDy1-positive subpopulation in MM.
Materials and Methods
Cell lines and reagents
The NCI-H929 and RPMI-8226 cell lines were obtained from the American Type Culture Collection (Manassas, VA). KMS-5 cells were a kind gift from Dr. Michio Kawano (Yamaguchi University, Yamaguchi, Japan) [18,19]. The doxorubicin-resistant RPMI-8226/Dox40 cell line was kindly provided by Dr. William Dalton (Moffitt Cancer Center, Tampa, FL) [20]. KMS-34 cells were a kind gift from Dr. P. Leif Bergsagel (Mayo Clinic, Scottsdale, AZ) [21]. Cells were cultured in RPMI 1640 (Mediatech, Manassas, VA) supplemented with 10% fetal bovine serum (Cambrex BioScience, Walkersville, MD), 100 U/mL penicillin, 100 μg/mL streptomycin and 2 mM L-glutamine. Carfilzomib was obtained from Active Biochem (Maplewood, NJ), vismodegib was from Selleck Chemicals (Houston, TX) and reversin 121 was from Santa Cruz Biotechnology (Santa Cruz, CA). Rhodamine 123 and SYTOX Red were purchased from Life Technologies (Grand Island, NY), the Aldefluor reagent was purchased from StemCell Technologies (Vancouver, BC) and other chemicals were purchased from Sigma-Aldrich (St. Louis, MO).
Fluorescence-activated cell sorting and analysis
MM cells were stained with CDy1 as previously described [13,14]. Briefly, cells were incubated in growth medium containing 500 nM CDy1 at 2 × 10⁵ cells/ml. After 1 hour at 37°C, cells were centrifuged and washed twice in growth medium. Stained cells were allowed to efflux in growth medium for 3 hours at 37°C unless otherwise indicated. Fluorescence-activated cell sorting (FACS) was performed on a FACSAria instrument equipped with FACSDiva software (BD Biosciences; San Jose, CA) [10,22]. Experiments that did not require cell sorting were performed on an upgraded digital 3-laser, 8-parameter FACSCalibur DxP8 instrument equipped with FlowJo Collector’s Edition software (Cytek Development; Freemont, CA). Data were analyzed with FlowJo Mac v10.0.2 (Tree Star; Ashland, OR). CDy1 is efficiently excited with 488 nm (blue laser excitation), minimally excited with 405 nm (violet laser excitation) and not excited with 633 nm (red laser excitation). For the data presented, CDy1 was excited with 488 nm and detected with a 585/42 nm bandpass filter. Dead cells were identified by SYTOX Red staining (excited with 633 nm) and excluded from analysis. To aid in visualization, selected data were presented on a bivariate plot of 585/42 (blue laser excitation) versus violet emission (violet laser excitation). ALDH activity was detected by FACS using the Aldefluor reagent [22,23] and staining for cell surface expression of ABCB1 with anti-human CD243-APC (eBioscience; San Diego, CA) was carried out as previously described [22].
RNA-seq gene expression analysis
Total RNA was extracted with TRIzol Reagent (Life Technologies) and then purified on RNeasy spin columns (Qiagen; Valencia, CA) as per the manufacturer’s instructions. The RNA integrity and quantity was determined on an Agilent 2100 Bioanalyzer (Agilent; Palo Alto, CA). Total RNA without an mRNA enrichment step was processed for cDNA synthesis using the Ovation RNA-Seq system (NuGEN Technologies; San Carlos, CA) according to manufacturer’s protocol. Fragmented libraries were constructed from the double-stranded cDNA (0.5–1 μg amplified from a total RNA input of 100 ng) using the Illumina TruSeq RNA sample preparation kit.
The cDNA libraries were subjected to sequencing on a Genome Analyzer IIx (Illumina, Inc) high-throughput system as previously described [24]. Bowtie software [25] was used to map RNA-seq reads to the GRCh37/hg19 reference genome (http://genome.ucsc.edu), allowing for two mismatches. Only uniquely mapping reads were retained for downstream analysis. Gene transcript levels were quantified by mapping RNA-seq reads to RefSeq using NEUMA (Normalization by Expected Uniquely Mappable Area) v1.1.2 [26]. Four datasets were included in each analysis: two biological replicates for each CDy1-hi and CDy1-lo sample. Differentially expressed transcripts were identified using edgeR [27]. Fold changes were calculated using ratios of the arithmetic mean of the normalized read counts for each pair of replicates.
Quantitative real-time RT-PCR validation and analysis of gene expression
Real-time qRT-PCR was performed using the Power SYBR Green reagent (Life Technologies) on an ABI Prism 7000 Sequence Detection System (Life Technologies) as previously described [28]. Primers used included: ABCB1, forward, ACCAGATAAAAGAGAGGTGCAACGG, reverse, TCCCGGCCCGGATTGACTGA; ADM, forward, CCGGGCTCGCTGACGTGAAG, reverse, CCGGACTGCTGTCTTCGGGG; ASPM, forward, TGACCTTTCCCGTCACCTTGGC, reverse, GGTTCGCACAAGGCGCACTC; CTHRC1, forward, TCGAGCGCCTCTGAGATCCCC, reverse, ACAGGTCCACCACCTCCCTCT; EPAS1, forward, AGCCCACAAGGTGTCAGGCATGG, reverse, AGCACGGGCACGTTCACCTC; FAM72B, forward, CTCCTACCAACGCAGTGGACTTCA, reverse, TGTTGCAGGAAGGAAGACAGGAACT; HBEGF, forward, TGGCTGCAGTTCTCTCGGCAC, reverse, GCCGCCTCCTAGGGGTAGCA; KIF14, forward, TGGTGATGACCCAGACCAAGACAG, reverse, GCGCTCACTGCCTGCCAGAT; NUCB2, forward, CAGGTTTGTGCGCTGGACGC, reverse, CGTAACACGTTCTGGCCGGGT; SS18, forward, AGCAGCAGGGCTACGGTCCT, reverse, TGGCTGTGGTGGTCCAGGCT; TMPO, forward, ACCCAGAAGAGCACCAAAGAAACCA, reverse, TGGTCTGCGGCAACTAGCACTAA; and VAPA, forward, CACAGACCTCAAATTCAAAGGCCCC, reverse, GGCCTCACACAGTACCGGCG.
Gene expression data were obtained for biological replicates and presented as the mean ± S.D. qRT-PCR controls, which included ACTB, GAPDH, PGK1, RPL13A and TBP, were confirmed not to show any changes in expression under the experimental conditions studied. Primers: ACTB, forward, GGACTTCGAGCAAGAGATGG, reverse, AGCACTGTGTTGGCGTACAG; GAPDH, forward, GAGTCAACGGATTTGGTCGT, reverse, TTGATTTTGGAGGGATCTCG; PGK1, forward, CTGTGGGGGTATTTGAATGG, reverse, CTTCCAGGAGCTCCAAACTG; RPL13A, forward, CCTGGAGGAGAAGAGGAAAGAGA, reverse, TTGAGGACCTCTGTGTATTTGTCAA; and TBP, forward, TATAATCCCAAGCGGTTTGC, reverse, GCTGGAAAACCCAACTTCTG. The data were normalized to GAPDH expression levels.
Viability assays
Cell growth was measured using the alamarBlue cell viability and proliferation reagent (Life Technologies) as previously described [29]. Where indicated, cells were treated with carfilzomib, CoCl2, 2-methoxyestradiol, reversin 121, verapamil or vismodegib at the indicated concentrations. Mock-treated cultures contained 0.05% dimethylsulfoxide as solvent vehicle control.
Statistical analysis
Statistical significance of differential gene expression in RNA-seq data was determined using edgeR and included P value and false discovery rate (FDR) calculations [27]. Fold changes ≥ 2 (log2FC ≥ 1) with an FDR ≤ 0.1 were considered significant. Otherwise, the Student’s t test was used to compare differences between indicated groups. A P value < 0.05 was considered significant.
Results
CDy1 staining intensity as an assay of ABCB1 transporter efflux activity
Previously it was reported that the NCI-H929 MM cell line was phenotypically heterogeneous and that rare CSC-like subpopulations could be identified based on differential staining with Hoechst 33342 and the fluorescently-labeled ALDH substrate Aldefluor [11]. During the characterization of KMS-5 cells, we found that they are highly positive for ALDH (Figs. S1 and S2). Both NCI-H929 and KMS-5 exhibited heterogeneous patterns of staining with CDy1 (Fig. 1A). These patterns were reminiscent of that observed for mixed populations of CDy1-positive embryonic stem cells and weakly-staining fibroblast feeder cells [13,14]. To investigate the molecular mechanisms associated with CDy1 staining heterogeneity, we used fluorescence-activated cell sorting (FACS) to isolate CDy1-hi and CDy1-lo subpopulations, and subjected them to global gene expression analysis by high-throughput RNA sequencing (RNA-seq). To our surprise, the top-ranked differentially expressed gene in each case was ABCB1, and its expression was negatively correlated with CDy1 staining intensity: in the case of NCI-H929, the log2 fold change (log2FC) for CDy1-hi versus CDy1-lo subpopulations was -4.81 (P = 2.15 × 10⁻¹⁴; FDR = 6.29 × 10⁻¹⁰) and for KMS-5 it was -4.30 (P = 6.96 × 10⁻¹¹; FDR = 1.12 × 10−06), with higher ABCB1 mRNA levels detected in KMS-5 cells (Fig. 1B; Table S1).
Figure 1.

CDy1 efflux identifies a subpopulation of MM cells characterized by increased ABCB1 expression. A: NCI-H929 and KMS-5 cells were incubated with CDy1, and CDy1-bright (CDy1-hi) and CDy1-dim (CDy1-lo) subpopulations were isolated by FACS for RNA-seq. B: Graphic representation of the RNA-seq results for CDy1-hi and CDy1-lo subpopulations of NCI-H929 and KMS-5 cells as .wig format files in the UCSC web browser at the ABCB1 locus. See Table S1 for details. C: CDy1 staining of NCI-H929 in the absence (left panel) or presence (right panel) of 50 μM verapamil. D: CDy1 staining of RPMI-8226/Dox40 in the absence (left panels) or presence of 100 μM verapamil (top right panel) or 37.5 μM reversin 121 (bottom right panel). E: CDy1 staining of NCI-H929 in the absence (left panel) or after incubation with 100 μM CoCl2 for 12 hours (right panel). Percentages of CDy1-lo cells are indicated.
These results implied that CDy1 is a substrate of the ABCB1-encoded P-glycoprotein multidrug resistance efflux pump [30], with the heterogeneity in CDy1 staining patterns due to subpopulations within the cultures expressing different levels of ABCB1; i.e., low staining intensity of CDy1 is a consequence of low intracellular dye accumulation because of ABCB1-mediated efflux. To obtain evidence in support of this hypothesis, we stained NCI-H929 with CDy1 in the presence or absence of verapamil, a widely-used inhibitor of ABCB1 transporter activity [31]. As predicted, the percentage of cells within the CDy1-lo subpopulation (Fig. 1C, left panel) was reduced by verapamil treatment (Fig. 1C, right panel). To extend these findings, we examined the doxorubicin-resistant RPMI-8226/Dox40 MM cell line which expresses very high levels of ABCB1 (see below) [12,20,32]. Significant staining of RPMI-8226/Dox40 cells with CDy1 was only observed following treatment with verapamil or with reversin 121 [33], a highly specific inhibitor of ABCB1 transporter function (Fig. 1D, right panels versus left panels). Inspection of gene expression profiling (GEP) data for a series of 45 MM cell lines indicated that NCI-H929 cells expressed among the lowest levels of ABCB1 transcripts (Table S2) [21]. Considered together with the RNA-seq results, these observations plus additional data comparing CDy1 with rhodamine 123 (Fig. S3) substantiated the notion that CDy1 efflux is a sensitive assay of ABCB1 transporter activity in MM cells.
The ABCB1 signature is enriched in genes that are poor prognostic indicators in MM
We next examined the genes that were differentially expressed in the CDy1-lo (ABCB1-hi) versus CDy1-hi (ABCB1-lo) subpopulations. We focused on NCI-H929 for these analyses since it is a well-characterized cell culture model of MM containing the t(4;14) chromosomal translocation associated with poor prognosis [34,35]. We created a gene set of ABCB1 neighbors having a log2FC ≥ 1 (FDR ≤ 0.1) for replicate RNA-seq samples of ABCB1-hi versus ABCB1-lo subpopulations (Table 1; see Table S3A for details) and a second set of genes whose expression negatively correlated with ABCB1 expression (log2FC ≤ −1; FDR ≤ 0.1) (Table S3B). Differential expression of selected genes was validated by qRT-PCR (Table 1). Among the 38 ABCB1 neighbors were numerous genes implicated in MM pathobiology. These included ASPM, KIF14 and TMPO, which were previously identified in several GEP-based prognostic signatures for MM [36–39]. Specifically, Shaughnessy and coworkers reported a 17-gene set (UAMS-17) that was sufficient to predict high-risk MM: all 3 genes are included in the UAMS-17 signature [36]. ASPM and KIF4 are also associated with the high-risk proliferation subgroup of Zhan et al. [37], while ASPM is present in the high-risk gene proliferation index of Hose and colleagues [38]. Moreover, TMPO is one of 4 genes which comprise the critical-gene prognostic model of Agnelli et al. that reportedly provides comparable predictive power to the UAMS-17 signature despite the fact that the two signatures have only TMPO in common [36,39].
Table 1.
ABCB1 neighbors: 38 genes whose expression positively correlates with ABCB1 expression in t(4;14)-positive NCI-H929 cells
| Symbol | Name | Gene ID | RNA-Seq* | qRT-PCR | |||
|---|---|---|---|---|---|---|---|
|
| |||||||
| Log2FC | P-value | FDR | FC | SD | |||
| ADM | Adrenomedullin | 133 | 30.97 | 2.75E-07 | 1.34E-03 | 16.33 | 2.27 |
| FAM72B | Family with sequence similarity 72, member B | 653820 | 30.68 | 3.51E-06 | 9.35E-03 | 1.73 | 0.43 |
| PUM1 | Pumilio homolog 1 (Drosophila) | 9698 | 30.32 | 5.20E-05 | 4.86E-02 | - | - |
| RTKN2 | Rhotekin 2 | 219790 | 30.24 | 9.09E-05 | 5.61E-02 | - | - |
| C2orf48 | - | 348738 | 30.06 | 2.83E-04 | 9.24E-02 | - | - |
| TDRKH | Tudor and KH domain containing | 11022 | 29.97 | 2.83E-04 | 9.24E-02 | - | - |
| ABCB1 | ATP-binding cassette, sub-family B (MDR/TAP), member 1 | 5243 | 4.82 | 2.15E-14 | 6.29E-10 | 3.31 | 0.91 |
| NDUFB6 | NADH dehydrogenase (ubiquinone) 1 beta subcomplex, 6, 17kDa | 4712 | 4.04 | 9.38E-05 | 5.61E-02 | - | - |
| SS18 | Synovial sarcoma translocation, chromosome 18 | 6760 | 3.89 | 2.57E-04 | 9.24E-02 | 1.43 | 0.18 |
| NBPF14 | Neuroblastoma breakpoint family, member 14 | 25832 | 2.81 | 7.90E-05 | 5.61E-02 | - | - |
| SLC40A1 | Solute carrier family 40 (iron-regulated transporter), member 1 | 30061 | 2.77 | 1.14E-04 | 6.32E-02 | - | - |
| EPAS1 | Endothelial PAS domain protein 1 | 2034 | 2.49 | 2.13E-04 | 8.42E-02 | 1.39 | 0.20 |
| ARID4B | AT rich interactive domain 4B (RBP1-like) | 51742 | 2.49 | 2.13E-04 | 8.42E-02 | - | - |
| LDLRAD3 | Low density lipoprotein receptor class A domain containing 3 | 143458 | 2.49 | 2.13E-04 | 8.42E-02 | - | - |
| VAPA | VAMP (vesicle-associated membrane protein)-associated protein A | 9218 | 2.40 | 4.59E-05 | 4.48E-02 | 1.30 | 0.13 |
| DHRSX | Dehydrogenase/ reductase (SDR family) X-linked | 207063 | 2.35 | 1.87E-04 | 8.33E-02 | - | - |
| HBEGF | Heparin-binding EGF-like growth factor | 1839 | 2.33 | 8.64E-05 | 5.61E-02 | 2.16 | 0.57 |
| PSMG1 | Proteasome (prosome, macropain) assembly chaperone 1 | 8624 | 2.30 | 2.61E-04 | 9.24E-02 | - | - |
| ZNF718 | Zinc finger protein 718 | 255403 | 2.29 | 1.19E-04 | 6.32E-02 | - | - |
| DHX9 | DEAH (Asp-Glu-Ala-His) box polypeptide 9 | 1660 | 1.96 | 2.29E-06 | 7.62E-03 | - | - |
| GSTA4 | Glutathione S-transferase alpha 4 | 2941 | 1.91 | 8.21E-05 | 5.61E-02 | - | - |
| TMEM2 | Transmembrane protein 2 | 23670 | 1.71 | 2.21E-05 | 3.33E-02 | - | - |
| CARD16 | Caspaserecruitment domain family, member 16 | 114769 | 1.61 | 2.75E-04 | 9.24E-02 | - | - |
| ELMOD2 | ELMO/CED-12 domain containing 2 | 255520 | 1.50 | 2.60E-04 | 9.24E-02 | - | - |
| DNAJC21 | DnaJ (Hsp40) homolog, subfamily C, member 21 | 134218 | 1.48 | 2.79E-05 | 3.40E-02 | - | - |
| CCDC15 | Coiled-coil domain containing 15 | 80071 | 1.45 | 2.47E-04 | 9.19E-02 | - | - |
| CTHRC1 | Collagen triple helix repeat containing 1 | 115908 | 1.44 | 2.19E-05 | 3.33E-02 | 1.77 | 0.27 |
| TMPO | Thymopoietin | 7112 | 1.38 | 1.79E-05 | 3.09E-02 | 1.42 | 0.11 |
| PPAPDC1B | Phosphatidicacid phosphatase type 2 domain containing 1B | 84513 | 1.35 | 1.07E-05 | 2.09E-02 | - | - |
| KIF14 | Kinesin family member 14 | 9928 | 1.31 | 2.97E-05 | 3.48E-02 | 1.51 | 0.23 |
| CCDC132 | Coiled-coil domain containing 132 | 55610 | 1.26 | 1.94E-04 | 8.33E-02 | - | - |
| ASPM | Asp (abnormal spindle) homolog, microcephaly associated | 259266 | 1.21 | 7.03E-05 | 5.57E-02 | 1.40 | 0.34 |
| C14orf135 | - | 64430 | 1.18 | 2.48E-04 | 9.19E-02 | - | - |
| CCDC18 | Coiled-coil domain containing 18 | 343099 | 1.16 | 2.31E-04 | 8.80E-02 | - | - |
| UTRN | Utrophin | 7402 | 1.15 | 3.06E-04 | 9.35E-02 | - | - |
| NUCB2 | Nucleobindin 2 | 4925 | 1.14 | 1.72E-04 | 8.13E-02 | 1.44 | 0.10 |
| CNOT7 | CCR4-NOT transcription complex, subunit 7 | 29883 | 1.13 | 2.70E-04 | 9.24E-02 | - | - |
| RHOBTB3 | Rho-related BTB domain containing 3 | 22836 | 1.13 | 3.06E-04 | 9.35E-02 | - | - |
log2FC ≥ 1; FDR ≤ 0.1
FC, fold change; SD, standard deviation; -, not done
In addition, pathway analysis and extensive literature review revealed that ABCB1 and many of its neighbors (18/38) were ‘hypoxia/angiogenesis-associated’ (Table S4); these included ADM, encoding adrenomedullin, a proangiogenic factor produced by MM cells [40]; EPAS1, encoding hypoxia-inducible factor (HIF)-2α (HIF2α), a regulator of CXCL12/SDF1 expression in MM cells and a contributor to MM-induced angiogenesis within the hypoxic bone marrow microenvironment [40,41]; and HBEGF, encoding heparin-binding EGF-like growth factor, a proangiogenic molecule with MM growth stimulatory activity [40,42–44]. Treatment with the hypoxia mimetic CoCl2 [45] resulted in an increased percentage of cells within the CDy1-lo (ABCB1-hi) subpopulation (Fig. 1E), supporting the involvement of hypoxia signaling pathways and crosstalk with ABCB1 regulatory mechanisms in NCI-H929 cells [46,47].
We next analyzed GEP data for 6 MM patients who had higher ABCB1 transcripts at relapse [48]. The sample set consisted of 2 patients with t(4;14) MM plus 4 other MM patients—3 patients with t(11;14) MM and 1 patient with t(6;14) MM—who had received a variety of treatment regimens. A corresponding increase in expression of ASPM, KIF14 and TMPO, and many other ABCB1 neighbors was observed in this small sample set (e.g., ADM and HBEGF) (Fig. S4). To further investigate the generality of the ABCB1 signature across a broader range of MM samples and subgroups, we stratified 304 MM patient samples from the Multiple Myeloma Research Consortium (MMRC) reference collection dataset on the basis of ABCB1 expression and performed gene set enrichment analysis [49] of ‘ABCB1-hi’ versus ‘ABCB1-lo’ samples (Fig. 2A; Table S5). Leading edge analysis of the core-enriched genes in the top 3 ranked gene sets (Fig. 2B) identified 51 genes in common. ASPM, KIF14 and TMPO were among this common leading edge gene set (Fig. 2C). There was also considerable overlap of these leading edge genes with those in the high-risk MM proliferation subgroup of Zhan et al. (20/51 genes) [37].
Figure 2.

NCI-H929-associated ABCB1 neighbors ASPM, KIF14 and TMPO are coordinately upregulated with ABCB1 in primary MM samples. A: Heat map of ABCB1 neighbors in MM patient samples from the Multiple Myeloma Research Consortium (MMRC) reference collection dataset (www.broadinstitute.org/mmgp) stratified on the basis of ABCB1 expression into ‘ABCB1-hi’ and ‘ABCB1-lo’ sample sets (see Table S5 for details). B: Gene set enrichment analysis (GSEA; www.broadinstitute.org/gsea) enrichment plots of the top 3 ranked gene sets containing genes whose expression is highly correlated with ABCB1 expression in the MMRC MM samples. NES, normalized enrichment score. C: Common genes in the leading-edge subsets of the 3 top-ranked gene sets in B.
Upregulation of ABCB1 expression confers resistance to carfilzomib
In clinical studies conducted in the 1980’s and early 1990’s, ABCB1-associated drug resistance was observed in ~75% of MM patients who had received combination chemotherapies containing high doses of doxorubicin and vincristine, both of which are ABCB1 substrates [32,50–54]. In view of the recent appreciation that lenalidomide is an ABCB1 substrate [55,56], we investigated whether the second-generation proteasome inhibitor carfilzomib might be an ABCB1 substrate as well. As shown in Fig. 3A, RPMI-8226/Dox40 cells were highly resistant to carfilzomib and treatment with reversin 121 restored carfilzomib sensitivity to levels approaching parental RPMI-8226 cells.
Figure 3.
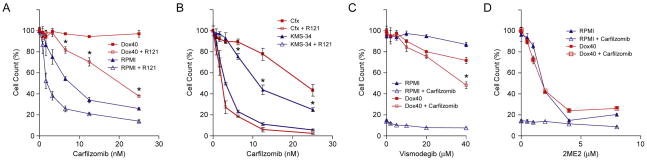
Effects of carfilzomib, vismodegib and 2-methoxyestradiol on MM cell lines. A: RPMI-8226/Dox40 (Dox40) and parental RPMI-8226 (RPMI) cells were treated with the indicated concentrations of carfilzomib for 48 hours in the presence or absence of 37.5 μM reversin 121 (R121). Cell viability was determined by alamarBlue assay. The experiment was performed in triplicate for two biological replicates. The data are presented as the mean ± S.D. *P < 0.001. B: KMS-34/Cfx (Cfx) and parental KMS-34 cells were treated with the indicated concentrations of carfilzomib for 48 hours in the presence or absence of 37.5 μM reversin 121 (R121). Cell viability was determined by alamarBlue assay. The experiment was performed in triplicate for two biological replicates. The data are presented as the mean ± S.D. *P < 0.001. C: RPMI-8226/Dox40 and parental RPMI-8226 cells were treated with the indicated concentrations of vismodegib for 48 hours in the presence or absence of 25 nM carfilzomib. Cell viability was determined by alamarBlue assay. The experiment was performed in triplicate for two biological replicates. The data are presented as the mean ± S.D. *P < 0.01. D: RPMI-8226/Dox40 and parental RPMI-8226 cells were treated with the indicated concentrations of 2-methoxyestradiol (2ME2) for 48 hours in the presence or absence of 25 nM carfilzomib. Cell viability was determined by alamarBlue assay. The experiment was performed in triplicate for two biological replicates. The data are presented as the mean ± S.D.
RPMI-8226/Dox40 cells were obtained by selecting RPMI-8226 cells in increasing concentrations of doxorubicin over a 2-year period [20]. As a consequence, RPMI-8226/Dox40 is cross-resistant to ~125 nM carfilzomib (data not shown). While increased ABCB1 expression was previously detected in clinical MM samples from patients who had received chemotherapy containing doxorubicin, in no instance were the levels as high as in RPMI-8226/Dox40 (Fig. 4) [32,50,57]. Therefore, in an effort to develop a more appropriate MM cell culture model to study potential clinical relevance of ABCB1 expression in MM patients treated with carfilzomib, KMS-34 cells, which express relatively high baseline levels of ABCB1 transcripts (Table S2), were selected in 6 nM of the drug. As demonstrated in Fig. 3B, KMS-34 cells exposed to carfilzomib for 4 weeks (denoted KMS-34/Cfx) showed decreased sensitivity compared to parental KMS-34 cells; reversin 121 treatment resensitized the cells to parental KMS-34 levels. Moreover, increased resistance of KMS-34/Cfx cells to carfilzomib was associated with increased cell-surface expression of ABCB1 which correlated with increased CDy1 efflux (Fig. 4).
Figure 4.

Upregulated expression of ABCB1 correlates with increased carfilzomib resistance in KMS-34/Cfz cells. CD243(ABCB1) cell surface expression (top panels) and CDy1 efflux (bottom panels) are shown for KMS-34/Cfz and parental KMS-34 cells in comparison to RPMI-8226/Dox40 and parental RPMI-8226 cells. Percentages of CD243(ABCB1)-positive and CDy1-lo cells are indicated. For the CDy1 efflux assays, the positions of the far left gates were determined by autofluorescence of unstained cells.
Sensitization of tumor cells to anticancer drugs with ABCB1 efflux inhibitors has met with little success in the clinical setting [50,53,58]. As proof of concept, we sought to identify potential alternatives that enhanced the efficacy of carfilzomib on ABCB1-overexpressing RPMI-8226/Dox40 cells. In view of emerging data for a role of hypoxia-inducible transcriptional networks in MM biology [40,41,45,47, this work] (for review, see ref. [59]), we screened already approved drugs and those undergoing clinical testing that interfere with hypoxia signaling pathways. Among the compounds tested, which included inhibitors of HIF1α, IGF1R, EGFR and hedgehog signaling [60–65], we found that treatment with vismodegib (GDC-0449/HhAntag691), a hedgehog pathway antagonist [66], sensitized RPMI-8226/Dox40 to carfilzomib almost as effectively as reversin 121 (Fig. 3C). In addition, 2-methoxyestradiol, a microtubule-targeting drug that inhibits HIF1α [61], also displayed potent cytotoxicity against RPMI-8226/Dox40 cells (Fig. 3D).
Discussion
In this study, we report that efflux of the pluripotent stem cell fluorescent dye CDy1 [13,14] detects an ABCB1-positive subpopulation in MM cell culture models. In addition, we demonstrate that upregulated ABCB1 expression in MM cell lines confers resistance to the second-generation proteasome inhibitor carfilzomib which recently received accelerated approval by the FDA for the treatment of refractory/relapsed MM patients.
Disease recurrence in MM indicates that the cells responsible for tumor initiation and maintenance are resistant to the chemotherapy [1]. Early studies suggested that overexpression of ABCB1 was a contributing factor to the drug resistance that developed in MM patients treated with doxorubicin and vincristine [32,50–54]. Our results indicate that ABCB1-mediated efflux is a major contributor to the increased resistance of RPMI-8226/Dox40 and KMS-34/Cfx to carfilzomib compared to their respective parental cell lines. Of relevance in this regard, carfilzomib is a derivative of epoxomicin and it was previously shown that acquisition of epoxomicin resistance in a MM cell culture model was due to upregulated ABCB1 expression [67]. Our findings are in agreement with a recent publication by Ao et al. who reported that ABCB1-mediated efflux plays a major role in the development of carfilzomib resistance in lung and colon adenocarcinoma cell lines [68]. They are also supported by a recent investigation carried out by Verbrugge et al. who used a panel of cell lines overexpressing ABCB1, ABCG2, ABCC1 or several other ABC transporter genes and showed that only ABCB1 had the ability to confer resistance to carfilzomib [69].
These in vitro results notwithstanding, it remains to be demonstrated whether an ABCB1-mediated mechanism is relevant to resistance that develops to carfilzomib in the clinic. That this might be the case in MM is suggested by GEP data acquired during disease progression in a t(4;14) MM patient [48], where increased ABCB1 expression was found in the drug-resistant cells that emerged at relapse following carfilzomib therapy (Fig. S4B). In this context, functional activity of ABCB1 in clinical samples is routinely evaluated by measurement of rhodamine 123 efflux [58]. Comparative analysis of CDy1 and rhodamine 123 staining of NCI-H929 and KMS-34 cells showed that the CDy1 efflux assay is more sensitive (Fig. S3), suggesting that it might be of utility in determining whether high level ABCB1 expression correlates with a worse response to carfilzomib treatment in the clinical setting.
As attempts to reverse clinical multidrug resistance by inhibiting ABCB1 transporter activity have generally failed to improve outcomes [50,53,58], we employed a hypothesis-driven approach based on ABCB1 neighbor analysis and screened drugs targeting hypoxia signaling pathways for enhanced carfilzomib-induced cytotoxicity on RPMI-8226/Dox40 cells [46,59–65,70]. In agreement with previous reports that the parental RPMI-8226 cell line is relatively resistant to hedgehog pathway inhibitors [71,72], we observed that treatment of ABCB1-overexpressing RPMI-8226/Dox40 cells with vismodegib alone had modest effects. On the other hand, vismodegib sensitized RPMI-8226/Dox40 to carfilzomib. Vismodegib is currently in clinical trials for MM patients with relapsed/refractory disease (ClinicalTrials.gov identifier: NCT01330173) [73]. Thus, further studies evaluating the anti-MM effects of vismodegib in combination with carfilzomib may be warranted. Interestingly, the mechanism behind the chemosensitivity is presumably related to the observation that vismodegib is also an inhibitor of ABCB1 [74]. As with other ABCB1 inhibitors, one concern is whether it would be possible to achieve a therapeutic range without significant normal tissue toxicity [50,53,55,56,58]. By comparison, we found that 2-methoxyestradiol exhibited significant cytotoxic activity on carfilzomib-resistant RPMI-8226/Dox40 cells as a single agent. Similar to the ABCB1 substrate doxorubicin and the first-in-class proteasome inhibitor bortezomib which are used to treat MM [70], 2-methoxyestradiol is an inhibitor of HIF1α [61]. Indeed, 2-methoxyestradiol, was previously reported to overcome drug resistance in other MM cell culture models (such as dexamethasone-resistant MM1.S cells, where ADM was one of the genes downregulated in response to treatment) [75]. However, the drug demonstrated poor bioavailability in clinical trials [76]. Collectively, the findings suggest that further consideration be given to the development of new 2-methoxyestradiol derivatives with improved metabolic stability for evaluation in relapsed/refractory MM [77].
A number of GEP-based prognostic signatures for overall survival of MM patients have been published [36–39]. Notably, overlap between the signatures is limited. With the exception of those based solely on proliferation, only 1 to 2 genes are present in any two pairwise comparisons (see Fig. S3 of ref. [78] for a list of the overlapping genes present in 8 GEP signatures). It is noteworthy therefore that 3 genes identified as ABCB1 neighbors in NCI-H929—ASPM, KIF14 and TMPO—are present in several prognostic signatures for high-risk MM [36–39]. In particular, as noted above, all 3 genes are included in the UAMS-17 gene-risk model [36]. Using this prognostic signature, Shaughnessy et al. were able to separate out those t(4;14) MM patients with poor prognosis into a ‘higher-risk’ subgroup [36]. It will be of interest to determine whether combining a minimal ABCB1 neighbor model comprising ASPM, KIF14 and TMPO with the CDy1 efflux assay can be used to identify high-risk MM patients who might otherwise be characterized as having low-risk disease (Fig. S4).
As mentioned in the Introduction, contradictory results have been obtained regarding the phenotype of the proposed CSC-like tumor-propagating cells in MM [8]. In view of the documented selectivity of CDy1 as a pluripotent stem cell fluorescent probe [13,14], it was notable that a large percentage of the genes differentially expressed in the CDy1-hi/ABCB1-lo subpopulation of NCI-H929 cells (30/47) are direct targets of transcription factors expressed in embryonic stem cells (Table S3B). In particular, increased expression of TCF7L1 (also known as TCF3), one of the core transcription factors that maintains the pluripotent state of embryonic stem cells [15,16], was found in this gene set. Additionally, we detected an ~1.5-fold increase in expression of two other core pluripotency-associated genes, POU5F1(OCT3/4) and NANOG, in the CDy1-hi/ABCB1-lo subpopulation by qRT-PCR (data not shown). Two other groups have reported that POU5F1(OCT3/4) and NANOG are more highly expressed in putative MM CSCs identified by the SP assay or by ALDH activity [79,80]. Therefore, a potential relationship between CDy1-hi and CSC-like cells in MM, which was the initial motivation for this study, merits further investigation.
Supplementary Material
Acknowledgments
We thank Nadeem Tabbara for technical assistance; and we are grateful to Drs. Michio Kawano, William Dalton and Leif Bergsagel for providing the KMS-5, RPMI-8226/Dox40 and KMS-34 cell lines, respectively. This work was supported by a Grant from the Dr. Cyrus and Myrtle Katzen Cancer Research Center at The George Washington University (R.G.H.); by a Pilot Project Award from the Clinical and Translational Science Institute at Children’s National Medical Center NIH Grant UL1RR031988 (I.R.); and by NIH Grants R01HL65519 and R01HL66305, a King Fahd Endowment and Dean’s Funds from The George Washington University School of Medicine (R.G.H.).
References
- 1.Mahindra A, Laubach J, Raje N, et al. Latest advances and current challenges in the treatment of multiple myeloma. Nat Rev Clin Oncol. 2012;9:135–143. doi: 10.1038/nrclinonc.2012.15. [DOI] [PubMed] [Google Scholar]
- 2.Visvader JE, Lindeman GJ. Cancer stem cells: current status and evolving complexities. Cell Stem Cell. 2012;10:717–728. doi: 10.1016/j.stem.2012.05.007. [DOI] [PubMed] [Google Scholar]
- 3.Hamburger A, Salmon SE. Primary bioassay of human myeloma stem cells. J Clin Invest. 1977;60:846–854. doi: 10.1172/JCI108839. [DOI] [PMC free article] [PubMed] [Google Scholar]
- 4.Kastan MB, Schlaffer E, Russo JE, et al. Direct demonstration of elevated aldehyde dehydrogenase in human hematopoietic progenitor cells. Blood. 1990;75:1947–1950. [PubMed] [Google Scholar]
- 5.Tang L, Bergevoet SM, Gilissen C, et al. Hematopoietic stem cells exhibit a specific ABC transporter gene expression profile clearly distinct from other stem cells. BMC Pharmacol. 2010;10:12. doi: 10.1186/1471-2210-10-12. [DOI] [PMC free article] [PubMed] [Google Scholar]
- 6.Moitra K, Lou H, Dean M. Multidrug efflux pumps and cancer stem cells: insights into multidrug resistance and therapeutic development. Clin Pharmacol Ther. 2011;89:491–502. doi: 10.1038/clpt.2011.14. [DOI] [PubMed] [Google Scholar]
- 7.Alison MR, Lin WR, Lim SM, et al. Cancer stem cells: in the line of fire. Cancer Treat Rev. 2012;38:589–598. doi: 10.1016/j.ctrv.2012.03.003. [DOI] [PubMed] [Google Scholar]
- 8.Hawley RG. The cancer stem cell conundrum in multiple myeloma. J Stem Cell Res Ther. 2012;2:1000e110. [Google Scholar]
- 9.Goodell MA, Brose K, Paradis G, et al. Isolation and functional properties of murine hematopoietic stem cells that are replicating in vivo. J Exp Med. 1996;183:1797–1806. doi: 10.1084/jem.183.4.1797. [DOI] [PMC free article] [PubMed] [Google Scholar]
- 10.Eaker SS, Hawley TS, Ramezani A, et al. Detection and enrichment of hematopoietic stem cells by side population phenotype. In: Hawley TS, Hawley RG, editors. Flow Cytometry Protocols. 2. Totowa, N.J: Humana Press, Inc; 2004. pp. 161–180. [DOI] [PubMed] [Google Scholar]
- 11.Matsui W, Wang Q, Barber JP, et al. Clonogenic multiple myeloma progenitors, stem cell properties, and drug resistance. Cancer Res. 2008;68:190–197. doi: 10.1158/0008-5472.CAN-07-3096. [DOI] [PMC free article] [PubMed] [Google Scholar]
- 12.Jakubikova J, Adamia S, Kost-Alimova M, et al. Lenalidomide targets clonogenic side population in multiple myeloma: pathophysiologic and clinical implications. Blood. 2011;117:4409–4419. doi: 10.1182/blood-2010-02-267344. [DOI] [PMC free article] [PubMed] [Google Scholar]
- 13.Im CN, Kang NY, Ha HH, et al. A fluorescent rosamine compound selectively stains pluripotent stem cells. Angew Chem Int Ed Engl. 2010;49:7497–7500. doi: 10.1002/anie.201002463. [DOI] [PubMed] [Google Scholar]
- 14.Kang NY, Yun SW, Ha HH, et al. Embryonic and induced pluripotent stem cell staining and sorting with the live-cell fluorescence imaging probe CDy1. Nat Protoc. 2011;6:1044–1052. doi: 10.1038/nprot.2011.350. [DOI] [PubMed] [Google Scholar]
- 15.Ben-Porath I, Thomson MW, Carey VJ, et al. An embryonic stem cell-like gene expression signature in poorly differentiated aggressive human tumors. Nat Genet. 2008;40:499–507. doi: 10.1038/ng.127. [DOI] [PMC free article] [PubMed] [Google Scholar]
- 16.Kim J, Woo AJ, Chu J, et al. A Myc network accounts for similarities between embryonic stem and cancer cell transcription programs. Cell. 2010;143:313–324. doi: 10.1016/j.cell.2010.09.010. [DOI] [PMC free article] [PubMed] [Google Scholar]
- 17.Chng WJ, Huang GF, Chung TH, et al. Clinical and biological implications of MYC activation: a common difference between MGUS and newly diagnosed multiple myeloma. Leukemia. 2011;25:1026–1035. doi: 10.1038/leu.2011.53. [DOI] [PMC free article] [PubMed] [Google Scholar]
- 18.Namba M, Ohtsuki T, Mori M, et al. Establishment of five human myeloma cell lines. In Vitro Cell Dev Biol. 1989;25:723–729. doi: 10.1007/BF02623725. [DOI] [PubMed] [Google Scholar]
- 19.Huang N, Kawano MM, Harada H, et al. Heterogeneous expression of a novel MPC-1 antigen on myeloma cells: possible involvement of MPC-1 antigen in the adhesion of mature myeloma cells to bone marrow stromal cells. Blood. 1993;82:3721–3729. [PubMed] [Google Scholar]
- 20.Dalton WS, Durie BG, Alberts DS, et al. Characterization of a new drug-resistant human myeloma cell line that expresses P-glycoprotein. Cancer Res. 1986;46:5125–5130. [PubMed] [Google Scholar]
- 21.Keats JJ, Fonseca R, Chesi M, et al. Promiscuous mutations activate the noncanonical NF-κB pathway in multiple myeloma. Cancer Cell. 2007;12:131–144. doi: 10.1016/j.ccr.2007.07.003. [DOI] [PMC free article] [PubMed] [Google Scholar]
- 22.Hawley RG, Ramezani A, Hawley TS. Hematopoietic stem cells. Methods Enzymol. 2006;419:149–179. doi: 10.1016/S0076-6879(06)19007-2. [DOI] [PMC free article] [PubMed] [Google Scholar]
- 23.Storms RW, Trujillo AP, Springer JB, et al. Isolation of primitive human hematopoietic progenitors on the basis of aldehyde dehydrogenase activity. Proc Natl Acad Sci USA. 1999;96:9118–9123. doi: 10.1073/pnas.96.16.9118. [DOI] [PMC free article] [PubMed] [Google Scholar]
- 24.Ni T, Corcoran DL, Rach EA, et al. A paired-end sequencing strategy to map the complex landscape of transcription initiation. Nat Methods. 2010;7:521–527. doi: 10.1038/nmeth.1464. [DOI] [PMC free article] [PubMed] [Google Scholar]
- 25.Langmead B, Trapnell C, Pop M, et al. Ultrafast and memory-efficient alignment of short DNA sequences to the human genome. Genome Biol. 2009;10:R25. doi: 10.1186/gb-2009-10-3-r25. [DOI] [PMC free article] [PubMed] [Google Scholar]
- 26.Lee S, Seo CH, Lim B, et al. Accurate quantification of transcriptome from RNA-Seq data by effective length normalization. Nucleic Acids Res. 2011;39:e9. doi: 10.1093/nar/gkq1015. [DOI] [PMC free article] [PubMed] [Google Scholar]
- 27.Robinson MD, McCarthy DJ, Smyth GK. edgeR: a Bioconductor package for differential expression analysis of digital gene expression data. Bioinformatics. 2010;26:139–140. doi: 10.1093/bioinformatics/btp616. [DOI] [PMC free article] [PubMed] [Google Scholar]
- 28.Riz I, Akimov SS, Eaker SS, et al. TLX1/HOX11-induced hematopoietic differentiation blockade. Oncogene. 2007;26:4115–4123. doi: 10.1038/sj.onc.1210185. [DOI] [PMC free article] [PubMed] [Google Scholar]
- 29.Riz I, Hawley TS, Johnston H, et al. Role of TLX1 in T-cell acute lymphoblastic leukaemia pathogenesis. Br J Haematol. 2009;145:140–143. doi: 10.1111/j.1365-2141.2008.07556.x. [DOI] [PMC free article] [PubMed] [Google Scholar]
- 30.Kartner N, Riordan JR, Ling V. Cell surface P-glycoprotein associated with multidrug resistance in mammalian cell lines. Science. 1983;221:1285–1288. doi: 10.1126/science.6137059. [DOI] [PubMed] [Google Scholar]
- 31.Wirths S, Lanzavecchia A. ABCB1 transporter discriminates human resting naive B cells from cycling transitional and memory B cells. Eur J Immunol. 2005;35:3433–3441. doi: 10.1002/eji.200535364. [DOI] [PubMed] [Google Scholar]
- 32.Dalton WS, Grogan TM, Rybski JA, et al. Immunohistochemical detection and quantitation of P-glycoprotein in multiple drug-resistant human myeloma cells: association with level of drug resistance and drug accumulation. Blood. 1989;73:747–752. [PubMed] [Google Scholar]
- 33.Sharom FJ, Yu X, Lu P, et al. Interaction of the P-glycoprotein multidrug transporter (MDR1) with high affinity peptide chemosensitizers in isolated membranes, reconstituted systems, and intact cells. Biochem Pharmacol. 1999;58:571–586. doi: 10.1016/s0006-2952(99)00139-2. [DOI] [PubMed] [Google Scholar]
- 34.Chesi M, Nardini E, Lim RS, et al. The t(4;14) translocation in myeloma dysregulates both FGFR3 and a novel gene, MMSET, resulting in IgH/MMSET hybrid transcripts. Blood. 1998;92:3025–3034. [PubMed] [Google Scholar]
- 35.Kalff A, Spencer A. The t(4;14) translocation and FGFR3 overexpression in multiple myeloma: prognostic implications and current clinical strategies. Blood Cancer J. 2012;2:e89. doi: 10.1038/bcj.2012.37. [DOI] [PMC free article] [PubMed] [Google Scholar]
- 36.Shaughnessy JD, Jr, Zhan F, Burington BE, et al. A validated gene expression model of high-risk multiple myeloma is defined by deregulated expression of genes mapping to chromosome 1. Blood. 2007;109:2276–2284. doi: 10.1182/blood-2006-07-038430. [DOI] [PubMed] [Google Scholar]
- 37.Zhan F, Huang Y, Colla S, et al. The molecular classification of multiple myeloma. Blood. 2006;108:2020–2028. doi: 10.1182/blood-2005-11-013458. [DOI] [PMC free article] [PubMed] [Google Scholar]
- 38.Hose D, Reme T, Hielscher T, et al. Proliferation is a central independent prognostic factor and target for personalized and risk-adapted treatment in multiple myeloma. Haematologica. 2011;96:87–95. doi: 10.3324/haematol.2010.030296. [DOI] [PMC free article] [PubMed] [Google Scholar]
- 39.Agnelli L, Forcato M, Ferrari F, et al. The reconstruction of transcriptional networks reveals critical genes with implications for clinical outcome of multiple myeloma. Clin Cancer Res. 2011;17:7402–7412. doi: 10.1158/1078-0432.CCR-11-0596. [DOI] [PubMed] [Google Scholar]
- 40.Hose D, Moreaux J, Meissner T, et al. Induction of angiogenesis by normal and malignant plasma cells. Blood. 2009;114:128–143. doi: 10.1182/blood-2008-10-184226. [DOI] [PubMed] [Google Scholar]
- 41.Martin SK, Diamond P, Williams SA, et al. Hypoxia-inducible factor-2 is a novel regulator of aberrant CXCL12 expression in multiple myeloma plasma cells. Haematologica. 2010;95:776–784. doi: 10.3324/haematol.2009.015628. [DOI] [PMC free article] [PubMed] [Google Scholar]
- 42.Wang YD, De Vos J, Jourdan M, et al. Cooperation between heparin-binding EGF-like growth factor and interleukin-6 in promoting the growth of human myeloma cells. Oncogene. 2002;21:2584–2592. doi: 10.1038/sj.onc.1205355. [DOI] [PubMed] [Google Scholar]
- 43.Mahtouk K, Jourdan M, De Vos J, et al. An inhibitor of the EGF receptor family blocks myeloma cell growth factor activity of HB-EGF and potentiates dexamethasone or anti-IL-6 antibody-induced apoptosis. Blood. 2004;103:1829–1837. doi: 10.1182/blood-2003-05-1510. [DOI] [PMC free article] [PubMed] [Google Scholar]
- 44.Ongusaha PP, Kwak JC, Zwible AJ, et al. HB-EGF is a potent inducer of tumor growth and angiogenesis. Cancer Res. 2004;64:5283–5290. doi: 10.1158/0008-5472.CAN-04-0925. [DOI] [PubMed] [Google Scholar]
- 45.Colla S, Tagliaferri S, Morandi F, et al. The new tumor-suppressor gene inhibitor of growth family member 4 (ING4) regulates the production of proangiogenic molecules by myeloma cells and suppresses hypoxia-inducible factor-1 alpha (HIF-1alpha) activity: involvement in myeloma-induced angiogenesis. Blood. 2007;110:4464–4475. doi: 10.1182/blood-2007-02-074617. [DOI] [PubMed] [Google Scholar]
- 46.Comerford KM, Wallace TJ, Karhausen J, et al. Hypoxia-inducible factor-1-dependent regulation of the multidrug resistance (MDR1) gene. Cancer Res. 2002;62:3387–3394. [PubMed] [Google Scholar]
- 47.Azab AK, Hu J, Quang P, et al. Hypoxia promotes dissemination of multiple myeloma through acquisition of epithelial to mesenchymal transition-like features. Blood. 2012;119:5782–5794. doi: 10.1182/blood-2011-09-380410. [DOI] [PMC free article] [PubMed] [Google Scholar]
- 48.Keats JJ, Chesi M, Egan JB, et al. Clonal competition with alternating dominance in multiple myeloma. Blood. 2012;120:1067–1076. doi: 10.1182/blood-2012-01-405985. [DOI] [PMC free article] [PubMed] [Google Scholar]
- 49.Mootha VK, Lindgren CM, Eriksson KF, et al. PGC-1α-responsive genes involved in oxidative phosphorylation are coordinately downregulated in human diabetes. Nat Genet. 2003;34:267–273. doi: 10.1038/ng1180. [DOI] [PubMed] [Google Scholar]
- 50.Dalton WS, Grogan TM, Meltzer PS, et al. Drug-resistance in multiple myeloma and non-Hodgkin’s lymphoma: detection of P-glycoprotein and potential circumvention by addition of verapamil to chemotherapy. J Clin Oncol. 1989;7:415–424. doi: 10.1200/JCO.1989.7.4.415. [DOI] [PubMed] [Google Scholar]
- 51.Epstein J, Xiao HQ, Oba BK. P-glycoprotein expression in plasma-cell myeloma is associated with resistance to VAD. Blood. 1989;74:913–917. [PubMed] [Google Scholar]
- 52.Salmon SE, Grogan TM, Miller T, et al. Prediction of doxorubicin resistance in vitro in myeloma, lymphoma, and breast cancer by P-glycoprotein staining. J Natl Cancer Inst. 1989;81:696–701. doi: 10.1093/jnci/81.9.696. [DOI] [PubMed] [Google Scholar]
- 53.Salmon SE, Dalton WS, Grogan TM, et al. Multidrug-resistant myeloma: laboratory and clinical effects of verapamil as a chemosensitizer. Blood. 1991;78:44–50. [PubMed] [Google Scholar]
- 54.Grogan TM, Spier CM, Salmon SE, et al. P-glycoprotein expression in human plasma cell myeloma: correlation with prior chemotherapy. Blood. 1993;81:490–495. [PubMed] [Google Scholar]
- 55.Hofmeister CC, Yang X, Pichiorri F, et al. Phase I trial of lenalidomide and CCI-779 in patients with relapsed multiple myeloma: evidence for lenalidomide-CCI-779 interaction via P-glycoprotein. J Clin Oncol. 2011;29:3427–3434. doi: 10.1200/JCO.2010.32.4962. [DOI] [PMC free article] [PubMed] [Google Scholar]
- 56.Takahashi N, Miura M, Kameoka Y, et al. Drug interaction between lenalidomide and itraconazole. Am J Hematol. 2012;87:338–339. doi: 10.1002/ajh.22260. [DOI] [PubMed] [Google Scholar]
- 57.Futscher BW, Blake LL, Gerlach JH, et al. Quantitative polymerase chain reaction analysis of mdr1 mRNA in multiple myeloma cell lines and clinical specimens. Anal Biochem. 1993;213:414–421. doi: 10.1006/abio.1993.1440. [DOI] [PubMed] [Google Scholar]
- 58.Cripe LD, Uno H, Paietta EM, et al. Zosuquidar, a novel modulator of P-glycoprotein, does not improve the outcome of older patients with newly diagnosed acute myeloid leukemia: a randomized, placebo-controlled trial of the Eastern Cooperative Oncology Group 3999. Blood. 2010;116:4077–4085. doi: 10.1182/blood-2010-04-277269. [DOI] [PMC free article] [PubMed] [Google Scholar]
- 59.Martin SK, Diamond P, Gronthos S, et al. The emerging role of hypoxia, HIF-1 and HIF-2 in multiple myeloma. Leukemia. 2011;25:1533–1542. doi: 10.1038/leu.2011.122. [DOI] [PubMed] [Google Scholar]
- 60.Treins C, Murdaca J, Van Obberghen E, et al. AMPK activation inhibits the expression of HIF-1α induced by insulin and IGF-1. Biochem Biophys Res Commun. 2006;342:1197–1202. doi: 10.1016/j.bbrc.2006.02.088. [DOI] [PubMed] [Google Scholar]
- 61.Mabjeesh NJ, Escuin D, LaVallee TM, et al. 2ME2 inhibits tumor growth and angiogenesis by disrupting microtubules and dysregulating HIF. Cancer Cell. 2003;3:363–375. doi: 10.1016/s1535-6108(03)00077-1. [DOI] [PubMed] [Google Scholar]
- 62.Doublier S, Belisario DC, Polimeni M, et al. HIF-1 activation induces doxorubicin resistance in MCF7 3-D spheroids via P-glycoprotein expression: a potential model of the chemo-resistance of invasive micropapillary carcinoma of the breast. BMC Cancer. 2012;12:4. doi: 10.1186/1471-2407-12-4. [DOI] [PMC free article] [PubMed] [Google Scholar]
- 63.Barretina J, Caponigro G, Stransky N, et al. The Cancer Cell Line Encyclopedia enables predictive modelling of anticancer drug sensitivity. Nature. 2012;483:603–607. doi: 10.1038/nature11003. [DOI] [PMC free article] [PubMed] [Google Scholar]
- 64.Zhao XQ, Xie JD, Chen XG, et al. Neratinib reverses ATP-binding cassette B1-mediated chemotherapeutic drug resistance in vitro, in vivo and ex vivo. Mol Pharmacol. 2012;82:47–58. doi: 10.1124/mol.111.076299. [DOI] [PMC free article] [PubMed] [Google Scholar]
- 65.Onishi H, Kai M, Odate S, et al. Hypoxia activates the hedgehog signaling pathway in a ligand-independent manner by upregulation of Smo transcription in pancreatic cancer. Cancer Sci. 2011;102:1144–1150. doi: 10.1111/j.1349-7006.2011.01912.x. [DOI] [PubMed] [Google Scholar]
- 66.Romer JT, Kimura H, Magdaleno S, et al. Suppression of the Shh pathway using a small molecule inhibitor eliminates medulloblastoma in Ptc1+/− p53−/− mice. Cancer Cell. 2004;6:229–240. doi: 10.1016/j.ccr.2004.08.019. [DOI] [PubMed] [Google Scholar]
- 67.Gutman D, Morales AA, Boise LH. Acquisition of a multidrug-resistant phenotype with a proteasome inhibitor in multiple myeloma. Leukemia. 2009;23:2181–2183. doi: 10.1038/leu.2009.123. [DOI] [PMC free article] [PubMed] [Google Scholar]
- 68.Ao L, Wu Y, Kim D, et al. Development of peptide-based reversing agents for P-glycoprotein-mediated resistance to carfilzomib. Mol Pharm. 2012 Jul 13; doi: 10.1021/mp300044b. [Epub ahead of print] [DOI] [PMC free article] [PubMed] [Google Scholar]
- 69.Verbrugge SE, Assaraf YG, Dijkmans BA, et al. Inactivating PSMB5 mutations and P-glycoprotein (multidrug resistance-associated protein/ATP-binding cassette B1) mediate resistance to proteasome inhibitors: ex vivo efficacy of (immuno)proteasome inhibitors in mononuclear blood cells from patients with rheumatoid arthritis. J Pharmacol Exp Ther. 2012;341:174–182. doi: 10.1124/jpet.111.187542. [DOI] [PubMed] [Google Scholar]
- 70.Semenza GL. Hypoxia-inducible factors: mediators of cancer progression and targets for cancer therapy. Trends Pharmacol Sci. 2012;33:207–214. doi: 10.1016/j.tips.2012.01.005. [DOI] [PMC free article] [PubMed] [Google Scholar]
- 71.Peacock CD, Wang Q, Gesell GS, et al. Hedgehog signaling maintains a tumor stem cell compartment in multiple myeloma. Proc Natl Acad Sci USA. 2007;104:4048–4053. doi: 10.1073/pnas.0611682104. [DOI] [PMC free article] [PubMed] [Google Scholar]
- 72.Blotta S, Jakubikova J, Calimeri T, et al. Canonical and non canonical Hedgehog pathway in the pathogenesis of multiple myeloma. Blood. 2012 Jul 20; doi: 10.1182/blood-2011-07-368142. [Epub ahead of print] [DOI] [PMC free article] [PubMed] [Google Scholar]
- 73.Lin TL, Matsui W. Hedgehog pathway as a drug target: Smoothened inhibitors in development. Onco Targets Ther. 2012;5:47–58. doi: 10.2147/OTT.S21957. [DOI] [PMC free article] [PubMed] [Google Scholar]
- 74.Zhang Y, Laterra J, Pomper MG. Hedgehog pathway inhibitor HhAntag691 is a potent inhibitor of ABCG2/BCRP and ABCB1/Pgp. Neoplasia. 2009;11:96–101. doi: 10.1593/neo.81264. [DOI] [PMC free article] [PubMed] [Google Scholar]
- 75.Chauhan D, Li G, Auclair D, et al. Identification of genes regulated by 2-methoxyestradiol (2ME2) in multiple myeloma cells using oligonucleotide arrays. Blood. 2003;101:3606–3614. doi: 10.1182/blood-2002-10-3146. [DOI] [PubMed] [Google Scholar]
- 76.Rajkumar SV, Richardson PG, Lacy MQ, et al. Novel therapy with 2-methoxyestradiol for the treatment of relapsed and plateau phase multiple myeloma. Clin Cancer Res. 2007;13:6162–6167. doi: 10.1158/1078-0432.CCR-07-0807. [DOI] [PubMed] [Google Scholar]
- 77.Zhou Q, Gustafson D, Nallapareddy S, et al. A phase I dose-escalation, safety and pharmacokinetic study of the 2-methoxyestradiol analog ENMD-1198 administered orally to patients with advanced cancer. Invest New Drugs. 2011;29:340–346. doi: 10.1007/s10637-009-9383-9. [DOI] [PMC free article] [PubMed] [Google Scholar]
- 78.Kuiper R, Broyl A, de Knegt Y, et al. A gene expression signature for high-risk multiple myeloma. Leukemia. 2012;26:2406–2413. doi: 10.1038/leu.2012.127. [DOI] [PubMed] [Google Scholar]
- 79.Brennan SK, Wang Q, Tressler R, et al. Telomerase inhibition targets clonogenic multiple myeloma cells through telomere length-dependent and independent mechanisms. PLoS One. 2010;5 doi: 10.1371/journal.pone.0012487. [DOI] [PMC free article] [PubMed] [Google Scholar]
- 80.Ikegame A, Ozaki S, Tsuji D, et al. Small molecule antibody targeting HLA class I inhibits myeloma cancer stem cells by repressing pluripotency-associated transcription factors. Leukemia. 2012;26:2124–2134. doi: 10.1038/leu.2012.78. [DOI] [PubMed] [Google Scholar]
Associated Data
This section collects any data citations, data availability statements, or supplementary materials included in this article.