Abstract
As a canalicular bile acid effluxer, bile salt export pump (BSEP) plays a vital role in maintaining bile acid homeostasis. BSEP deficiency leads to severe cholestasis and hepatocellular carcinoma (HCC) in young children. Regardless of the etiology, chronic inflammation is the common pathological process for HCC development. Clinical studies showed that bile acid homeostasis is disrupted in HCC patients with elevated serum bile acid level as a proposed marker for HCC. However, the underlying mechanisms remain largely unknown. In this study, we found that BSEP expression was severely diminished in HCC tissues and markedly reduced in adjacent non-tumor tissues. In contrast to mouse, human BSEP was regulated by farnesoid x receptor (FXR) in an isoform-dependent manner. FXRα2 exhibited a much more potent activity than FXRα1 in transactivating human BSEP in vitro and in vivo. The decreased BSEP expression in HCC was associated with altered relative expression of FXRα1 and FXRα2. The FXRα1/FXRα2 ratios were significantly increased with undetectable FXRα2 expression in one third of the HCC tumor samples. Similar correlation between BSEP and FXR isoform expression was confirmed in hepatoma Huh 7 and HepG2 cells. Further studies showed that intrahepatic proinflammatory cytokines interleukin-6 (IL-6) and tumor necrosis factor-alpha (TNF-α) were significantly elevated in HCC tissues. Treatment of Huh 7 cells with IL-6 and TNF-α resulted in a marked increase in the FXRα1/FXRα2 ratio concurrent with a significant decrease in BSEP expression. In conclusion, BSEP expression was severely diminished in HCC patients associated with alteration of FXR isoform expression induced by inflammation, and the restoration of BSEP expression through suppressing inflammation in the liver may re-establish the bile acid homeostasis.
Keywords: BSEP, FXR, HCC, Bile acids, Gene regulation
INTRODUCTION
Bile acid homeostasis is achieved through a tightly regulated enterohepatic circulation, the rate-limiting step of which is canalicular secretion of bile acids through bile salt export pump (BSEP, ABCB11) (1, 2). Modulation of BSEP expression or function by inherited or acquired factors has a profound impact on bile acid homeostasis. The expression of BSEP is coordinately regulated by multiple transactivation pathways (3–7), notably the bile acid/farnesoid x receptor (FXR, NR1H4) signaling pathway (3, 4). Activation of FXR by bile acids strongly induces BSEP expression in vitro and in vivo (3, 4). Such feed-forward regulation of BSEP by FXR is considered a major mechanism for preventing excessive accumulation of toxic bile acids in hepatocytes. Two FXR genes, FXRα and FXRβ, have been identified (8–10). FXRα is functional in all species tested while FXRβ is a pseudogene in humans (10). Alternative promoter and splicing result in four isoforms of FXRα (FXRα1–4) (11, 12) with predominant expression of FXRα1 and FXRα2 in human liver (11). Currently, the pathophysiological significance of FXR isoform-specific regulation remains unknown.
Maintenance of bile acid homeostasis is vital for health and disruption of bile acid balance is associated with various diseases. Many pieces of evidence support a role of excessive intrahepatic bile acids in the development of hepatocellular carcinoma (HCC). Children with a deficiency in BSEP develop severe cholestasis and HCC at early ages (13, 14). Certain genetic variations in BSEP are associated with susceptibility to develop HCC (15). FXR knockout mice (FXR−/−) with dysregulation of BSEP spontaneously developed HCC as they aged (16, 17). It is generally accepted that chronic exposure of hepatocytes to high levels of bile acids contributes to liver tumor development. Indeed, feeding FXR(−/−) mice with a diet containing bile acid strongly promoted N-nitrosodiethylamine-initiated liver tumorigenesis, whereas lowering bile acid pool with a bile acid sequestrant considerably reduced the malignant lesions (16). Thus disruption of bile acid homeostasis due to impairments in BSEP expression may contribute to the pathogenesis of HCC.
HCC is the most common primary liver cancer and one of the leading causes for cancer-related deaths globally. The etiology of HCC mainly includes viral hepatitis (18, 19), alcoholic and nonalcoholic fatty liver disease (20–22), and metabolic syndromes (23, 24). Regardless of the etiology, the common pathological process for HCC development is chronic liver injury and inflammation (25, 26). Clinical studies showed that bile acid levels in serum and urine were significantly elevated with a concurrent decrease in fecal bile acids in HCC patients (27–31), indicating disruption of bile acid homeostasis. Elevated serum bile acid level has been proposed as a clinical marker for HCC (27–30). Currently, the underlying mechanisms for bile acid imbalance in HCC patients are largely unknown.
In this study, we demonstrated that BSEP expression was dysregulated with altered FXR isoform expression in HCC tissues and hepatoma cell lines Huh 7 and HepG2. Transactivation studies in vitro and in vivo established that in contrast to mouse, human BSEP was isoform-specifically regulated by FXR with FXRα2 being the predominant regulator. Additional studies revealed that proinflammatory cytokines IL-6 and TNF-α significantly elevated in HCC tissues and altered the FXRα1/FXRα2 ratio with concurrent deceases in BSEP expression in Huh 7 cells. A potential link from inflammation to disruption of bile acid homeostasis through alteration in the relative expression of FXR isoforms and subsequent BSEP dysregulation was proposed in patients with HCC.
MATERIALS AND METHODS
Reagents and suppliers
Chemicals and reagents for polymerase-chain reaction (PCR), cell culture, transfection, and luciferase assays were described previously (32). Recombinant human FXRα2, IL-1β, IL-6 and TNF-α were purchased from Pierce.
Liver samples
Fourteen healthy human liver samples and 22 HCC tumor (HCC-T) samples with 11 paired adjacent non-tumor (HCC-NT) tissues were obtained from the University of Virginia, University of Pennsylvania and Ohio State University through the Cooperative Human Tissue Network (CHTN). The detailed information on HCC patients was provided in Supplement Table 1 and 2. The protocol for using human tissues was approved by the Institutional Review Board (IRB) at the University of Rhode Island (URI).
Plasmid constructs
Human and mouse BSEP promoter reporters, phBSEP(−2.6kb) and pmBSEP(−2.6kb), were prepared as described previously (6, 32). Expression plasmids for human FXRα2 and FXRα1 were provided by Dr. Matthew Stoner and Dr. David Mangelsdorf (University of Texas Southwestern Medical Center).
Reporter luciferase assay
The reporter luciferase activity assays were carried out in Huh 7 cells in a 24-well plate format and the luciferase activities were detected with a Dual-Luciferase Reporter Assay as described (33).
Living imaging with in vivo imaging system (IVIS)
Eighteen CD-1 female mice were obtained from Charles River Laboratory and randomly divided into three groups. Mice were injected with 5μg phBSEP(−2.6kb) and either 5μg FXRα1, FXRα2 or pcDNA5 vector, respectively and subjected to IVIS 100 Living Imaging detection with a exposure time of 45 seconds. The study was approved by the Institutional Animal Care and Use Committees (IACUC) at URI.
Quantitative real-time PCR
Total RNA preparation from liver samples, Huh 7 and HepG2 cells, cDNA synthesis and TaqMan real-time PCR were carried out as described (33). Transcript levels of FXR, BSEP, IL-1β, IL-6 and TNFα were normalized against glyceraldehyde-3-phosphate dehydrogenase (GAPDH) levels.
Semi-quantification of FXRα1 and FXRα2 expression
A 600bp fragment encompassing the 12- nucleotides inserted in FXRα1 was amplified with a sense primer 5′-TGTGGAGACAGAGCCTCTGGATACCACTATAATGC-3′ and an antisense primer 5′-GAACATAGCTTCAACCGCAGACCCTTTCAGCAAG-3′. The PCR products were equally divided into three tubes and completely digested with BstZ 17I, Bsm I or buffer only, followed by separating the DNA fragments on 1.5% agarose gel and quantified.
Cytokine treatment
Huh 7 cells were treated with 30ng/ml of IL-1β, IL-6 or TNFα in a medium containing 1% dislipidated FBS (Invitrogen) for 48h. Total cellular RNA was extracted and cDNA was synthesized, followed by quantification of total FXR, FXRα1, FXRα2 and BSEP expression.
Western blotting
Crude membrane fractions from liver tissues were prepared as described (34). Membrane fractions containing 25μg of total proteins were loaded into each well. After transfer, the membrane was split with the top portion blotted for BSEP (~175kD) with an anti-human BSEP mAb (sc- 74500, Santa Cruz Biotechnologies) and the bottom portion blotted for GAPDH (35kD) with the rabbit anti-human GAPDH polyclonal antibodies (G9545, Sigma-Aldrich). FXR detection in FXRα1 or FXRα2-transfected cells or mouse livers was performed using mouse anti-human FXR mAb (H00009971-M02, Abnova). The expression levels of GAPDH were used to normalize BSEP or FXR expression.
Two-dimension electrophoresis followed by Western blot (2DWB)
Nuclear extracts from human liver tissues and HepG2 cells were used to detect FXRα1 and FXRα2 according to the protocol provided in Supplement Fig. 1.
Mass spectrometry (MS)
Nuclear extracts from human liver tissues and HepG2 cells were applied to MS to detect FXRα1 and FXRα2 protein. The detailed protocol was provided in the Supplement Fig. 2.
Statistic analysis
Student t-test was applied to pair-wise comparison for normally distributed data. Non-parametric Mann-Whitney test was used for pair-wise comparison for non-normally distributed data. P value of 0.05 or lower was considered statistically significant.
RESULTS
BSEP expression was dramatically decreased in HCC tissues
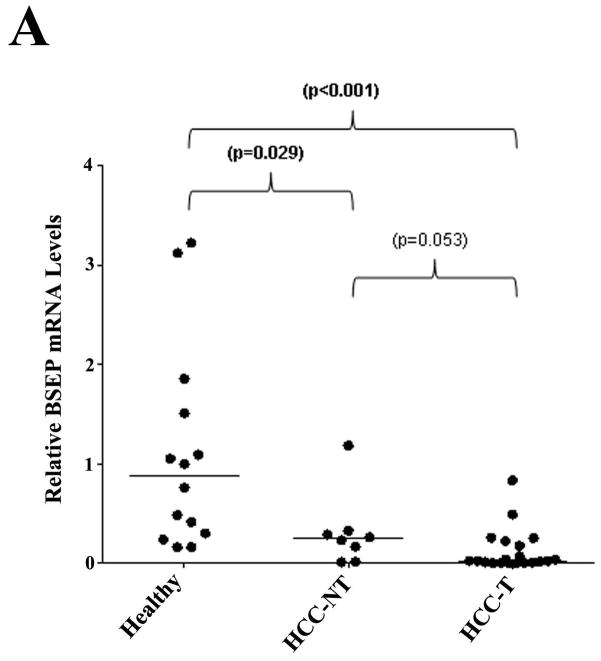
Previous studies showed that bile acid levels increased in the serum and urine and decreased in fecal excretion in HCC patients (27–31). We therefore hypothesized that BSEP transcription was dysregulated in patients with HCC. To test the hypothesis, BSEP mRNA levels were quantitatively determined in liver samples from HCC patients and healthy subjects. As shown in Fig. 1A, when compared with healthy controls, the level of BSEP mRNA was significantly reduced in both HCC tumor (HCC-T) and adjacent non-tumor (HCC-NT) tissues. The median level of BSEP mRNA decreased by 72% and 97% in HCC-NT (p=0.029) and HCC-T (p<0.001) samples, respectively. No statistical significance was detected between HCC-NT and HCC-T (p=0.053). The data demonstrated that BSEP transcription was severely dysregulated in HCC patients.
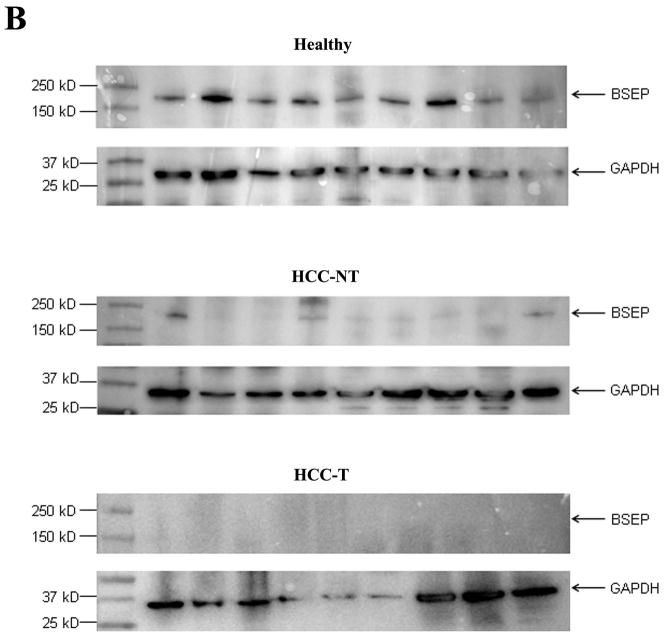
Fig. 1. BSEP expression was markedly decreased in HCC tissues.
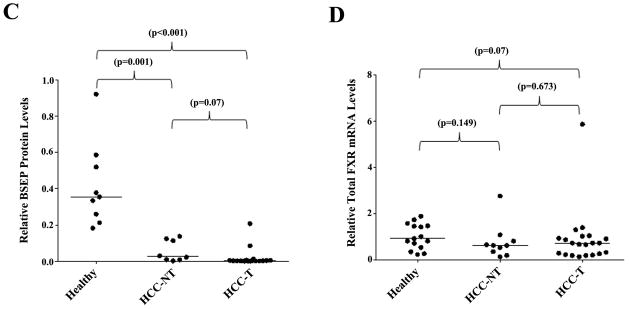
(A) Expression levels of BSEP mRNA, (B, C) BSEP protein, and (D) total FXR mRNA in healthy, HCC tumors (HCC-T) and paired adjacent non-tumor (HCC-NT) tissues. BSEP and total FXR mRNA levels were quantified by TaqMan real-time PCR with GAPDH levels as internal standards. BSEP protein levels were detected by Western blot and normalized with GAPDH levels on the same blot. The median value of each group was indicated by a short line. Non-parametric Mann-Whitney test was used for pair-wise comparison.
To determine whether the transcriptional dysregulation of BSEP in HCC patients correlates with BSEP protein expression, Western blotting was performed to quantify BSEP protein in all liver samples. As shown in Fig. 1B and 1C, compared with healthy subjects, BSEP protein levels dramatically decreased in HCC-NT (p=0.001) and HCC-T (p<0.001) samples. The median levels of expression decreased by 97% and 99% in HCC-NT and HCC-T samples, respectively. Almost no BSEP protein was detected in any HCC-T samples. It was thus concluded that BSEP expression severely diminished in HCC patients. It should be noted that such diminished expression of BSEP did not result from decreased FXR expression as no statistically significant changes in total FXR expression were detected among the groups (Fig. 1D), suggesting other underlying mechanisms.
Isoform-dependent transactivation of human BSEP by FXR in vitro
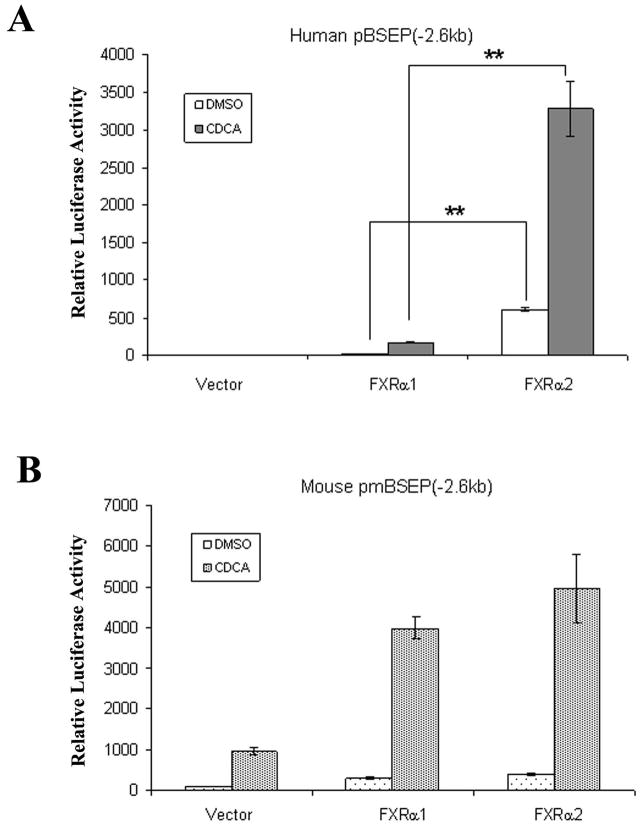
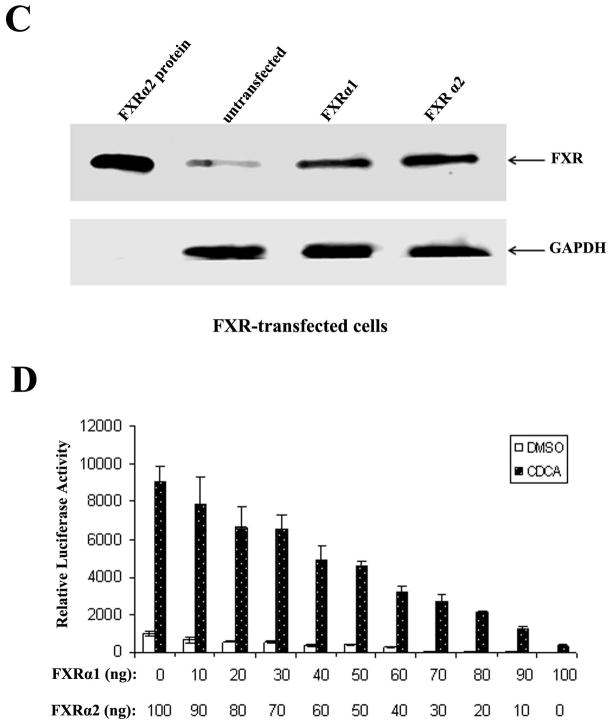
FXRα1 and FXRα2 are predominant isoforms expressed in human liver (11). A previous study showed that mouse ileal bile acid-binding protein was regulated differently by FXRα1 and FXRα2, while regulation of mouse BSEP by FXRα1 and FXRα2 displayed little disparities (12). To determine whether human BSEP is transcriptionally regulated by FXR in an isoform-specific manner, human BSEP promoter reporter, phBSEP(−2.6kb), was cotransfected into Huh 7 cells with FXRα1 or FXRα2. Mouse BSEP promoter reporter, pmBSEP(−2.6kb), was included in the experiments as a control. As shown in Fig. 2A, FXRα2 exhibited over 20 fold higher activity than FXRα1 in transactivating human BSEP. In contrast, FXRα1 and FXRα2 exhibited comparable activity with mouse BSEP (Fig. 2B). It should be noted that the observed difference in human BSEP transactivation was not due to the different levels of protein expression from the transfected FXR isoforms (Fig. 2C). The data demonstrated that human BSEP was predominantly regulated by FXRα2. Therefore, in addition to total FXR levels, the relative expression levels of FXRα1 and FXRα2 should play an important role in determining human BSEP expression.
Fig. 2. Isoform-dependent transactivation of human BSEP by FXR in vitro.
(A) FXRα1 and FXRα2-mediated transactivation of human BSEP promoter reporter phBSEP(−2.6kb) and (B) mouse BSEP promoter reporter pmBSEP(−2.6kb) in the presence of vehicle DMSO (0.1%) or CDCA (10μM). The data were presented as mean ± SD of at least three separate experiments. Student’s t-test was applied to pairwise comparison. A double asterisk (**) indicates p<0.001. (C). FXR protein levels were detected with Western blot in FXRα1 or FXRα2-transfected cells. (D) The effects of FXRα1/FXRα2 ratios on human BSEP transactivation.
To demonstrate the effect of FXRα1/FXRα2 ratios on BSEP transactivation, a series of FXRα1 and FXRα2 plasmid DNA in various ratios with a constant total amount of FXR were co-transfected with human BSEP promoter reporter in Huh 7 cells. As shown in Fig. 2D, BSEP transactivation levels gradually decreased as FXRα1/FXRα2 ratios increased. It was thus established that the FXRα1/FXRα2 ratio is a determinant in regulating human BSEP expression.
Isoform-dependent transactivation of BSEP by FXR in vivo in mice
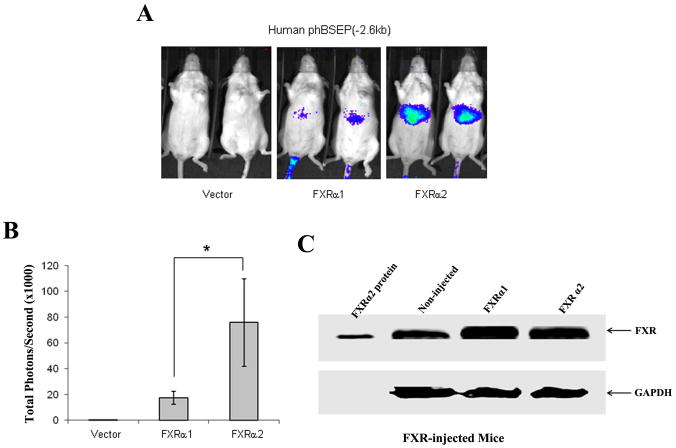
To further confirm the isoform-dependent regulation of human BSEP, we performed an in vivo study in mice using IVIS 100 Living Imaging System. No signal was detected in mice receiving pcDNA5 vector and phBSEP(−2.6kb), indicating that human BSEP transactivation by endogenous mouse FXR is minimal (Fig. 3A). Detectable signals were readily captured in mice co-injected with human FXRα1 and phBSEP(−2.6kb). Much more robust signals were detected in mice co-injected with human FXRα2 and phBSEP(−2.6kb). Quantification of the signals showed that FXRα2-induced human BSEP transactivation was 4.5 times higher than FXRα1 on average (Fig. 3B) with similar levels of FXR protein expression in mice injected with FXRα1 or FXRα2 (Fig. 3C). The data above concluded that human BSEP was regulated by FXR in an isoform-dependent manner both in vitro and in vivo with FXRα2 being the dominant regulator.
Fig. 3. Isoform-dependent transactivation of human BSEP by FXR in vivo in mice.
(A) Three groups of CD-1 female mice received human promoter reporter phBSEP(−2.6kb) and either pcDNA5 vector, FXRα1 or FXRα2 expression plasmid DNA through hydrodynamic tail vein injection. The transactivation levels were detected with IVIS Living Imaging system. Two representative mice from each group were presented. (B) Quantification of total signals (photons) in a fixed area covering the entire liver surface was carried out with Living Imaging Software and presented as mean± SD. The asterisk (*) indicates p<0.05 by the Student’s t-test. (C) FXR protein levels in the liver of FXRα1 or FXRα2-injected mice were detected with Western blot.
FXRα1/FXRα2 ratios were significantly altered in HCC tissues
After demonstrating the isoform-dependent regulation of human BSEP, we investigated whether alteration in relative expression of FXRα1 and FXRα2 is a potential mechanism for BSEP dysregulation in patients with HCC.
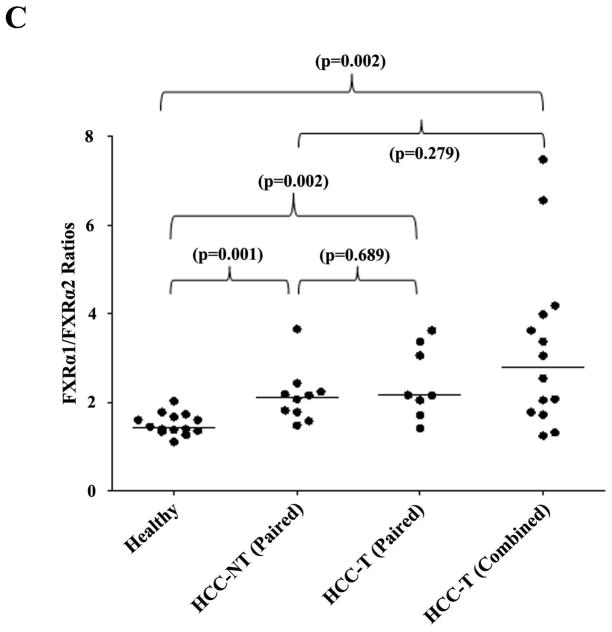
Digestion with restriction enzymes BstZ 17I and Bsm I differentiates the two FXR isoforms (Fig. 4A). The PCR products derived from FXRα1 plasmid templates were completely digested by BstZ 17I, whereas no digestion was observed with Bsm I (Fig. 4B). On the other hand, Bsm I could completely digest the PCR products derived from the FXRα2 plasmid templates, while no digestion was detected with BstZ 17I. In liver samples, the PCR products resistant to either Bsm I or BstZ 17I digestion represent the relative amount of FXRα1 and FXRα2 (Fig. 4B). In healthy subjects, FXRα1 was expressed more abundantly than FXRα2 with a median FXRα1/FXRα2 ratio of 1.4 (Fig. 4C), and such ratio significantly increased to 2.1 (p=0.001) in HCC-NT and 2.8 (p=0.002) in HCC-T samples. More strikingly, the expression of FXRα2 was undetectable in 7 of the 22 HCC-T samples and was therefore not included in Fig. 4C and statistical analysis. The data established that the FXRα1/FXRα2 ratios varied greatly in patients with HCC and that such alteration occurred in both tumor and adjacent non-tumor tissues.
Fig. 4. FXRα1/FXRα2 ratios were significantly increased in HCC tissues.
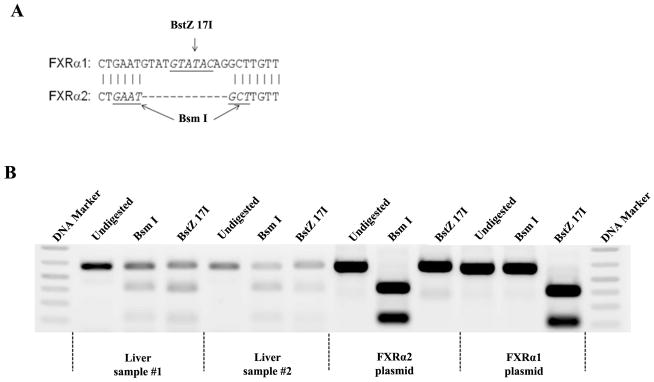
FXRα1 and FXRα2 differ by an insertion of 12 nucleotides in the hinge region in FXRα1 which is absent in FXRα2. A restriction enzyme site for BstZ 17I is located within the inserted 12 nucleotides. Another restriction enzyme site for Bsm I is present in the junction of the insertion in FXRα2 but destroyed by the insertion in FXRα1. Therefore, digestion with BstZ 17I or Bsm I differentiates FXRα1 from FXRα2. (A) Sequence alignment of FXRα1 and FXRα2 in the insertion junction. (B) Results from two representative healthy liver samples and FXRα1 and FXRα2 plasmid controls were presented. PCR fragments (600bp) containing the insertion junction were completely digested with BstZ 17I or Bsm I generating two fragments with sizes of 400bp and 200bp. The intensity of the remaining 600bp bands after digestion with BstZ 17I or Bsm I represented the expression levels of FXRα2 or FXRα1. (C) FXRα1/FXRα2 ratios significantly increased in HCC-NT and HCC-NT samples. The median value of each group was indicated by a short line. Non- parametric Mann-Whitney test was used for pair-wise comparison.
BSEP expression correlated with FXR isoform expression in hepatoma Huh 7 and HepG2 cells
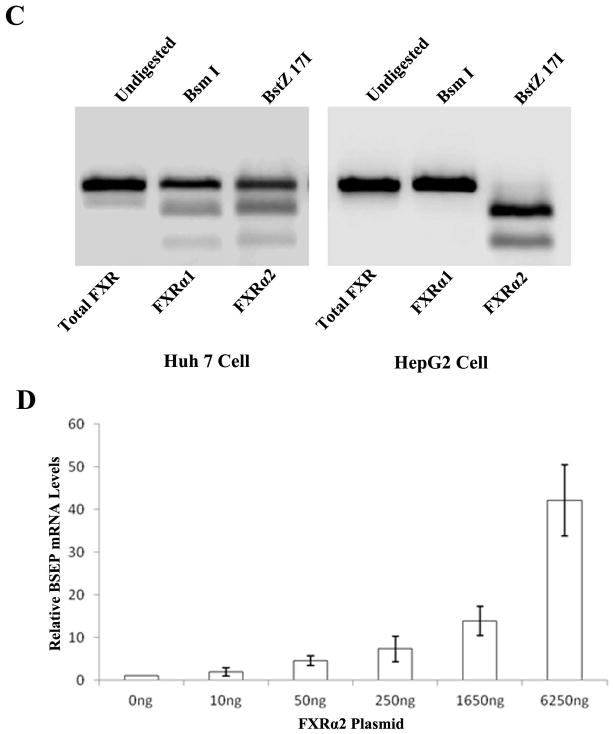
To investigate whether BSEP expression in hepatoma cell lines correlates with FXR isoform expression as revealed in HCC tissues, BSEP and FXR isoform expression levels were quantified in Huh 7 and HepG2 cells. As shown in Fig. 5A, BSEP transcripts were readily detected in Huh7 cells although at a decreased level when compared with healthy liver samples. However, BSEP mRNA was undetectable in HepG2 cells. It should be noted that such differences in BSEP transcription was not caused by the variation of total FXR expression because there was no statistical difference in total FXR expression between the two cell lines (Fig. 5B). Detection of FXR isoforms revealed that both FXRα1 and FXRα2 were expressed with an FXRα1/FXRα2 ratio of 1.72 in Huh 7 cells. In contrast, no FXRα2 expression was detected in HepG2 cells (Fig. 5C). The results indicated that Huh 7 cells behaved similarly to most of the HCC tissues with increased FXRα1/FXRα2 ratio and decreased BSEP expression while HepG2 cells behaved as the 7 HCC-T samples with no detectable FXRα2 and completely diminished BSEP expression. The data thus confirmed the phenomenon observed in HCC tissues.
Fig. 5. BSEP expression correlated with FXR isoform expression in Huh 7 and HepG2 cells.
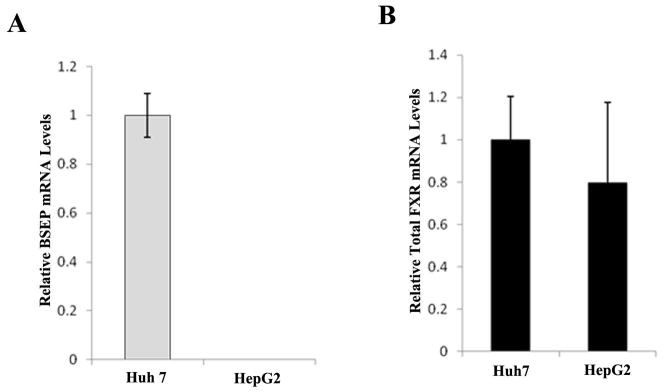
(A) Expression levels of BSEP mRNA and (B) total FXR mRNA were quantified by TaqMan real-time PCR with GAPDH levels as internal standards. No BSEP mRNA expression was detected in HepG2. (C) Expression of FXRα1 and FXRα2 in Huh 7 and HepG2 cells. No FXRα2 expression was detected in HepG2 cells. (D) Exogenously transfected FXRα2 restored endogenous BSEP expression in a dose dependent manner in HepG2 cells.
To further solidify the findings and determine whether supplying exogenous FXRα2 to HepG2 cells can restore the expression of endogenous BSEP, HepG2 cells were transiently transfected with increasing amounts of FXRα2, followed by quantification of BSEP mRNA. As shown in Fig. 5D, transfection of exogenous FXRα2 indeed resulted in endogenous BSEP expression in an FXRα2 dose-dependent manner. The data strongly supported the notion that undetectable BSEP expression in HepG2 cells was due to the absence of FXRα2.
Alteration of FXR isoform protein expression in HCC and HepG2 cells
To determine whether the data on FXR isoform expression at mRNA level correlate with their expression at protein levels, FXRα1 and FXRα2-specific proteins were detected by 2DWB and MS in representative liver tissues and HepG2 cells. Since HepG2 cells only expressed FXRα1 at mRNA level, the respective FXRα1 and FXRα2 proteins were detected by 2DWB with nuclear extracts from untransfected and FXRα2-transfected HepG2 cells (Supplement Fig. 1). In the healthy tissue, FXRα2 was dominantly expressed while a new form of FXR protein started to appear in the HCC-NT sample. More significantly, FXRα1 and the new form FXR protein were significantly increased in HCC-T samples (Spplement Fig. 1). The relative expression of FXRα1 was increased from 11% in healthy tissue to 59% of total FXR in HCC-T samples (Table 1). In the detection of FXRα1 and FXRα2 protein by MS, the fingerprints of two signature peptides (FXRα1; EMGMLAECMYTGLLTEIQCK and FXRα2: EMGMLAECLLTEIQCK) were shown in Supplement Fig. 2. The relevant mass spectral abundance of the precursor ions of the two signature peptides provided relative levels of the two proteins in the samples. Consistent with the data from 2DWB, relative FXRα1 expression was markedly increased from 9% in healthy tissue to 85% of total FXR in HCC-T samples (Table 1). Taken together, the data demonstrated that the relative expression of the two FXR isoforms was significantly altered in HCC. Such alteration may represent a mechanism for BSEP dysregulation in HCC patients.
Table 1.
Relative expression of FXRα1 at mRNA and protein levels
| FXR mRNA | FXR protein | ||
|---|---|---|---|
| Sample type | FXRα1 by RT-PCR (% of total FXR) | FXRα1 by MS (% of total FXR) | FXRα1 by 2DWB (% of total FXR) |
| Healthy | 53 | 9 | 11 |
| HCC-NT | 71 | 10 | 7 |
| HCC-T | 100 | 85 | 59 |
| HepG2 | 100 | 91 | 83 |
Proinflammatory cytokines IL-6 and TNF-α increased FXRα1/FXRα2 ratios with concurrent decreases in BSEP expression
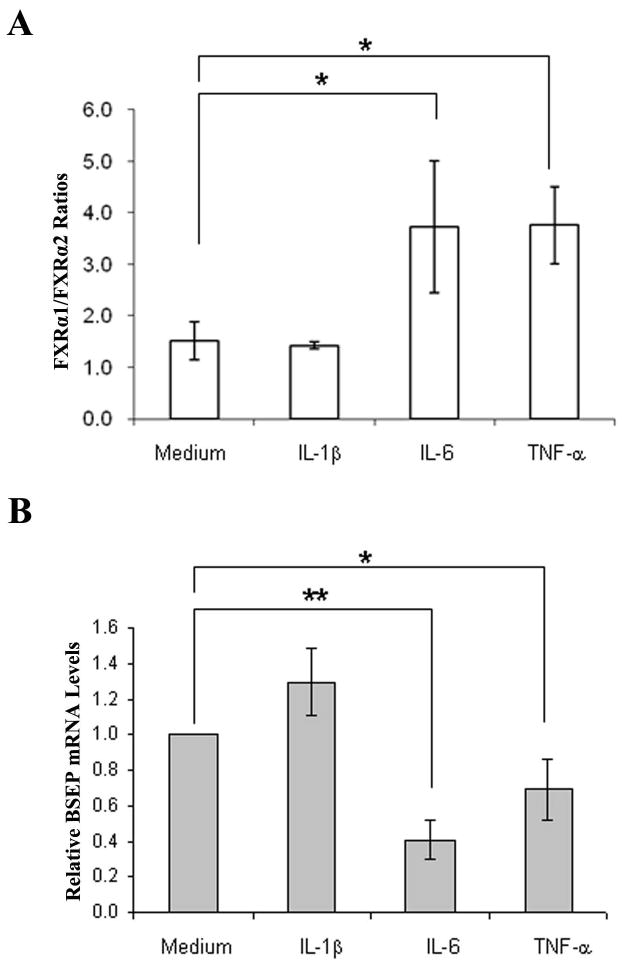
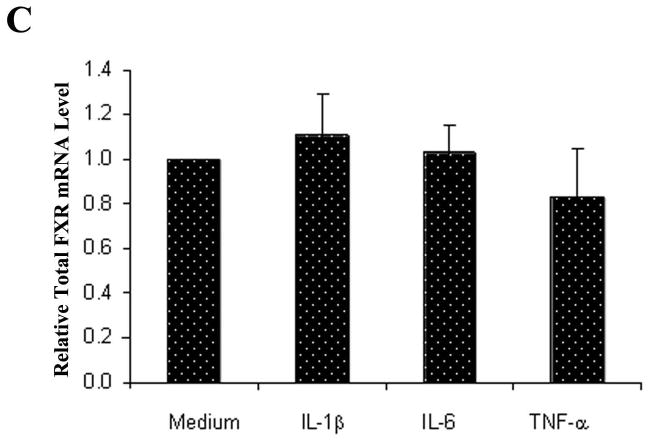
It is well established that chronic liver injury and inflammation are the common pathological processes leading to HCC development (25, 26). To determine whether inflammation plays a role in altering relative expression of FXRα1 and FXRα2, we treated Huh 7 cells with IL-1β, IL-6 and TNF-α, followed by determination of FXRα1/FXRα2 ratios and BSEP expression. As shown in Fig. 6A, treatment with IL-6 and TNF-α significantly shifted the relative expression of FXRα1 and FXRα2. The FXRα1/FXRα2 ratios increased as much as 2.5 fold in cells treated with IL-6 (p=0.015) or TNF-α (p=0.003), while IL-1β had no detectable effects (p=0.61). As expected, alteration in FXRα1/FXRα2 ratios corresponded with BSEP expression (Fig. 6B), which decreased by 59% (p<0.001) and 31% (p=0.036) in cells treated by IL-6 and TNF-α, respectively. On the contrary, treatment with IL-1β resulted in a 30% increase in BSEP expression with no statistical significance (p=0.15). Treatment with IL-6 (p=0.6), TNF-α (p=0.83), or IL-1β (p=0.17) induced unnoticeable alteration in total FXR expression (Fig. 6C). In summary, IL-6 and TNF-α, but not IL-1β, substantially increased FXRα1/FXRα2 ratio and decreased BSEP expression.
Fig. 6. Proinflammatory cytokines IL-6 and TNF-α altered FXRα1/FXRα2 ratio and BSEP expression.
(A) Huh 7 cells were treated with proinflammatory cytokines IL-1β, IL-6 and TNF-α at a concentration of 30ng/ml for 48h, followed by determination of FXRα1/FXRα2 ratios, (B) BSEP and (C) total FXR mRNA levels. Student’s t-test was applied to pair-wise comparison. A single asterisk (*) indicates p<0.05 and a double asterisk (**) indicates p<0.001.
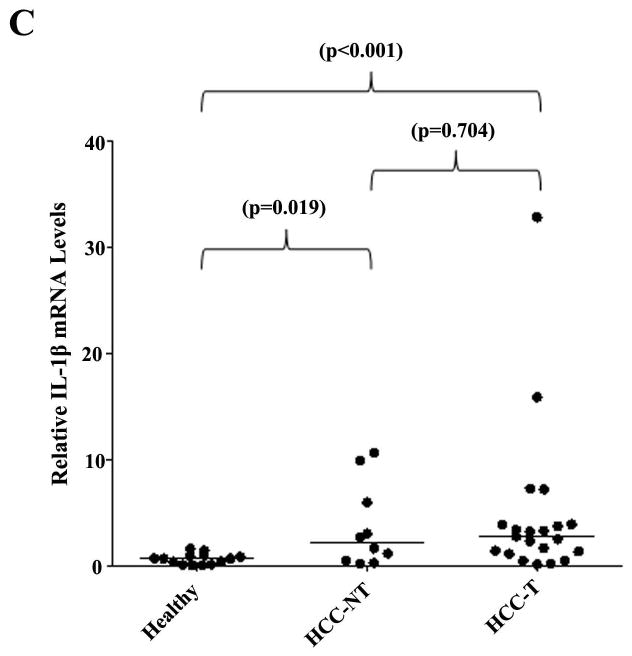
Previous studies have shown that serum IL-6 and TNF-α concentrations were increased in HCC patients (35, 36). Based on our finding, we propose that the levels of proinflammatory cytokines IL-6 and TNF-α would be elevated in HCC tissues. Indeed, as shown in Fig. 7, IL-6, TNF-α and IL-1β mRNA levels were greatly elevated in HCC-NT and HCC-T samples when compared with healthy controls. The median IL-6 mRNA levels increased by 13.2 fold in HCC-NT (p<0.001) and 24.2 fold in HCC-T (p<0.001) samples, while the median TNF-α mRNA level increased by 4.5 fold in HCC-NT (p=0.017) and 4.8 fold in HCC-T (p<0.001) samples. Significant elevation of IL-1β mRNA levels were also detected in HCC-NT (p=0.019) and HCC-T (p<0.001). The data revealed that the expression levels of proinflammatory cytokines IL-6, TNF-α and IL-1β significantly elevated in HCC tissues.
Fig. 7. Proinflammatory cytokines IL-1β, IL-6 and TNF-α expression levels significantly elevated in HCC tissues.
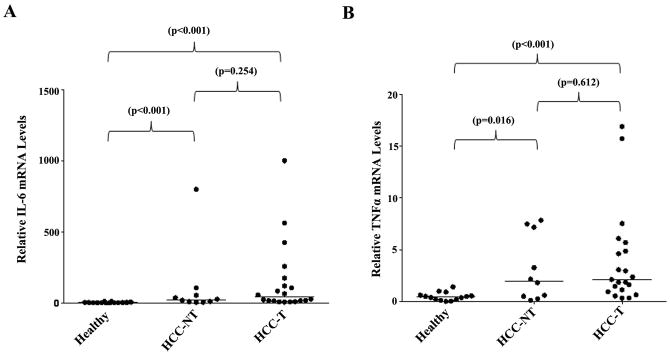
(A) The expression levels of IL-6, (B) TNF-α and (C) IL-1β in healthy, HCC-T and HCC-NT tissues were quantified by TaqMan real-time PCR with GAPDH levels as internal standards. The median value of each group was indicated by a short line. Non-parametric Mann-Whitney test was used for pairwise comparison.
DISCUSSION
As the canalicular effluxer of bile acids, BSEP has a direct impact on the enterohepatic circulation of bile acids. In this study, we showed that BSEP expression was severely diminished in both HCC and tumor-surrounding tissues, suggesting a reduced biliary secretion of bile acids and accumulation of bile acids in the liver and body. The finding was in agreement with the clinical measurements of bile acids in HCC patients (27–30). In one study, total serum bile acid levels increased 5.7 fold in HCC patients (30). In another study, serum glycochenodeoxycholic acid and taurocholic acid elevated 6.7 and 25.4 fold, respectively while glycocholic acid levels increased 6.4 fold in serum and 45 fold in urine in HCC patients (28). On the other hand, fecal metabolome profiling revealed that bile acids dramatically decreased in HCC patients (31). Therefore, it was concluded that dysregulation of BSEP was at least one of the mechanisms leading to the disruption of bile acid homeostasis in HCC patients.
FXRα1 and FXRα2 are the two predominant FXR isoforms in the human liver (11) with isoforms FXRα3 and FXRα4 being undetectable (data not shown). A previous study showed that mouse BSEP was comparably transactivated by FXRα1 and FXRα2 (12). In contrast, we found that human BSEP was differentially regulated by FXRα1 and FXRα2 with FXRα2 being the predominant regulator in vitro and in vivo. Such species-specific regulation of BSEP is not uncommon (6). Currently, the mechanisms for isoform-dependent and species-specific regulation of BSEP by FXR are under investigation.
Similar to human BSEP, other FXR target genes including ileal bile acid-binding protein (12), syndecan-1 (37) and fibrinogens (38) also exhibited isoform-specific regulation by FXR. However, at present, its physiological and/or pathological significance are unknown. In this study, we demonstrated that FXRα1 and FXRα2 expression was significantly altered in HCC tissues in association with a marked reduction of BSEP expression. Such observation in HCC tissues was fully in agreement with the data from hepatoma cell lines Huh 7 and HepG2 cells. We thus concluded that alteration in relative expression of FXR isoforms may represent an underlying mechanism for BSEP dysregulation in HCC patients. However, it remains to be determined whether other mechanisms such as epigenetic modifications and alteration in coregulator recruitment, which occur commonly in tumorigenesis, also indirectly contribute to BSEP dysregulation in HCC.
In the 2DWB, a new form of FXR protein appeared (Supplement Fig. 1) in HCC-NT and HCC-T samples but absent in healthy tissue. It remains to be determined whether it is a modified FXRα1, FXRα2 or a new isoform of FXR. Comparison of the data at mRNA and protein levels, it was noted that FXRα1 was more abundantly expressed at the mRNA levels while FXRα2 expression was predominantly expressed at the protein level in the same healthy tissue. Similarly, FXRα2 mRNA levels were undetectable while FXRα2 proteins were detected by both 2DWB and MS in the representative HCC-T samples. Such discrepancy may indicate different post-transcriptional regulations of the two isoforms. Additional studies are required to provide a full explanation for the phenomenon.
Chronic inflammation is the hallmark for the development of HCC (25, 26). Consistently, serum IL-6 and TNF-α concentrations significantly increased in HCC patients (35, 36) and mouse model (39). There are also studies demonstrating that IL-6 and TNF-α play an etiological role in the development of HCC (39, 40). Alternative splicing from a single promoter results in FXRα1 and FXRα2 (11, 12). In this study, we found that IL-6 and TNF-α but not IL-1β markedly altered relative expression of FXRα1 and FXRα2 with a concurrent decrease in BSEP expression (Fig. 6A and 6B), indicating a possible crosstalk between the FXR alternative splicing process and IL-6 and TNF-α signaling pathways. Further studies are required to establish and reveal the mechanistic insights of such crosstalk. The fact that in contrast to IL-6 and TNF-α, IL-1β had no significant effects on FXR isoforms and BSEP expression (Fig. 6A and 6B) indicates that not general but cytokine-specific chronic inflammation leads to alteration of FXR isoform and subsequently BSEP expression.
In comparison with healthy liver samples, adjacent HCC-NT tissues exhibited a significant decrease in BSEP expression although at the levels not as severe as in HCC-T (Fig. 1), indicating that BSEP dysregulation is not limited to the tumor but extended to adjacent liver tissues. Similarly, the expression levels of proinflammatory cytokines IL-6, TNF-α and IL-1β were markedly elevated in HCC-NT tissues at comparable levels to that in HCC-T (Fig. 7). The data are in agreement with the notion that chronic inflammation leads to decreased BSEP expression and tumorigenesis may further worsen BSEP dysregulation. However, it remains to be determined whether such elevation in proinflammatory cytokine levels and BSEP dysregulation extends to the entire liver.
Bile acids have been recognized as carcinogens and/or tumor promoters (41). Currently, whether disruption of bile acid homeostasis is a trigger for initiating HCC development remains to be established. However, a large body of evidence indicates that excessive bile acids in the liver contribute to the pathogenesis of HCC (13, 14, 16, 17, 41–43). Indeed, chronic exposure of hepatocytes to high levels of bile acids due to genetic defects in BSEP in human (13, 14) or dysregulation of BSEP in FXR knockout mice (16, 17) do spontaneously develop HCC. Bile acids are also implicated as etiological agents in colon and esophagus cancer development (41–43). Based on our finding that BSEP expression was severely diminished due to inflammation-mediated alteration of FXR isoform expression, restoration of BSEP expression through controlling chronic inflammation in the liver may re-establish the bile acid homeostasis, providing a possible approach for treatment and/or prevention of HCC.
Supplementary Material
Acknowledgments
Financial Support:
This work was supported by the National Institutes of Health Grant R01DK087755 and the National Institutes of Health National Center for Research Resources Grant P20-RR016457. B.Y. is supported by the National Institutes of Health Grants R01GM61988 and R01ES07965. A. S. is supported by the National Institutes of Health Grants R01ES016042 and K22ES013782.
Technical and instrumental support from the RI-INBRE Core Facility in the College of Pharmacy is greatly appreciated. We want to express our gratitude to Deborah Greer and John Morgan for their assistance and technical support in using the IVIS 100 Living Image system in the Core Facility, Roger Williams Medical Center COBRE, funded by the National Institutes of Health National Center for Research Resources Grant P20 RR018757. We thank Dr. David Mangelsdorf for providing the human FXRα1 expression plasmid.
Abbreviations
- BSEP
bile salt export pump
- HCC
hepatocellular carcinoma
- FXR
farnesoid X receptor
- HCC-T
HCC tumor
- HCC-NT
HCC non-tumor
- IL-1β
interleukin-1beta
- IL-6
interleukin-6
- TNF-α
tumor necrosis factor-alpha
- CDCA
chenodeoxycholic acid
- DMSO
dimethyl sulfoxide
- PCR, polymerase-chain reaction. GAPDH
glyceraldehyde-3-phosphate dehydrogenase
- IVIS
in vivo imaging system
- CHTN
cooperative human tissue network. 2DWB, two-dimension electrophoresis followed by Western blot
- MS
Mass spectrometry
Contributor Information
Yuan Chen, Email: chenyuan@ymail.com.
Xiulong Song, Email: songxiulong@hotmail.com.
Leila Valanejad, Email: leilavalanejad@gmail.com.
Alexander Vasilenko, Email: alex_vasilenko@yahoo.com.
Vijay More, Email: vrsmore@gmail.com.
Xi Qiu, Email: xi.qiu@pfizer.com.
Weikang Chen, Email: wkchen.osu@gmail.com.
Yurong Lai, Email: yurong.lai@pfizer.com.
Angela Slitt, Email: Angela_slitt@ds.uri.edu.
Matthew Stoner, Email: stonermatthew@gmail.com.
Bingfang Yan, Email: byan@uri.edu.
Ruitang Deng, Email: dengr@mail.uri.edu.
References
- 1.Meier PJ, Stieger B. Bile salt transporters. Annu Rev Physiol. 2002;64:635–661. doi: 10.1146/annurev.physiol.64.082201.100300. [DOI] [PubMed] [Google Scholar]
- 2.Kullak-Ublick GA, Stieger B, Meier PJ. Enterohepatic bile salt transporters in normal physiology and liver disease. Gastroenterology. 2004;126:322–342. doi: 10.1053/j.gastro.2003.06.005. [DOI] [PubMed] [Google Scholar]
- 3.Ananthanarayanan M, Balasubramanian N, Makishima M, Mangelsdorf DJ, Suchy FJ. Human bile salt export pump promoter is transactivated by the farnesoid X receptor/bile acid receptor. J Biol Chem. 2001;276:28857–28865. doi: 10.1074/jbc.M011610200. [DOI] [PubMed] [Google Scholar]
- 4.Plass JR, Mol O, Heegsma J, Geuken M, Faber KN, Jansen PL, Muller M. Farnesoid X receptor and bile salts are involved in transcriptional regulation of the gene encoding the human bile salt export pump. Hepatology. 2002;35:589–596. doi: 10.1053/jhep.2002.31724. [DOI] [PubMed] [Google Scholar]
- 5.Deng R, Yang D, Radke A, Yang J, Yan B. The hypolipidemic agent guggulsterone regulates the expression of human bile salt export pump: dominance of transactivation over farsenoid X receptor-mediated antagonism. J Pharmacol Exp Ther. 2007;320:1153–1162. doi: 10.1124/jpet.106.113837. [DOI] [PMC free article] [PubMed] [Google Scholar]
- 6.Song X, Kaimal R, Yan B, Deng R. Liver receptor homolog 1 transcriptionally regulates human bile salt export pump expression. J Lipid Res. 2008;49:973–984. doi: 10.1194/jlr.M700417-JLR200. [DOI] [PMC free article] [PubMed] [Google Scholar]
- 7.Weerachayaphorn J, Cai SY, Soroka CJ, Boyer JL. Nuclear factor erythroid 2-related factor 2 is a positive regulator of human bile salt export pump expression. Hepatology. 2009;50:1588–1596. doi: 10.1002/hep.23151. [DOI] [PMC free article] [PubMed] [Google Scholar]
- 8.Parks DJ, Blanchard SG, Bledsoe RK, Chandra G, Consler TG, Kliewer SA, Stimmel JB, et al. Bile acids: natural ligands for an orphan nuclear receptor. Science. 1999;284:1365–1368. doi: 10.1126/science.284.5418.1365. [DOI] [PubMed] [Google Scholar]
- 9.Makishima M, Okamoto AY, Repa JJ, Tu H, Learned RM, Luk A, Hull MV, et al. Identification of a nuclear receptor for bile acids. Science. 1999;284:1362–1365. doi: 10.1126/science.284.5418.1362. [DOI] [PubMed] [Google Scholar]
- 10.Otte K, Kranz H, Kober I, Thompson P, Hoefer M, Haubold B, Remmel B, et al. Identification of farnesoid X receptor beta as a novel mammalian nuclear receptor sensing lanosterol. Mol Cell Biol. 2003;23:864–872. doi: 10.1128/MCB.23.3.864-872.2003. [DOI] [PMC free article] [PubMed] [Google Scholar]
- 11.Huber RM, Murphy K, Miao B, Link JR, Cunningham MR, Rupar MJ, Gunyuzlu PL, et al. Generation of multiple farnesoid-X-receptor isoforms through the use of alternative promoters. Gene. 2002;290:35–43. doi: 10.1016/s0378-1119(02)00557-7. [DOI] [PubMed] [Google Scholar]
- 12.Zhang Y, Kast-Woelbern HR, Edwards PA. Natural structural variants of the nuclear receptor farnesoid X receptor affect transcriptional activation. J Biol Chem. 2003;278:104–110. doi: 10.1074/jbc.M209505200. [DOI] [PubMed] [Google Scholar]
- 13.Knisely AS, Strautnieks SS, Meier Y, Stieger B, Byrne JA, Portmann BC, Bull LN, et al. Hepatocellular carcinoma in ten children under five years of age with bile salt export pump deficiency. Hepatology. 2006;44:478–486. doi: 10.1002/hep.21287. [DOI] [PubMed] [Google Scholar]
- 14.Strautnieks SS, Byrne JA, Pawlikowska L, Cebecauerova D, Rayner A, Dutton L, Meier Y, et al. Severe bile salt export pump deficiency: 82 different ABCB11 mutations in 109 families. Gastroenterology. 2008;134:1203–1214. doi: 10.1053/j.gastro.2008.01.038. [DOI] [PubMed] [Google Scholar]
- 15.Fukuda M, Kawahara Y, Hirota T, Akizuki S, Shigeto S, Nakajima H, Ieiri I, et al. Genetic polymorphisms of hepatic ABC-transporter in patients with hepatocellular carcinoma. J Cancer Therapy. 2010;1:114–123. [Google Scholar]
- 16.Yang F, Huang X, Yi T, Yen Y, Moore DD, Huang W. Spontaneous development of liver tumors in the absence of the bile acid receptor farnesoid X receptor. Cancer Res. 2007;67:863–867. doi: 10.1158/0008-5472.CAN-06-1078. [DOI] [PubMed] [Google Scholar]
- 17.Kim I, Morimura K, Shah Y, Yang Q, Ward JM, Gonzalez FJ. Spontaneous hepatocarcinogenesis in farnesoid X receptor-null mice. Carcinogenesis. 2007;28:940–946. doi: 10.1093/carcin/bgl249. [DOI] [PMC free article] [PubMed] [Google Scholar]
- 18.Kanwal F, Hoang T, Kramer JR, Asch SM, Goetz MB, Zeringue A, Richardson P, et al. Increasing prevalence of HCC and cirrhosis in patients with chronic hepatitis C virus infection. Gastroenterology. 2011;140:1182–1188 e1181. doi: 10.1053/j.gastro.2010.12.032. [DOI] [PMC free article] [PubMed] [Google Scholar]
- 19.Xu YF, Yi Y, Qiu SJ, Gao Q, Li YW, Dai CX, Cai MY, et al. PEBP1 downregulation is associated to poor prognosis in HCC related to hepatitis B infection. J Hepatol. 2010;53:872–879. doi: 10.1016/j.jhep.2010.05.019. [DOI] [PubMed] [Google Scholar]
- 20.Petta S, Craxi A. Hepatocellular carcinoma and non-alcoholic fatty liver disease: from a clinical to a molecular association. Curr Pharm Des. 2010;16:741–752. doi: 10.2174/138161210790883787. [DOI] [PubMed] [Google Scholar]
- 21.Page JM, Harrison SA. NASH and HCC. Clin Liver Dis. 2009;13:631–647. doi: 10.1016/j.cld.2009.07.007. [DOI] [PubMed] [Google Scholar]
- 22.Qian Y, Fan JG. Obesity, fatty liver and liver cancer. Hepatobiliary Pancreat Dis Int. 2005;4:173– 177. [PubMed] [Google Scholar]
- 23.El-Serag HB, Tran T, Everhart JE. Diabetes increases the risk of chronic liver disease and hepatocellular carcinoma. Gastroenterology. 2004;126:460–468. doi: 10.1053/j.gastro.2003.10.065. [DOI] [PubMed] [Google Scholar]
- 24.Amarapurkar DN, Patel ND, Kamani PM. Impact of diabetes mellitus on outcome of HCC. Ann Hepatol. 2008;7:148–151. [PubMed] [Google Scholar]
- 25.Alison MR, Nicholson LJ, Lin WR. Chronic inflammation and hepatocellular carcinoma. Recent Results Cancer Res. 2011;185:135–148. doi: 10.1007/978-3-642-03503-6_8. [DOI] [PubMed] [Google Scholar]
- 26.Weber A, Boege Y, Reisinger F, Heikenwalder M. Chronic liver inflammation and hepatocellular carcinoma: persistence matters. Swiss Med Wkly. 2011;141:w13197. doi: 10.4414/smw.2011.13197. [DOI] [PubMed] [Google Scholar]
- 27.Patterson AD, Maurhofer O, Beyoglu D, Lanz C, Krausz KW, Pabst T, Gonzalez FJ, et al. Aberrant lipid metabolism in hepatocellular carcinoma revealed by plasma metabolomics and lipid profiling. Cancer Res. 2011;71:6590–6600. doi: 10.1158/0008-5472.CAN-11-0885. [DOI] [PMC free article] [PubMed] [Google Scholar]
- 28.Chen T, Xie G, Wang X, Fan J, Qiu Y, Zheng X, Qi X. Serum and urine metabolite profiling reveals potential biomarkers of human hepatocellular carcinoma. Mol Cell Proteomics. 2011;10:M110 004945. doi: 10.1074/mcp.M110.004945. [DOI] [PMC free article] [PubMed] [Google Scholar]
- 29.Wang B, Chen D, Chen Y, Hu Z, Cao M, Xie Q, Xu J, et al. Metabonomic profiles discriminate hepatocellular carcinoma from liver cirrhosis by ultraperformance liquid chromatography-mass spectrometry. J Proteome Res. 2012;11:1217–1227. doi: 10.1021/pr2009252. [DOI] [PubMed] [Google Scholar]
- 30.El-Houseini ME, Amer MA, El-Din AH, El-Sherbiny M, Hussein TD, Mansour O. Evaluation of serum total bile acids in the diagnosis of hepatocellular carcinoma. J Egyptian Nat Cancer Inst. 2000;12:307–313. [Google Scholar]
- 31.Cao H, Huang H, Xu W, Chen D, Yu J, Li J, Li L. Fecal metabolome profiling of liver cirrhosis and hepatocellular carcinoma patients by ultra performance liquid chromatography-mass spectrometry. Anal Chim Acta. 2011;691:68–75. doi: 10.1016/j.aca.2011.02.038. [DOI] [PubMed] [Google Scholar]
- 32.Deng R, Yang D, Yang J, Yan B. Oxysterol 22(R)-hydroxycholesterol induces the expression of the bile salt export pump through nuclear receptor farsenoid X receptor but not liver X receptor. J Pharmacol Exp Ther. 2006;317:317–325. doi: 10.1124/jpet.105.097758. [DOI] [PMC free article] [PubMed] [Google Scholar]
- 33.Kaimal R, Song X, Yan B, King R, Deng R. Differential modulation of farnesoid X receptor signaling pathway by the thiazolidinediones. J Pharmacol Exp Ther. 2009;330:125–134. doi: 10.1124/jpet.109.151233. [DOI] [PMC free article] [PubMed] [Google Scholar]
- 34.More VR, Slitt AL. Alteration of hepatic but not renal transporter expression in diet-induced obese mice. Drug Metab Dispos. 2011;39:992–999. doi: 10.1124/dmd.110.037507. [DOI] [PMC free article] [PubMed] [Google Scholar]
- 35.Ataseven H, Bahcecioglu IH, Kuzu N, Yalniz M, Celebi S, Erensoy A, Ustundag B. The levels of ghrelin, leptin, TNF-alpha, and IL-6 in liver cirrhosis and hepatocellular carcinoma due to HBV and HDV infection. Mediators Inflamm. 2006;2006:78380. doi: 10.1155/MI/2006/78380. [DOI] [PMC free article] [PubMed] [Google Scholar]
- 36.Porta C, De Amici M, Quaglini S, Paglino C, Tagliani F, Boncimino A, Moratti R, et al. Circulating interleukin-6 as a tumor marker for hepatocellular carcinoma. Ann Oncol. 2008;19:353–358. doi: 10.1093/annonc/mdm448. [DOI] [PubMed] [Google Scholar]
- 37.Anisfeld AM, Kast-Woelbern HR, Meyer ME, Jones SA, Zhang Y, Williams KJ, Willson T, et al. Syndecan-1 expression is regulated in an isoform-specific manner by the farnesoid-X receptor. J Biol Chem. 2003;278:20420–20428. doi: 10.1074/jbc.M302505200. [DOI] [PubMed] [Google Scholar]
- 38.Anisfeld AM, Kast-Woelbern HR, Lee H, Zhang Y, Lee FY, Edwards PA. Activation of the nuclear receptor FXR induces fibrinogen expression: a new role for bile acid signaling. J Lipid Res. 2005;46:458–468. doi: 10.1194/jlr.M400292-JLR200. [DOI] [PubMed] [Google Scholar]
- 39.Park EJ, Lee JH, Yu GY, He G, Ali SR, Holzer RG, Osterreicher CH, et al. Dietary and genetic obesity promote liver inflammation and tumorigenesis by enhancing IL-6 and TNF expression. Cell. 2010;140:197–208. doi: 10.1016/j.cell.2009.12.052. [DOI] [PMC free article] [PubMed] [Google Scholar]
- 40.Naugler WE, Sakurai T, Kim S, Maeda S, Kim K, Elsharkawy AM, Karin M. Gender disparity in liver cancer due to sex differences in MyD88-dependent IL-6 production. Science. 2007;317:121–124. doi: 10.1126/science.1140485. [DOI] [PubMed] [Google Scholar]
- 41.Jansen PL. Endogenous bile acids as carcinogens. J Hepatol. 2007;47:434–435. doi: 10.1016/j.jhep.2007.06.001. [DOI] [PubMed] [Google Scholar]
- 42.Bernstein H, Bernstein C, Payne CM, Dvorak K. Bile acids as endogenous etiologic agents in gastrointestinal cancer. World J Gastroenterol. 2009;15:3329–3340. doi: 10.3748/wjg.15.3329. [DOI] [PMC free article] [PubMed] [Google Scholar]
- 43.Gadaleta RM, van Mil SW, Oldenburg B, Siersema PD, Klomp LW, van Erpecum KJ. Bile acids and their nuclear receptor FXR: Relevance for hepatobiliary and gastrointestinal disease. Biochim Biophys Acta. 2010;1801:683–692. doi: 10.1016/j.bbalip.2010.04.006. [DOI] [PubMed] [Google Scholar]
Associated Data
This section collects any data citations, data availability statements, or supplementary materials included in this article.


