

Abstract
Knobs are conspicuous heterochromatic regions found on the chromosomes of maize and its relatives. The number, locations, and sizes of knobs vary dramatically, with most lines containing between four and eight knobs in mid-arm positions. Prior data suggest that some knobs may reduce recombination. However, comprehensive tests have not been carried out, primarily because most knobs have not been placed on the genetic map. We used fluorescent in situ hybridization and two recombinant inbred populations to map seven knobs and to accurately place three knobs from the B73 inbred on the genomic sequence assembly. The data show that knobs lie in gene-dense regions of the maize genome. Comparisons to 23 other recombinant inbred populations segregating for knobs at the same sites confirm that large knobs can locally reduce crossing over by as much as twofold on a cM/Mb scale. These effects do not extend beyond regions ~10 cM to either side of knobs and do not appear to affect linkage disequilibrium among genes within and near knob repeat regions of the B73 RefGen_v2 assembly.
Electronic supplementary material
The online version of this article (doi:10.1007/s00412-012-0391-8) contains supplementary material, which is available to authorized users.
Introduction
Repetitive DNA can be divided into two large categories, transposable elements and tandem repeat arrays. Both types of repeat tend to accumulate in regions that experience low recombination such as centromeres and pericentromeres. While transposons can reach very high copy numbers and accumulate on chromosome arms between genes (Fu et al. 2002; Gent et al. 2012), tandem repeats are unstable and tend to accumulate only in regions of exceedingly low recombination such as centromere cores or telomeres (Charlesworth et al. 1994; Plohl et al. 2008). Maize knobs provide an unusual exception as they are multi-megabase tandem repeat arrays primarily located in mid-arm positions (Dawe and Hiatt 2004).
Knobs have been observed in 34 distinct cytological locations in modern maize and its wild teosinte progenitors, but most lines contain fewer than 12 knobs in several common positions (McClintock et al. 1981). At the molecular level, knobs are composed primarily of two tandemly repeated sequences, the 180-bp knob repeat and 350-bp TR-1 element (Ananiev et al. 1998). Individual knobs vary in size and composition: they can either be composed exclusively of 180-bp or TR-1 elements or contain a mixture of both (Ananiev et al. 1998; Hiatt et al. 2002; Kato et al. 2004). The size of individual repeat arrays ranges from just a few thousand to millions of bases (Ananiev et al. 1998; Peacock et al. 1981). Many knobs are large enough to be visible throughout the cell cycle and have been used extensively as cytological markers (McClintock 1929) and to study the phylogenetic history of Zea (McClintock 1987).
The variability and abundance of knobs are thought to be due to a rare form of chromosome 10, abnormal chromosome 10 (Ab10), that causes knobbed chromosomes to preferentially segregate during female meiosis (Rhoades 1952). This type of preferential transmission is also known as meiotic drive (Sandler and Novitski 1957). Ab10 encodes genes that convert the otherwise inert knobs into “neocentromeres” that move toward spindle poles faster than centromeres (Dawe and Hiatt 2004). According to Rhoades (1952), meiotic drive occurs when the knob is heterozygous and a crossover occurs between the centromere and the knob, thus forming a heteromorphic dyad. In such situations, neocentromeres mobilize the knobbed chromatids toward the outer cells of the linear tetrad and increase their odds of being transmitted to the basal egg cell (Rhoades 1952).
There are some evidences showing that knobs naturally suppress recombination. In plants heterozygous for a knob on chromosome 3L, recombination over the knob region was reduced by ~15 % compared to plants that were homozygous for knobbed or knobless chromosomes (Rhoades and Dempsey 1966). However, the suppressive effect was not observed when Ab10 was present; in similar lines carrying Ab10, recombination over the 3L knob was increased by ~7 % relative to knobless controls. Ab10 was also shown to increase the recombination between a normal and inverted form of chromosome 3 (Rhoades and Dempsey 1966). A later study examined the effects of differently sized knobs on chromosome 9 relative to recombination. In lines heterozygous for a knob on 9S, recombination decreased as knob size increased. However, when Ab10 was present, recombination was similar among all lines (Kikudome 1959). These data suggest that knobs can decrease local recombination in some cases but that Ab10 can minimize this effect and perhaps increase recombination globally. Although the existing data are convincing, they have not been repeated on a comprehensive scale.
Further studies are currently limited by the fact that knobs have not been mapped relative to molecular markers or to the maize reference genome assembly. Knobs were historically placed on the cytogenetic map and then roughly placed on the genetic map using limited data sets (Creighton and McClintock 1931) or indirect means (Lawrence et al. 2006). The current assembly of the B73 reference genome (B73 RefGen_v2) suggests that there are multiple arrays of knob repeats on each chromosome, many of which may represent assembly errors and/or short arrays that are not cytologically visible. In this study, we mapped seven visible knobs using recombinant inbred lines and fluorescent in situ hybridization. The data reveal that knobs are located in gene-dense, generally high-recombination areas. Using our mapping data in combination with the Nested Association Mapping (NAM) metapopulation, a collection of 25 recombinant inbred line populations (McMullen et al. 2009), we were able to compare recombination frequencies in the presence and absence of knobs. These data reveal that knobs in the heterozygous condition can significantly reduce local recombination.
Results
Genetic mapping of seven knobs from the inbreds B73, Ki3, and CML277
In maize, knobs are named systematically. The letter “K” is followed by the chromosome number and arm designation. For example, K1S is the name for the knob on the short arm of chromosome 1. Multiple knobs have been identified on some chromosome arms and have been given additional numbers, for example, K4L1 and K4L2, where the highest appended number identifies the knob closest to the telomere. Not indicated is the fact that knobs vary in size (often qualitatively designated as small, medium, and large) and repeat type (primarily 180-bp repeat, TR-1 repeat, or a mixture of both). Even if both parents contain a knob at the same site, when they are different in size or repeat content, the knob can be mapped. The publically available maize germplasm includes 25 different recombinant inbred line (RIL) populations known as the NAM diversity panel (McMullen et al. 2009). Each of these RIL populations involves the B73 reference inbred and a different inbred for which basic cytological descriptions are known (Albert et al. 2010). We chose two RIL sets that provided high value in terms of polymorphic knobs: the B73 × Ki3 population and the B73 × CML277 population which together allow the mapping of nine knobs (Fig. 1; Table 1)
Fig. 1.
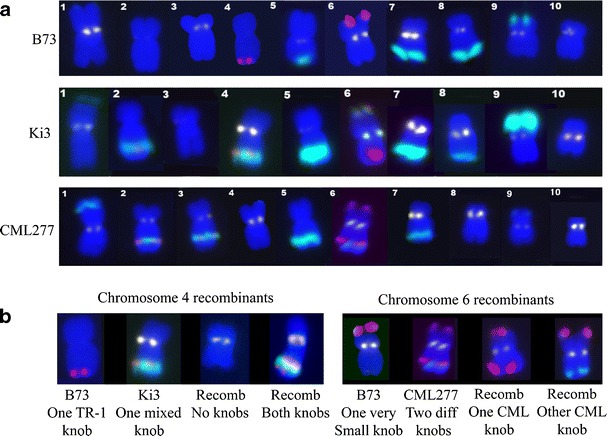
The karyotypes of B73, Ki3, CML277, and recombinant chromosomes. a Chromosomes are numbered one to ten from left to right. Short arms are oriented up. DNA is in blue, centromeres appear white, the knob 180-bp repeat is shown in turquoise, and TR-1 repeat is in red. b Recombinant chromosomes 4 (from Ki3 × B73 RILs) and 6 (from CML277 × B73 RILs). On chromosome 4, the mixed 4L1 knob from Ki3 often recombines with the TR-1 knob from B73. On chromosome 6, we found recombinants demonstrating that there are two different knobs in CML277, one of which is composed primarily of TR-1 and another that is composed primarily of the 180-bp repeat
Table 1.
Positions of knobs mapped in this study. The primary repeat present in each knob is noted as “180” (primarily made up of the knob 180-bp repeat), “TR-1” (primarily the TR-1 repeat), or “mixed” (indicating both repeats are present). The interval sizes differ in the different RILs due to natural variation in recombination and SNP polymorphism
| Mapped knob | Flanking SNPs, interval size |
|---|---|
| K2L | |
| B73 (knobless) × Ki3 (mixed) | pza03165–pza02077, 4.9 cM |
| B73 (knobless) × CML277 (mixed) | pzb01103–pza02077, 3.9 cM |
| K3L | |
| B73 (knobless) × CML277 (mixed) | pza03735–pza03191, 8.3 cM |
| K4L1 | |
| B73 (knobless) × Ki3 (mixed) | cl25297_1–IDP324, 1.1 cM |
| K4L2 | |
| B73 (TR-1) × Ki3 (knobless) | AY111962−AY107200, 4.2 cM |
| B73 (TR-1) × CML277 (knobless) | AY111962–AY107200, 1.7 cM |
| K5L | |
| B73 (180, small knob) × Ki3 (180, large knob) | phm532–pco087990, 3.0 cM |
| B73 (180, small knob) × CML277 (180, large knob) | phm532–cl23597_2, 2.3 cM |
| K8L | |
| B73 (180, large knob) × Ki3 (180, small knob) | gpm511–sdg139, 11.1 cM |
| B73 (180, large knob) × CML277 (knobless) | pza03182–sdg139, 1.4 cM |
| K9S | |
| B73 (180) × Ki3 (mixed) | IDP844−end of 9S |
| B73 (180) × CML277 (knobless) | IDP844−end of 9S |
Both the CML277 and Ki3 populations were used to map K1S, K4L2, K5L, K6L, K8L, and K9S. In addition, K3L was mapped in the Ki3 population and K4L1 in the CML277 population (Table 1). A total of 128 (Ki3) and 126 (CML277) individuals were scored for the presence or absence of the segregating knobs. We were not able to map the knobs on 1S or 6L due to low LOD scores and/or non-concordance of the map locations between the two populations. We were able to genetically resolve (but not reliably map) two different 6L knobs in CML277, both of which are proximal to the very small B73 6L knob (Fig. 1). Ki3 has one 6L knob proximal to the B73 knob, and this knob may or may not be the same as one of the two knobs in CML277. We note that there also appears to be TR-1-rich knob on chromosome 6S; however, this region does not condense into a visible knob at the pachytene substage of meiosis like other TR-1-rich areas and thus has not been considered a knob (Kato 1976).
Knobs lie in gene-dense areas
We mapped four knobs from the B73 parent: K4L2 (primarily TR-1), K5L (primarily 180 bp), K8L (primarily 180 bp), and K9S (primarily 180 bp). B73 has a large knob on chromosome 7L, but this knob is also found in Ki3 and CML277 so it could not be mapped. All four knobs map to regions that are gene-dense and normally experience high levels of crossing over (Fig. 2). In the intervals containing K4L2, K5L, and K9S, the B73 genome assembly shows large numbers of the expected repeats (Fig. 2). K8L is less clear as it maps to an interval on the genome assembly that includes two separate TR-1 arrays and one 180-bp array. The distal boundary of the interval lies within several scattered 180-bp arrays. These results make it difficult to identify the location of K8L with certainty, particularly when taken in the context of the fact that other inbreds contain mixed knobs at the same location (both knobs 180 and TR-1; Table 2). Based on these data, we have annotated the B73 RefGen_v2 assembly locations on the MaizeGDB Genome Browser (Sen et al. 2009) to indicate the locations of K4L2, K5L, and K9S, for which we have high confidence.
Fig. 2.
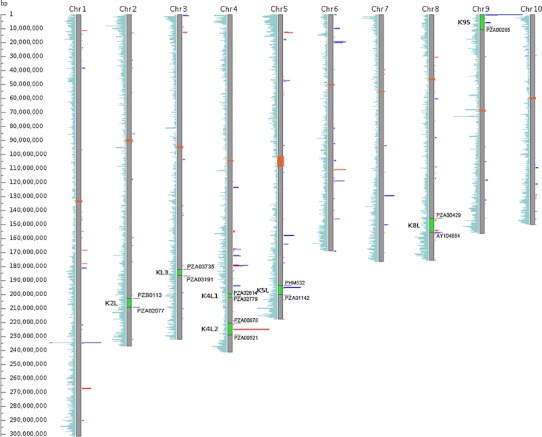
Knobs occur in gene-rich regions of the genome. Gene density plots are shown to the left of chromosome bars (turquoise). Knob 180 (blue) and TR-1 (red) BLAST hit counts are shown to the right. In seven knobs (2L, 3L, 4L1, 4L2, 5L, 8L, and 9S), four of which are B73-specific (4L2, 5L, 8L, and 9S) map to chromosome arms. Orange blocks mark centromere regions. Green bars represent the genetic map intervals where knobs were mapped, where the lengths of the bars are limited by the nearest SNPs and resolution of the mapping population
Table 2.
Knob polymorphism on chromosomes 2, 3, 5, and 8 in NAM inbreds. The primary repeat present in each knob is noted as “180” (primarily made up of the knob 180-bp repeat), “TR-1” (primarily the TR-1 repeat), or “mixed” (indicating both repeats are present)
| Inbred | 2L | 3L | 5L | 8L |
|---|---|---|---|---|
| B73 | Knobless | Knobless | 180 (small knob) | 180 |
| Tx303 | Mixed | Knobless | 180 (small knob) | Mixed |
| Oh43 | Mixed | Knobless | 180 (large knob) | Knobless |
| Oh7B | Mixed | Knobless | 180 (small knob) | Knobless |
| CML247 | Knobless | Mixed | 180 (large knob) | Mixed |
| P39 | Knobless | Knobless | 180 (large knob) | Knobless |
| Ms71 | Knobless | 180 | 180 (large knob) | 180 |
| CML69 | Knobless | Knobless | 180 (large knob) | Mixed |
| M162W | Knobless | Knobless | 180 (small knob) | 180 |
| Mo18W | Mixed | Mixed | 180 (large knob) | 180 |
| Hp301 | Knobless | 180 | Knobless | Knobless |
| NC350 | Mixed | Mixed | 180 (large knob) | TR-1 |
| NC358 | Mixed | Knobless | 180 (large knob) | 180 |
| Tzi8 | Mixed | Knobless | 180 (large knob) | 180 |
| B97 | Mixed | 180 | 180 (large knob) | Knobless |
| CML228 | Mixed | Knobless | 180 (large knob) | Mixed |
| Ki11 | Mixed | Knobless | 180 (small knob) | 180 |
| M37W | Knobless | 180 | 180 (small knob) | Knobless |
| CML322 | Mixed | Knobless | 180 (small knob) | 180 |
| CML52 | Mixed | Knobless | 180 (large knob) | Mixed |
| CML333 | Mixed | 180 | 180 (large knob) | Mixed |
| Il14H | Knobless | Knobless | 180 (small knob) | Knobless |
| Ky21 | Knobless | Knobless | 180 (small knob) | Knobless |
| CML103 | Knobless | Knobless | Knobless | Knobless |
| Ki3 | Mixed | Knobless | 180 (large knob) | 180 |
| CML277 | Mixed | Mixed | 180 (large knob) | Knobless |
Knobs affect local recombination
For three knobs, K2L, K3L, and K5L, there was sufficient knob polymorphism in the NAM population (Table 2) to carry out statistical comparisons of the effects of knobs on recombination. These diverse lines, however, cannot be compared directly because each line has a different set of polymorphic markers (SNPs) relative to B73. We therefore chose to calculate centiMorgans (cM) per megabase (Mb) values over three intervals for each knob: an interval directly proximal to the knob (on the centromere side), an interval that includes the knob, and an interval directly distal to the knob (on the telomere side; Table 3).
Table 3.
Recombination in regions including and flanking knobs on 2L, 3L, and 5L in NAM RIL populations. This table shows the mean cM/Mb values and the results of t tests (indicated by P value). See Supplementary Table 1 for the complete data set. All NAM lines were included unless appropriate SNPs in the selected regions could not be identified. Recombination is significantly reduced over the regions containing the 2L and 3L knobs when in the heterozygous condition, but not in flanking regions
| Proximal region | Knob region | Distal region | ||
|---|---|---|---|---|
| 2L | Mixed/knobless | 1.07 ± 0.37 (12) | 0.76 ± 0.3 (13) | 1.5 ± 0.24 (13) |
| Knobless/knobless | 0.81 ± 0.13 (9) | 1.53 ± 0.46 (9) | 1.82 ± 0.46 (9) | |
| P value | 0.048 | 0.001 | 0.096 | |
| 3L | Mixed/knobless | 1.29 ± 0.34 (6) | 0.61 ± 0.28 (8) | 0.83 ± 0.10 (6) |
| Knobless/knobless | 1.33 ± 0.34 (12) | 1.09 ± 0.28 (13) | 0.96 ± 0.12 (12) | |
| P value | 0.85 | 0.003 | 0.035 | |
| 5L | Large 180/small 180 | 1.07 ± 0.33 (13) | 0.64 ± 0.19 (14) | 2.51 ± 0.43 (12) |
| Small 180/small 180 | 1.06 ± 0.31 (6) | 0.92 ± 0.35 (7) | 2.64 ± 0.23 (4) | |
| P value | 0.98 | 0.086 | 0.432 |
The data reveal a clear suppression of recombination around K2L and K3L when paired with knobless chromosomes (Table 3; Supplementary Table 1). For both of these knobs, recombination was reduced up to twofold on a cM/Mb scale. This difference is particularly notable considering that the values represent averages among intervals of different sizes depending on the closest polymorphic SNPs. The reductions are also evident in graphs that compare recombination to physical distances (Fig. 3). For both chromosomes, knobs are associated with a local reduction in the slope of the recombination curves. On chromosome 5L, we compared recombination in lines heterozygous for a large and small knob to lines that were homozygous for the small knob. These data suggest that knob size polymorphism may slightly reduce recombination, although the difference was not significant (Table 3). Interestingly, in both the large/small and small/small 5L knob pairings, graphical displays show a flattening of the recombination curves over the knob site (Fig. 3).
Fig. 3.
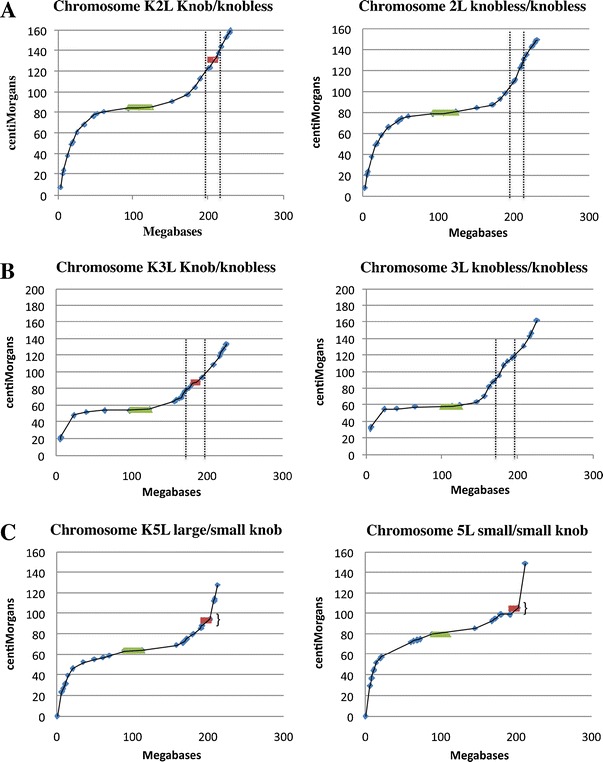
Graphical displays of merged maps from knobbed and knobless RILs. Cumulative SNP-based genetic map positions (cM) are plotted against the genomic coordinates for chromosomes 2, 3, and 5 (Mb). A steeper slope indicates higher recombination rates. SNPs are shown in blue, centromere domains in green, and knob map intervals in red. a Chromosome 2. Dotted lines delineate a region around the knob that includes 20 cM in the knobbed/knobless RILs, but which is nearly 30 cM in the knobless/knobless RILs. b Chromosome 3. As for chromosome 2 above, dotted lines delineate a region around the knob that includes 20 cM in knobbed/knobless RILs but nearly 30 cM in the knobless/knobless RILs. c Chromosome 5; comparing RILs that were heterozygous for large/small and small/small knobs. The regions around paired knobs show evidence of reduced recombination (flattening), even though most of the knob sequence is missing from the physical map. The effect would presumably be much more dramatic if the physical map were complete
We also assayed the NAM lines for changes in linkage disequilibrium (LD) around knob repeat arrays. It seemed possible that at local scales, i.e., within kilobase distances from knob repeats, recombination may be severely reduced. If this were the case, we would find that knob-linked alleles would be highly correlated with each other at a population scale (that is, they would show high levels of LD). LD can be accurately interpreted from published SNP profiles of the diverse inbreds used in the NAM metapopulation (McMullen et al. 2009). As shown in Fig. 4, we calculated and plotted LD for regions flanking each of the three knobs that were mapped to the B73 reference genome assembly (K4L2, K5L, and K9S; Fig. 4). These plots did not reveal any notable changes in LD around knobs relative to the rest of the genome.
Fig. 4.
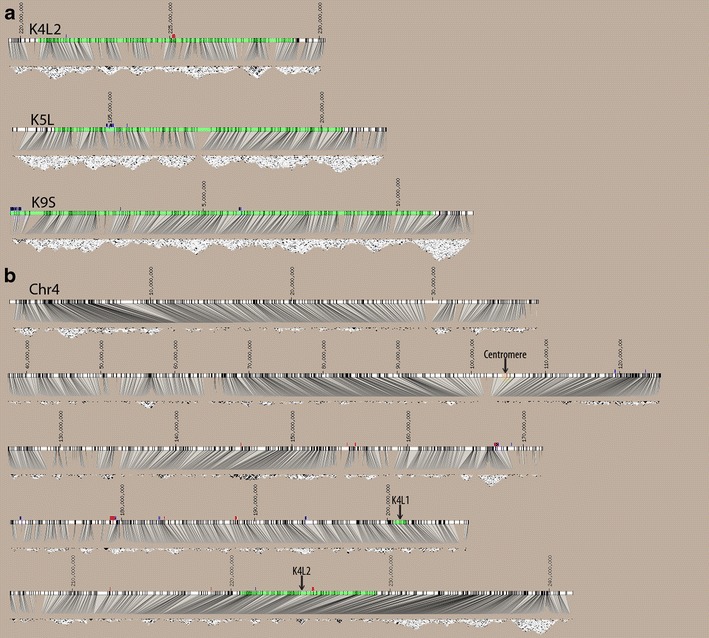
Linkage disequilibrium analyses. a LD plots for the three B73 knob regions mapped to B73 reference genome assembly. b LD plot for the entirety of chromosome 4 in five sections, short arm oriented to left. SNPs are indicated by vertical lines that connect to LD plots below. Dark gray and black areas in triangle plots indicate regions of high LD. The knob map intervals (based on genetic mapping in RILs) are show in green, TR-1 repeats in red, and 180-bp repeats in blue
Discussion
Chromosomal knobs have been indispensible tools in the study of maize genetics for many years (Creighton and McClintock 1931). Although knobs are ubiquitous in maize, they are not known to contain genes and have neither been fully sequenced nor placed on the genome assembly. In our study, using fluorescent in situ hybridization on RILs, we mapped seven knob loci (2L, 3L, 4L1, 4L2, 5L, 8L, and 9S; Table 1; Fig. 2). We went on to reassess the prior claim that knobs reduce recombination in wild-type lines (Kikudome 1959; Rhoades and Dempsey 1966). The presumption has been that large knobs act as a structural hindrance to meiotic pairing unless Ab10 is present, in which case recombination is closer to what is observed in the knobless state. Since all knobs are thought to have evolved under the influence of Ab10 (Buckler et al. 1999), the negative consequences of knobs would be minimized at the time that knobs are most fit (Dawe 2009).
A comparison of our genetic map results to the genome assembly allowed us to place three knobs on the B73 genome assembly (K4L2, K5L, and K9S). In all three cases, large arrays of the appropriate knob repeat occur within strongly supported genetic map intervals. It is important to note, however, that the actual size of all knobs is much larger than what the genome assembly indicates because it is not possible, by any current technology, to assemble long arrays of identical repeating structures. Although most knobs occupy over a million base pairs, they are represented by only a few kilobases on the genome assembly. It is interesting that there appear to be many arrays of knob repeats on the physical map that do not correspond to visible knobs. These arrays are presumably much shorter than those at the major knob sites and may represent fragments of knobs from ancient genome rearrangements, regions where knobs are cytologically visible in other inbreds but not B73, and/or assembly errors.
Rhoades and Kikudome observed a reduction in recombination near knobs, but the results have not been replicated since (Kikudome 1959; Rhoades and Dempsey 1966; Rhoades and Dempsey 1985). In our analysis, we compared recombination frequencies around three different knob loci and averaged the results from multiple divergent RILs to obtain a more comprehensive view. The data confirm that K2L and K3L suppress recombination and suggest that 5L may have a similar effect (Table 3). The K5L comparison also allows us to interpret the frequency of recombination within knob repeat arrays since it involved the pairing of a large and small knob. Both the small and large knobs are presumed to be megabases in size. If within-knob recombination occurred at levels similar to the flanking gene-rich areas, we would expect to see an upward shift in slope of the associated recombination curve (since most of the knob sequences are missing from the genome assembly). Instead, the curve is flattened, suggesting a suppression of crossing over when two homologous knob arrays are paired (Fig. 3). These results are consistent with other data showing that recombination is primarily limited to single copy gene areas and that intergenic spaces do not contribute substantially to the genetic map (Fu et al. 2002; Yao et al. 2002). The low levels of crossing over within and around knobs are also expected to limit the loss of knob repeats by unequal exchange (Charlesworth et al. 1994).
The observed decrease in recombination around K2L and K3L suggests that knobs may severely limit the genetic exchange of alleles that lie in close proximity to knob repeats, perhaps to the extent that overall allelic diversity is reduced around knobs. In this case, we would expect to see unusually high associations of alleles flanking the knob repeats when assayed at a population scale. However, we did not see any unusual patterns of LD around knob loci on chromosomes 4L, 5L, and 9S (Fig. 4). Higher resolution maps and assays of larger populations may reveal more subtle effects on LD around knobs. However, Ab10 has been reported to increase crossing over in the vicinity of knobs (Kikudome 1959; Rhoades and Dempsey 1966), and knobs only occur at high frequencies when Ab10 is segregating in a population (Buckler et al. 1999). Ab10 may serve to increase the size and frequency of knobs by meiotic drive, while at the same time minimizing the impact of knobs on LD. Further work is required to better interpret the nature of the Ab10 recombination effect, as the relevant literature is limited to a few outdated studies and has never been reassessed on a genome-wide scale.
Materials and methods
Knob mapping
For the two RIL populations, B73 × Ki3 and B73 × CML277, we scored 128 and 126 lines, respectively. Fluorescent in situ hybridization was used to identify knobs on mitotic spreads (Kato et al. 2004). The primary knob 180-bp repeat, the minor TR-1 knob repeat, and the centromere repeat CentC were labeled using oligonucleotide probes in a manner similar to that previously described (Hiatt et al. 2002). Knobs were scored and mapped as co-dominant markers. The scoring data were integrated with the existing (version 1) NAM framework (McMullen et al. 2009) by Dr. Michael McMullen at University of Missouri. Only knobs that mapped with a LOD score of at least 3.0 are reported in Table 1.
Gene density comparisons
Knob map intervals were placed on the maize reference genome assembly (B73 RefGen_v2) and displayed relative to genes (available via the MaizeGDB Genome Browser track Assembly/Genome Features: Knobs http://gbrowse.maizegdb.org/gb2/gbrowse/maize_v2/). The flanking markers from genetic mapping were BLASTed against the genome assembly, requiring a perfect match. Where the flanking markers lacked clear coordinates, the next nearest upstream (for left boundaries) or downstream (for right boundaries) markers were used.
Graphical displays of recombination
The NAM metapopulation includes a collection of 25 different RIL populations, all involving B73 and another inbred parent (B97, CML52, CML69, CML103, CML228, CML247, CML247, CML277, CML322, CML333, Hp301, Il14H, Ki3, Ky21, M37W, M162W, Mo18W, MS71, NC350, NC358, Oh43, Oh7B, P39, Tx303, and Tzi8). The genetic maps of all RIL populations (McMullen et al. 2009) were downloaded from MaizeGDB and sorted by knobbed or knobless (or large and small knob) for each chromosome. The maps from each group were combined using MergeMap (Wu et al. 2011) and processed to create a table listing chromosome, marker name, and genetic position. Sequences for the NAM markers (McMullen et al. 2009) were BLASTed against the reference assembly to identify the physical positions of each marker. The genetic and physical map data were combined into one table using a Perl script, and recombination graphs were created in Microsoft Excel.
Statistical comparison of recombination distances on knobbed and knobless chromosomes
An in-house program was written using the Microsoft .NET Excel package to identify SNPs in defined intervals relative to knobs. For each RIL population, the program identified SNPs closest to the knob, and if the distance was less than 10 cM, it looked up the genetic (cM, specific to each RIL) and physical (Mb, from the B73 reference genome) position coordinates. It then similarly identified SNPs between 5 and 30 cM away on either side, as summarized below. All SNPs and values chosen by the program were double checked manually, and the final cM/Mb values were compared statistically as shown in Table 3.
 |
Linkage disequilibrium analysis
LD analysis was based on Maize HapMapV1 (Gore et al. 2009). We used PLINK (Purcell et al. 2007) to examine genome-wide LD across all 26 NAM parents (i.e., 25 plus B73) using a small sliding window (up to 20 SNPs within 100 kb) and then repeated the analysis with larger windows (up to 200 SNPs within 1 Mb). Neither analysis showed apparent differences in LD in the knob regions. TASSEL (Bradbury et al. 2007) was used to convert data formats. Images in Fig. 4 were generated with Haploview (Barrett et al. 2005).
Electronic supplementary material
Below is the link to the electronic supplementary material.
(XLSX 22 kb)
Acknowledgments
We thank Dr. Michael McMullen for mapping knobs to genetic coordinates, as well as for his encouragement and advice. We thank Anousha Mesbah for creating the .NET program used to prepare Table 3. This work was supported by grants from the USA National Science Foundation (0951091 and 1027527) as well as the USDA–ARS.
References
- Albert PS, Gao Z, Danilova TV, Birchler JA. Diversity of chromosomal karyotypes in maize and its relatives. Cytogenet Genome Res. 2010;129:6–16. doi: 10.1159/000314342. [DOI] [PubMed] [Google Scholar]
- Ananiev EV, Phillips RL, Rines HW. A knob-associated tandem repeat in maize capable of forming fold-back DNA segments: are chromosome knobs megatransposons? Proc Nat Acad Sci USA. 1998;95:10785–10790. doi: 10.1073/pnas.95.18.10785. [DOI] [PMC free article] [PubMed] [Google Scholar]
- Barrett JC, Fry B, Maller J, Daly MJ. Haploview: analysis and visualization of LD and haplotype maps. Bioinformatics. 2005;21:263–265. doi: 10.1093/bioinformatics/bth457. [DOI] [PubMed] [Google Scholar]
- Bradbury PJ, Zhang Z, Kroon DE, Casstevens TM, Ramdoss Y, Buckler ES. TASSEL: software for association mapping of complex traits in diverse samples. Bioinformatics. 2007;23:2633–2635. doi: 10.1093/bioinformatics/btm308. [DOI] [PubMed] [Google Scholar]
- Buckler ES, Phelps-Durr TL, Buckler CSK, Dawe RK, Doebley JF, Holtsford TP. Meiotic drive of chromosomal knobs reshaped the maize genome. Genet. 1999;153:415–426. doi: 10.1093/genetics/153.1.415. [DOI] [PMC free article] [PubMed] [Google Scholar]
- Charlesworth B, Sniegowski P, Stephan W. The evoluationary dynamics of repetitive DNA in eukaryotes. Nature. 1994;371:215–220. doi: 10.1038/371215a0. [DOI] [PubMed] [Google Scholar]
- Creighton HB, McClintock B. A correlation of cytological and genetical crossing-over in Zea mays. Proc Natl Acad Sci USA. 1931;17:492–497. doi: 10.1073/pnas.17.8.492. [DOI] [PMC free article] [PubMed] [Google Scholar]
- Dawe RK. Maize centromeres and knobs (neocentromeres) In: Bennetzen JL, Hake S, editors. Handbook of maize: genetics and genomics. New York: Springer; 2009. pp. 239–250. [Google Scholar]
- Dawe RK, Hiatt EN. Plant neocentromeres: fast, focused, and driven. Chromosom Res. 2004;12:655–669. doi: 10.1023/B:CHRO.0000036607.74671.db. [DOI] [PubMed] [Google Scholar]
- Fu HH, Zheng ZW, Dooner HK. Recombination rates between adjacent genic and retrotransposon regions in maize vary by 2 orders of magnitude. Proc Nat Acad Sci USA. 2002;99:1082–1087. doi: 10.1073/pnas.132259199. [DOI] [PMC free article] [PubMed] [Google Scholar]
- Gent JI, Dong Y, Jiang J, Dawe RK (2012) Strong epigenetic similarity between maize centromeric and pericentromeric regions at the level of small RNAs, DNA methylation and H3 chromatin modifications. Nucleic Acids Research 40 [DOI] [PMC free article] [PubMed]
- Gore MA, Chia JM, Elshire RJ, Sun Q, Ersoz ES, et al. A first-generation haplotype map of maize. Science. 2009;326:1115–1117. doi: 10.1126/science.1177837. [DOI] [PubMed] [Google Scholar]
- Hiatt EN, Kentner EK, Dawe RK. Independently regulated neocentromere activity of two classes of tandem repeat arrays. Plant Cell. 2002;14:407–420. doi: 10.1105/tpc.010373. [DOI] [PMC free article] [PubMed] [Google Scholar]
- Kato A, Lamb J, Birchler J. Chromosome painting using repetitive DNA sequences as probes for somatic chromosome identification in maize. Proc Nat Acad Sci USA. 2004;101:13554–13559. doi: 10.1073/pnas.0403659101. [DOI] [PMC free article] [PubMed] [Google Scholar]
- Kato YTA. Cytological studies of maize (Zea mays L.) and teosinte (Zea mexicana Shrader Kuntze) in relation to thier origin and evolution. Massachusettes Agric Exp Station Bull. 1976;635:1–185. [Google Scholar]
- Kikudome GY. Studies on the phenomenon of preferential segregation in maize. Genet. 1959;44:815–831. doi: 10.1093/genetics/44.5.815. [DOI] [PMC free article] [PubMed] [Google Scholar]
- Lawrence CJ, Seigfried TE, Bass HW, Anderson LK. Predicting chromosomal locations of genetically mapped loci in maize using the Morgan2McClintock Translator. Genet. 2006;172:2007–2009. doi: 10.1534/genetics.105.054155. [DOI] [PMC free article] [PubMed] [Google Scholar]
- McClintock B. Chromosome morphology in Zea mays. Science. 1929;69:629. doi: 10.1126/science.69.1798.629. [DOI] [PubMed] [Google Scholar]
- McClintock B. Chromosome constitutions of Mexican and Guatemalan races of maize. In: Moore J, editor. Genes cells and organisms. New York: Garland; 1987. pp. 395–406. [Google Scholar]
- McClintock B, Yamakake T, Blumenschein A. Chromosome constitution of races of maize: its significance in the interpretation of relationships between races and varieties in the Americas. Chapingo, Mexico: Colegio de Postgraduado pp; 1981. p. 521. [Google Scholar]
- McMullen MD, Kresovich S, Villeda HS, Bradbury P, Li H, et al. Genetic properties of the maize nested association mapping population. Science. 2009;325:737–740. doi: 10.1126/science.1174320. [DOI] [PubMed] [Google Scholar]
- Peacock WJ, Dennis ES, Rhoades MM, Pryor AJ. Highly repeated DNA sequence limited to knob heterochromatin in maize. Proc Nat Acad Sci USA. 1981;78:4490–4494. doi: 10.1073/pnas.78.7.4490. [DOI] [PMC free article] [PubMed] [Google Scholar]
- Plohl M, Luchetti A, Mestrovic N, Mantovani B. Satellite DNAs between selfishness and functionality: structure, genomics and evolution of tandem repeats in centromeric (hetero)chromatin. Gene. 2008;409:72–82. doi: 10.1016/j.gene.2007.11.013. [DOI] [PubMed] [Google Scholar]
- Purcell S, Neale B, Todd-Brown K, Thomas L, Ferreira MAR, et al. PLINK: a tool set for whole-genome association and population-based linkage analyses. Am J Hum Genet. 2007;81:559–575. doi: 10.1086/519795. [DOI] [PMC free article] [PubMed] [Google Scholar]
- Rhoades M. Preferential segreagation in maize. Ames: Iowa State College Press; 1952. pp. 66–82. [Google Scholar]
- Rhoades M, Dempsey E. Structural heterogeneity of chromosome 10 in races of maize and teosinte. New York: Alan R. Liss, Inc; 1985. pp. 1–18. [Google Scholar]
- Rhoades MM, Dempsey E. Effect of abnormal chromosome 10 on preferential segregation and crossing over in maize. Genet. 1966;53:989–1020. doi: 10.1093/genetics/53.5.989. [DOI] [PMC free article] [PubMed] [Google Scholar]
- Sandler L, Novitski E. Meiotic drive as an evolutionary force. Am Nat. 1957;91:105–110. doi: 10.1086/281969. [DOI] [Google Scholar]
- Sen TZ, Andorf CM, Schaeffer ML, Harper LC, Sparks ME, et al. (2009) MaizeGDB becomes ‘sequence-centric’. Database-the Journal of Biological Databases and Curation [DOI] [PMC free article] [PubMed]
- Wu Y, Close TJ, Lonardi S. Accurate construction of consensus genetic maps via integer linear programming. Ieee-Acm Trans On Comput Biol And Bioinforma. 2011;8:381–394. doi: 10.1109/TCBB.2010.35. [DOI] [PubMed] [Google Scholar]
- Yao H, Zhou Q, Li J, Smith H, Yandeau M, et al. Molecular characterization of meiotic recombination across the 140-kb multigenic a1-sh2 interval of maize. Proc Nat Acad Sci USA. 2002;99:6157–6162. doi: 10.1073/pnas.082562199. [DOI] [PMC free article] [PubMed] [Google Scholar]
Associated Data
This section collects any data citations, data availability statements, or supplementary materials included in this article.
Supplementary Materials
(XLSX 22 kb)