Abstract.
Photoacoustic imaging employing molecular overtone vibration as a contrast mechanism opens a new avenue for bond-selective imaging of deep tissues. Broad use of this modality is, however, hampered by the extremely low conversion efficiency of optical parametric oscillators at the overtone transition wavelengths. To overcome such a barrier, we demonstrate the construction and use of a compact, barium nitrite crystal-based Raman laser for photoacoustic imaging of overtone vibrations. Using a 5-ns laser as the pumping source, up to 21.4 mJ pulse energy at 1197 nm was generated, corresponding to a conversion efficiency of 34.8%. Using the 1197 nm pulses, three-dimensional photoacoustic imaging of intramuscular fat was demonstrated.
Keywords: Raman laser, stimulated Raman scattering, lipid, photoacoustic imaging, molecular vibration
With optical absorption contrast and ultrasonic spatial resolution, photoacoustic (PA) tomography has been applied to animals or human organs such as breast, brain, and skin.1–6 In the past, the majority of the PA imaging studies have been based on electronic absorption of molecules and nanostructures. Photoacoustic imaging employing molecular overtone vibration as a contrast mechanism opens a new avenue for bond-selective imaging of deep tissues. In particular, overtones of bond vibration have been adopted to visualize lipid and collagen.7–13 In order to resonate with bond vibration, laser wavelengths at 1210 or 1730 nm are used, where the absorption peaks of the second and first overtone reside.14 Currently, the optical parametric oscillator (OPO) pumped by harmonics of laser is employed to generate the necessary wavelengths.7–12 However, the conversion efficiency at the aforementioned specific wavelengths is very low, making it difficult to generate high pulse energy needed for vibrational PA tomography. In addition, the cost of an OPO often exceeds that of the pump laser.
Herein, we describe an approach to address the aforementioned barriers by efficiently shifting the wavelength of a laser with a homebuilt solid-state Raman laser. The Raman laser, also called a Raman shifter, is based on the process of stimulated Raman scattering in a gain medium. The output wavelength of a Raman laser is determined by the pump wavelength and Raman shifts of the medium. By virtue of excellent properties, barium nitrite [] crystal-based Raman lasers have been reported in a lot of literature.15–21 The crystal is an isotropic material with cubic symmetry. Its Raman spectrum is dominated by a strong peak at , which corresponds to the “breathing” mode of the molecular group. At room temperature, the Raman gain coefficient of crystal is , pumped by the 1064-nm laser. The optical damage threshold is ca. .22,23 Herein, we demonstrate for the first time the construction and use of a crystal-based Raman laser for vibration-based PA imaging. Using a 10-Hz laser as the pumping source, up to 21.4 mJ pulse energy at 1197 nm was obtained, corresponding to the conversion efficiency of 34.8%. PA imaging of intramuscular fat sample was performed to prove the concept of using a Raman laser to map lipid distribution in biological tissues.
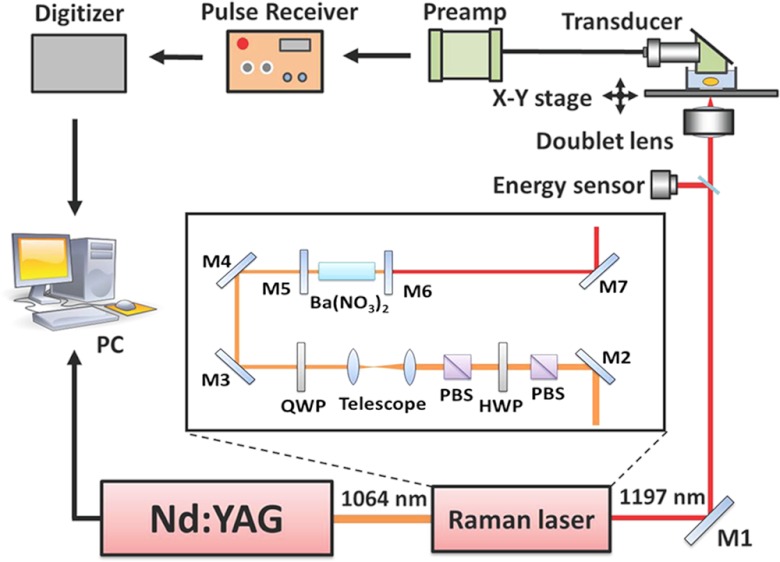
A schematic of our setup is shown in Fig. 1. The crystal (MolTech GmbH, Germany) was pumped by a Q-switched laser (Continuum Surelite SL III-10) operated with a 10 Hz repetition rate and 5 ns pulse duration (FWHM). A polarizing beam splitter (PBS) was used to purify the polarization of the fundamental 1064-nm laser light. A half-wave plate (HWP) and a second PBS were combined and used as a variable attenuator to adjust the pump pulse energy. A telescope composed of two positive lenses with focal lengths of 200 and 75 mm was employed to reduce the pump beam size to match the dimensions of the crystal. For the Raman laser, a flat-flat resonator with a cavity length of about 10 cm was used. The resonator end mirror (Lattice Electro Optics, Inc.) was coated with high reflectivity at 1197 nm (). The output coupler (Lattice Electro Optics, Inc.) was coated with high reflectivity at 1064 nm () and 40% transmission at 1197 nm. The crystal, with dimensions of , was coated with high transmission at 1064 and 1197 nm on both faces. The generated 1197-nm Raman laser was directed into an inverted microscope (IX71, Olympus) for PA imaging. An achromatic doublet lens (30 mm focal length, Thorlabs) was applied to focus the Raman laser on the samples. The PA signals were detected by a focused ultrasonic transducer (V317, Olympus NDT), followed by a preamplifier (5682, Olympus NDT) and a pulse receiver (5073 PR-15-U, Olympus NDT). The collected PA signals were then sent to a digitizer (USB-5133, National Instrument), and retrieved via a customized LabVIEW program. To perform 3-D vibrational PA imaging, an XY translational stage (ProScan H117, Prior) was employed for raster scanning of samples.
Fig. 1.
Schematic of a photoacoustic microscope equipped with a crystal-based Raman laser. M1, M2, M3, and M4: 45 deg 1064 nm reflective mirror. PBS: polarizing beam splitter; HWP: half wave plate; QWP: quarter wave plate; M5: resonator end mirror; M6: output coupler; M7: silver mirror; PC: computer.
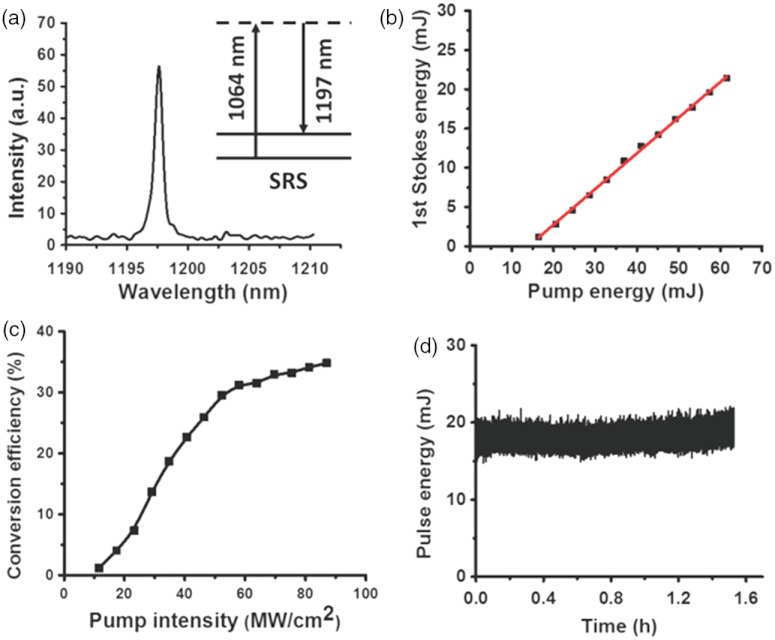
Performances of the Raman laser are shown in Fig. 2. The spectral profile of the Raman laser output, measured by the USB 2000 spectrometer (Ocean Optics), indicates the central wavelength of ca. 1197.6 nm [Fig. 2(a)]. The maximum pump energy was limited to 60 mJ by crystal damage threshold, with maximum output pulse energy measured to be 21.4 mJ, corresponding to a slope efficiency of 45.4% [Fig. 2(b)]. The key parameter, conversion efficiency, was defined as the pulse energy of the Raman laser divided by the pulse energy of the pump laser incident on the crystal. As shown in Fig. 2(c), the maximum conversion efficiency is about 34.8%, which is much larger than 0.5%, the efficiency for the OPO system we used before (Panther EX Plus, Continuum). The threshold for the 1st Stokes Raman laser was measured to be . The discrepancy between the experimental value and the theoretical value () may arise from the optical losses resulted from deflection and diffraction.19 Variation of the 1st Stokes output energy obtained with 60 mJ pump energy (incident on the crystal) were plotted up to 1.5 h, as shown in Fig. 2(d). The maximum pulse energy drop was 12%, which may be caused by the fluctuation of the pump laser (6%) and instability of the cavity.
Fig. 2.
Characteristics of the crystal-based Raman laser. (a) Spectral profile of the Raman laser output. (b) The 1st Stokes energy as a function of the pump energy incident on the Raman crystal. Red solid line is a linear fit. (c) Conversion efficiency with respect to the pump intensity incident on the Raman crystal. (d) Pulse energy of Raman laser as a function of time.
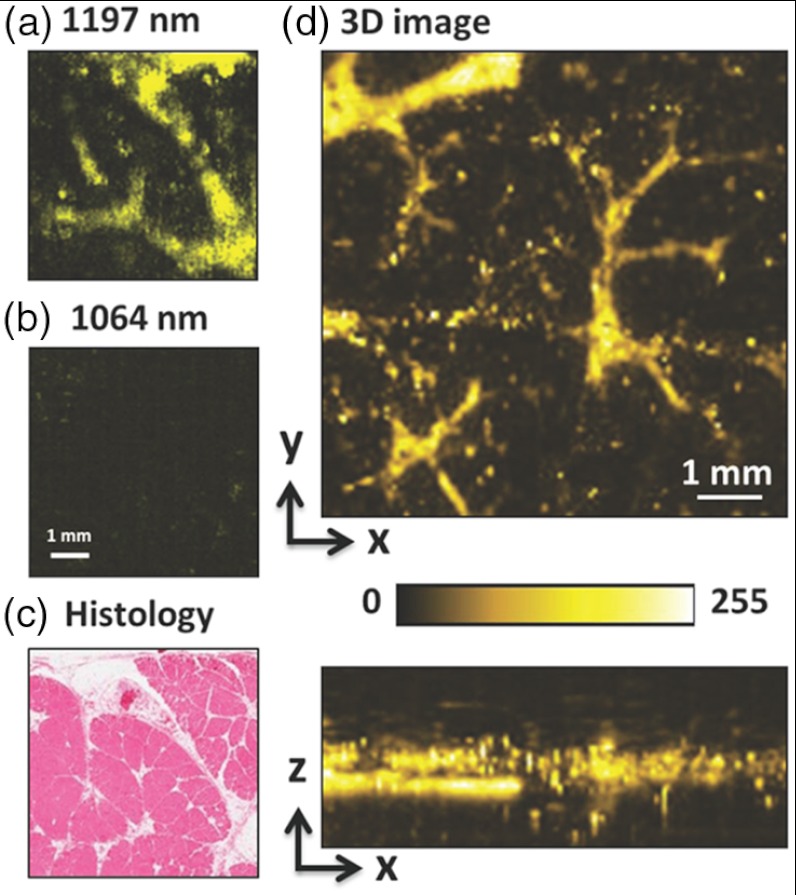
Intramuscular fat was employed to demonstrate the capability of the Raman Laser for PA imaging. The muscle samples, which were cut into pieces, were harvested from a goat and then preserved in fixative 10% buffered formalin. The small muscle piece was then placed in a glass bottom dish and embedded with -agarose gel for the subsequent PA imaging. With the pulse energy of 60 µJ on the sample, PA imaging of intramuscular fat was conducted, as shown in Fig. 3. On-resonant and off-resonant PA images are shown in Fig. 3(a) and 3(b). A strong signal was found at 1197 nm and the contrast nearly disappeared at 1064 nm. These data demonstrate that PA signal is generated from the bond overtone vibration of lipid. This lipid imaging capability was further confirmed by histological examination of the same tissue [Fig. 3(c)], where the same morphology of fat (white color) was observed. On the same setup, we further demonstrated 3-D PA imaging of intramuscular fat [Fig. 3(d)], with an axial resolution of 110 µm, a lateral resolution of 60 µm, and an imaging depth of .
Fig. 3.
PA imaging of intramuscular fat performed with the Raman laser. (a) En face maximum intensity projection PA image of intramuscular fat sample with 1197 nm excitation. (b) En face maximum intensity projection PA image of intramuscular fat sample with 1064 nm excitation. (c) Histological evaluation of the same intramuscular fat sample. (d) Three-dimensional PA image of a separate intramuscular fat sample. Pulse energy: 60 J. Image size: .
In conclusion, we demonstrated PA imaging of lipids with a compact crystal-based Raman laser. Up to 21.4 mJ pulse energy at 1197 nm was produced, corresponding to the conversion efficiency of 34.8%. The high conversion efficiency of the Raman laser would enable vibrational PA tomography by using a larger crystal to endure larger incident pulse energy and generate pulse energy at 1197 nm (currently under progress). Notably, such energy is considered to be safe for human studies according to the American National Standard (Z136.1–2000). PA tomography with overtone vibration as contrast is expected to open new opportunities for bond-selective imaging of biological tissues with an imaging depth and field of view both on the centimeter scale.
Acknowledgments
This work was supported by NIH R21 EB015901. The authors thank Bob Tamosaitis of 4AD Enterprises Inc. for insightful discussion.
References
- 1.Wang X., et al. , “Noninvasive imaging of hemoglobin concentration and oxygenation in the rat brain using high-resolution photoacoustic tomography,” J. Biomed. Opt. 11(2), 024015 (2006). 10.1117/1.2192804 [DOI] [PubMed] [Google Scholar]
- 2.Wang X., et al. , “Noninvasive laser-induced photoacoustic tomography for structural and functional in vivo imaging of the brain,” Nat. Biotechnol. 21(7), 803–806 (2003). 10.1038/nbt839 [DOI] [PubMed] [Google Scholar]
- 3.Ku G., et al. , “Thermoacoustic and photoacoustic tomography of thick biological tissues toward breast imaging,” Technol. Cancer Res. Treat. 4(5), 559–566 (2005). [DOI] [PubMed] [Google Scholar]
- 4.Zhang H. F., et al. , “Functional photoacoustic microscopy for high-resolution and noninvasive in vivo imaging,” Nat. Biotechnol. 24(7), 848–851 (2006). 10.1038/nbt1220 [DOI] [PubMed] [Google Scholar]
- 5.Ku G., et al. , “Multiple-bandwidth photoacoustic tomography,” Phys. Med. Biol. 49(7), 1329–1338 (2004). 10.1088/0031-9155/49/7/018 [DOI] [PubMed] [Google Scholar]
- 6.Xu M., Wang L. V., “Photoacoustic imaging in biomedicine,” Rev. Sci. Instrum. 77(4), 041101 (2006). 10.1063/1.2195024 [DOI] [Google Scholar]
- 7.Wang H. W., et al. , “Label-free bond-selective imaging by listening to vibrationally excited molecules,” Phys. Rev. Lett. 106(23), 238106 (2011). 10.1103/PhysRevLett.106.238106 [DOI] [PMC free article] [PubMed] [Google Scholar]
- 8.Wang P., et al. , “Bond-selective imaging of deep tissue through the optical window between 1600 and 1850 nm,” J. Biophoton. 5(1), 25–32 (2012). 10.1002/jbio.v5.1 [DOI] [PMC free article] [PubMed] [Google Scholar]
- 9.Wang P., et al. , “Hyperspectral vibrational photoacoustic imaging of lipids and collagen,” Proc. SPIE 8223, 82231I (2012). 10.1117/12.908714 [DOI] [Google Scholar]
- 10.Allen T. J., et al. , “Spectroscopic photoacoustic imaging of lipid-rich plaques in the human aorta in the 740 to 1400 nm wavelength range,” J. Biomed. Opt. 17(6), 061209 (2012). 10.1117/1.JBO.17.6.061209 [DOI] [PubMed] [Google Scholar]
- 11.Jansen K., et al. , “Intravascular photoacoustic imaging of human coronary atherosclerosis,” Opt. Lett. 36(5), 597–599 (2011). 10.1364/OL.36.000597 [DOI] [PubMed] [Google Scholar]
- 12.Wang B., et al. , “Intravascular photoacoustic imaging of lipid in atherosclerotic plaques in the presence of luminal blood,” Opt. Lett. 37(7), 1244–1246 (2012). 10.1364/OL.37.001244 [DOI] [PubMed] [Google Scholar]
- 13.Wang B., et al. , “Detection of lipid in atherosclerotic vessels using ultrasound-guided spectroscopic intravascular photoacoustic imaging,” Opt. Express 18(5), 4889–4897 (2010). 10.1364/OE.18.004889 [DOI] [PMC free article] [PubMed] [Google Scholar]
- 14.Anderson R. R., et al. , “Selective photothermolysis of lipid-rich tissues: a free electron laser study,” Lasers Surg. Med. 38(10), 913–919 (2006). 10.1002/(ISSN)1096-9101 [DOI] [PubMed] [Google Scholar]
- 15.Basiev T. T., et al. , “Conversion of the tunable radiation from a laser utilizing the L1f crystal with F2 color-centers by the Srs emission in and crystals,” Kvantovaya Elektron. 14(12), 2452–2454 (1987). [Google Scholar]
- 16.Ammann E. O., Decker C. D., “0.9-W Raman oscillator,” J. Appl. Phys. 48(5), 1973–1975 (1977). 10.1063/1.323904 [DOI] [Google Scholar]
- 17.Kerl J., Sponfeldner T., Beyrau F., “An external Raman laser for combustion diagnostics,” Combust. Flame 158(10), 1905–1907 (2011). 10.1016/j.combustflame.2011.03.004 [DOI] [Google Scholar]
- 18.Zverev P. G., Basiev T. T., Prokhorov A. M., “Stimulated Raman scattering of laser radiation in Raman crystals,” Opt. Mater. 11(4), 335–352 (1999). 10.1016/S0925-3467(98)00032-9 [DOI] [Google Scholar]
- 19.Pask H. M., “The design and operation of solid-state Raman lasers,” Prog. Quantum Electron. 27(1), 3–56 (2003). 10.1016/S0079-6727(02)00017-4 [DOI] [Google Scholar]
- 20.Cerny P., et al. , “Solid state lasers with Raman frequency conversion,” Prog. Quantum Electron. 28(2), 113–143 (2004). 10.1016/j.pquantelec.2003.09.003 [DOI] [Google Scholar]
- 21.Pask H. M., et al. , “High average power, all-solid-state external resonator Raman laser,” Opt. Lett. 28(6), 435–437 (2003). 10.1364/OL.28.000435 [DOI] [PubMed] [Google Scholar]
- 22.Zverev P. G., et al. , “Stimulated Raman-scattering of picosecond pulses in barium nitrate crystals,” Opt. Commun. 97(1–2), 59–64 (1993). 10.1016/0030-4018(93)90617-E [DOI] [Google Scholar]
- 23.Zverev P. G., et al. , “Physical, chemical and optical properties of barium nitrate Raman crystal,” Opt. Mat. 11(4), 315–334 (1999). 10.1016/S0925-3467(98)00031-7 [DOI] [Google Scholar]


