

Abstract
Objective
To evaluate the potency of carboxymethyl chitosan-2, 2′ ethylenedioxy bis-ethylamine-folate (CMC-EDBE-FA) on tissue injury, antioxidant status and glutathione system in tissue mitochondria and serum against nicotine-induced oxidative stress in mice.
Methods
CMC-EDBE-FA was prepared on basis of carboxymethyl chitosan tagged with folic acid by covalently linkage through 2, 2′ ethylenedioxy bis-ethylamine. Animals were divided into four groups, i.e., control, nicotine (1 mg/kg bw/day), CMC-EDBE-FA (1 mg/kg bw/day) and nicotine (1 mg/kg bw/day) and CMC-EDBE-FA (1 mg/kg bw/day) for 7 days. Levels of lipid peroxidation, oxidized glutathione level, antioxidant enzyme status and DNA damage were observed and compared.
Results
The significantly increase of lipid peroxidation, oxidized glutathione levels and DNA damage was observed in nicotine treated group as compared with control group; those were significantly reduced in CMC-EDBE-FA supplemented group. Moreover, significantly reduced antioxidant status in nicotine treated group was effectively ameliorated by the supplementation of CMC-EDBE-FA. Only CMC-EDBE-FA treated groups showed no significant change as compared with control group; rather than it repairs the tissue damage of nicotine treated group.
Conclusions
These findings suggest that CMC-EDBE-FA is non-toxic and ameliorates nicotine-induced toxicity.
Keywords: Carboxymethyl chitosan, Nicotine, Glutathione, Antioxidants, Deoxyribonucleic acid fragmentation, Antioxidative effect, Folate, Lipid peroxidation, Oxidized
1. Introduction
Chitin, a natural biopolymer, is the major structural component of invertebrates like crab, shrimp, shells and the cell walls of fungi. Chitosan (CS) is the deacetylated form of chitin. CS is a linear polysaccharide, composed of glucosamine and N-acetyl glucosamine linked in a β linkage[1],[2]. Molecular weight and degree of deacetylation are the main factors affecting the particle size, particles formation and aggregation. Depending on the source and preparation procedure, molecular weight of CS ranges from 300 to over 1 000 kD with a degree of deacetylation from 30% to 95%. CS has been reported to possess immune stimulating properties such as promoting resistance to bacterial infection, increasing accumulation and activation of macrophages and polymorphonucleus, suppressing tumor growth, augmenting antibody responses and inducing production of cytokines[3]. Utilization of CS derived from crustacean shells may cause hypersensitivity reactions in individual with shellfish allergy[4]. CS from the cell walls of fungi grown under controlled conditions offers greater potential for a more desirable product.
Carboxymethyl chitosan (CMC) is a linear polysaccharide composed of β (1, 4) glycosidic linkages between 6-carboxymethyl-D-glucosamine monomers. CMC is synthesized from CS by carboxylation of the hydroxyl and amine groups[5]. CMC is a water-soluble and biodegradable polymer. Amino and carboxyl functional group of CMC can serve as chelation sites and form complexes with pharmaceuticals[6]. CMC is often used as a pharmaceutical excipient because it offers the advantage of easy chemical modifications due to the primary amino group at the C2-position and the carboxyl group at the C6-position of each polymer subunit[7],[8]. CMC demonstrates potential applications in biotechnology, biomedicine, food ingredients and cosmetics[9],[10]. In our previous laboratory report, we synthesized CMC-EDBE-FA nanoparticle based on carboxy methyl chitosan tagged with folic acid by covalently linkage through 2, 2β (ethylenedioxy) bis-(ethylamine)[11].
Nicotine, as most biologically active chemical in tobacco smoke, is potent oxidants. Previous in vivo and in vitro experiments in our laboratory have shown that intraperitoneal nicotine administration for 7 days results in the imbalance of prooxidant/antioxidant status in the liver, kidney, heart, lung and spleen of male Wistar rats[12]; nicotine severely damages the DNA and imbalance the prooxidant/antioxidant status in rat peripheral blood lymphocytes[13]; nicotine dose dependently generated superoxide radical and damages the lipid, protein and diminished the antioxidant status in murine peritoneal macrophages[14].
The present study was undertaken to evaluate the potency of CMC-EDBE-FA on antioxidant status and glutathione system in tissue mitochondria and serum during nicotine induced oxidative stress in male Swiss mice.
2. Materials and methods
2.1. Chemicals and reagents
Sodium dodecyl sulfate (SDS), 5′, 5′-dithio (bis)-2- nitrobenzoic acid (DTNB), standard reduced glutathione (GSH), glutathione reductase (GR), NADPH, Na4, NADPH, oxidized glutathione (GSSG), folic acid (FA), chitosan (medium molecular weight), dicyclohexyl carbodiimide (DCC), trifluroacetic acid, 2, 2′-(ethylenedioxy)-bis-(ethylamine) (EDBE), di-tert-butyldicarbonate (BoC2O), N-hydroxysuccinimide (NHS) and 1-[(3-dimethylamino) propyl]-3-ethylcarbodiimide hydrochloride (EDC) were procured from Sigma (St. Louis, MO, USA). Sodium chloride (NaCl), sodium dodecyl sulfate, formalin, sucrose and ethylene diamine tetra acetate (EDTA) were purchased from Himedia, India. Tris-Hcl, KH2PO4, K2HPO4, formaldehyde, alcohol, paraffin wax, xylene, haematoxylin, eosin, DPX, diphenylamine (DPA) and other chemicals were procured from Merck Ltd., SRL Pvt. Ltd., Mumbai, India. All other chemicals were from Merck Ltd., SRL Pvt., Ltd., Mumbai and were of the highest purity grade available. Commercially available dimethyl sulfoxide (DMSO) and N, N-dimethyl formamide (DMF) were procured from BDH, (India) and were purified by vacuum distillation. Pyridine (BDH) was purified by distillation over KOH. Monochloroacetic acid was obtained from E. Merck Germany.
2.2. Animals
Experiments were performed using Swiss male mice 6-8 weeks old, weighing 20-25 g. The animals were fed standard pellet diet with vitamins, antibiotic and water were given ad libitum and housed in polypropylene cage (Tarson) in the departmental animal house with 12 h light:dark cycle under standard temperature [(25±2) °C]. The animals were allowed to acclimatize for one week. The animals used in this study did not show any sign of malignancy or other pathological processes. Animals were maintained in accordance with the guidelines of the National Institute of Nutrition, Indian Council of Medical Research, Hyderabad, India, and approved by the Ethical Committee of Vidyasagar University.
2.3. Preparation of CMC-EDBE-FA
CMC-EDBE-FA was synthesized via reaction of the carboxyl group of carboxymethyl chitosan with the primary amine group of FA-EDBE in the presence of 1-ethyl-3-(3-dimethylaminopropyl) carbodiimide (EDC). EDC, a coupling cross linker, first reacted with the carboxyl group of carboxymethyl chitosan to form an active ester intermediate. The formed intermediate can react with the primary amine of FA-EDBE to form an amide bond. The formation of amide bond between carboxymethyl chitosan and FA-EDBE was confirmed from FTIR and 1HNMR spectrum. Characterization of CMC-EDBE-FA was carried out by 1HNMR, FTIR spectrum, TEM and DLS study[11].
2.4. Treatment schedule
The animals were randomized into experimental and control groups and divided into four groups of eight animals each. Mice in group A served as sham control; group B served as nicotine treated (1.0 mg/kg bw/day); group C served as CMC-EDBE-FA treated (1.0 mg/kg bw/day) and animals of group D were served as nicotine treated (1.0 mg/kg bw/day) along with supplementation of CMC-EDBE-FA (1.0 mg/kg bw/day). All the treatments were done intraperitoneally (i.p.) for a period of 7 days. The dose, duration and route of nicotine administration were selected as per our previous laboratory report[12]. CMC-EDBE-FA was administered intraperitoneally as we want to observe the potency of CMC-EDBE-FA in comparison with nicotine. The experiment was terminated at the end of 7 days and all animals were sacrificed by an intraperitoneal injection of sodium pentobarbital (60-70 mg/kg bw)[15].
2.5. Separation of serum and tissue
After decapitation, liver, kidney and spleen were excised from experimental mice of different experimental groups and washed with cold normal saline. Washed tissues of two mice from each group were perfused with normal saline and formalin for histological study and rest washed tissues of six mice were immediately immersed in liquid nitrogen and stored at -80 °C for isolation of tissue mitochondria. Serum was obtained by centrifugation at 1 500 µg for 15 min of blood samples taken without anticoagulant. Serum was kept at -80 °C for the biochemical estimation of different parameters.
2.6. Isolation of tissue mitochondria
Mitochondria of liver, kidney and spleen were isolated using the method described by Aprille and Austin[16]. Tissues were homogenized in the ice-cold buffer containing 0.25 M sucrose, 1 mM EDTA, and 1 mM Tris-HCl, pH 7.4. The homogenate was first centrifuged at 600 g for 10 min at 4 °C, and the supernatant fractions were collected and further centrifuged at 8 000 g for 20 min at 4 °C to pellet mitochondria. After washing with 0.25 M sucrose buffer containing 1 mM EDTA and 1 mM Tris-HCl, pH 7.4, mitochondrial pellets were resuspended in 0.25 M sucrose buffer containing 1 mM Tris-HCl, pH 7.4 and stored at -80 °C for the biochemical estimation of different parameters.
2.7. Histological evaluation
Histological analysis of liver, kidney and spleen of each experimental group was performed by the method of Iranloye and Bolarinwa[17]. The tissues that were perfused in saline and formalin were fixed for 7 days in 10% formaldehyde after which dehydration was carried out in ascending grade of alcohol. The tissues were then cleared of xylene overnight (16 h) to remove the alcohol. Infiltration/impregnation was done in three changes of molten soft paraffin wax at ≤68 °C for 1 h each. Embedding and casting in paraffin wax with wooden block was done and sectioning of 5 µm thick carried out using a microtome. The sectioned tissues of liver, kidney and spleen were mounted on slides using a thin film of egg albumen smeared on each side. The sections were deparaffinated in xylene, passed through alcohol, stained with haematoxylin-eosin, mounted in neutral DPX medium. The slides were then evaluated for pathological changes under Olympus research phase contrast microscope (Model: CX41; Olympus Singapore Pvt. Ltd., Valley Point Office Tower, Singapore).
2.8. Biochemical estimation
2.8.1. Determination of lipid peroxidation (MDA)
Lipid peroxidation of serum and mitochondria of liver, kidney and spleen was estimated by the method of Ohkawa et al[18]. Briefly, the reaction mixture contained Tris-HCl buffer (50 mM, pH 7.4), tetra-butyl hydroperoxide (BHP) (500 µM in ethanol) and 1 mM FeSO4. After incubating the samples at 37 °C for 90 min, the reaction was stopped by adding 0.2 mL of 8% sodium dodecyl sulfate (SDS) followed by 1.5 mL of 20% acetic acid (pH 3.5). The amount of malondialdehyde (MDA) formed during incubation was estimated by adding 1.5 mL of 0.8% TBA and further heating the mixture at 95 °C for 45 min. After cooling, samples were centrifuged, and the TBA reactive substances (TBARS) were measured in supernatants at 532 nm by using 1.53 ×10⁵ M−1 cm−1 as extinction coefficient. The levels of lipid peroxidation were expressed in terms of n mol/mg protein.
2.8.2. Determination of reduced glutathione (GSH)
Reduced glutathione estimation in serum and mitochondria of liver, kidney and spleen was performed by the method of Moron et al[19]. The required amount of sample was mixed with 25% of TCA and centrifuged at 2 000 g for 15 min to settle the precipitated proteins. The supernatant was aspirated and diluted to 1 mL with 0.2 M sodium phosphate buffer (pH 8.0). Later, 2 mL of 0.6 mM DTNB was added. After 10 min the optical density of the yellow-colored complex formed by the reaction of GSH and DTNB (Ellman's reagent) was measured at 405 nm. A standard curve was obtained with standard reduced glutathione. The levels of GSH were expressed as µg of GSH/mg protein.
2.8.3. Determination of oxidized glutathione (GSSG)
The oxidized glutathione level in serum and mitochondria of liver, kidney and spleen was measured after derevatization of GSH with 2-vinylpyidine according to the method of Griffith[20]. In brief, with 0.5 mL sample, 2 µL of 2-vinylpyidine was added and incubates for 1 h at 37 °C. Then the mixture was deprotenized with 4% sulfosalicylic acid and centrifuged at 1 000 g for 10 min to settle the precipitated proteins. The supernatant was aspirated and GSSG level was estimated with the reaction of DTNB at 412 nm in spectrophotometer and calculated with standard GSSG curve.
2.8.4. Activity of super oxide dismutase (SOD)
SOD activity of serum and mitochondria of liver, kidney and spleen was determined from its ability to inhibit the auto-oxidation of pyrogalol according to Mestro Del and McDonald[21]. The reaction mixture consisted of 50 mM Tris (hydroxymethyl) amino methane (pH 8.2), 1 mM diethylenetriamine penta acetic acid, and 20-50 µL of sample. The reaction was initiated by addition of 0.2 mM pyrogalol, and the absorbance measured kinetically at 420 nm at 25 °C for 3 min. SOD activity was expressed as unit/ mg protein.
2.8.5. Activity of catalase (CAT)
Catalase activity of serum and mitochondria of liver, kidney and spleen was measured by the method of Luck[22]. The final 3 mL of reaction mixture contained 0.05 M Tris-buffer, 5 mM EDTA (pH 7.0), and 10 mM H2O2 (in 0.1 M potassium phosphate buffer, pH 7.0). About 50 µL of sample was added to the above mixture. The rate of change of absorbance per min at 240 nm was recorded. Catalase activity was calculated by using the molar extinction coefficient of 43.6 M−1 cm−1 for H2O2. The level of CAT was expressed in terms of µ mol H2O2 consumed/min/mg protein.
2.8.6. Activity of glutathione peroxidase (GPx)
The GPx activity of serum and mitochondria of liver, kidney and spleen was measured by the method of Paglia and Valentine[23]. The reaction mixture contained 50 mM potassium phosphate buffer (pH 7.0), 1 mM EDTA, 1 mM sodium azide, 0.2 mM NADPH, 1 U glutathione reductase and 1 mM reduced glutathione. The sample, after its addition, was allowed to equilibrate for 5 min at 25 °C. The reaction was initiated by adding 0.1 mL of 2.5 mM H2O2. Absorbance at 340 nm was recorded for 5 min. Values were expressed as n mol of NADPH oxidized to NADP by using the extinction coefficient of 6.2 × 10³ M−1 cm−1 at 340 nm. The activity of GPx was expressed in terms of n mol NADPH consumed/min/mg protein.
2.8.7. Activity of glutathione reductase (GR)
The GR activity of serum and mitochondria of liver, kidney and spleen was measured by the method of Miwa[24]. The tubes for enzyme assay were incubated at 37 °C and contained 2.0 mL of 9 mM GSSG, 0.02 mL of 12 mM NADPH, Na4, 2.68 mL of 1/15 M phosphate buffer (pH 6.6) and 0.1 mL of sample. The activity of this enzyme was determined by monitoring the decrease in absorbance at 340 nm. The activity of GR was expressed in terms of n mol NADPH consumed/min/mg protein.
2.8.8. Activity of glutathione-s-transferase (GST)
The GST activity of serum and mitochondria of liver, kidney and spleen was measured by the method of Habig et al[25]. The tubes of enzyme assay were incubated at 25 °C and contained 2.85 mL of 0.1 M potassium phosphate (pH 6.5) containing 1 mM of GSH, 0.05 mL of 60 mM 1-chloro-2, 4-dinitrobengene and 0.1 mL of sample. The activity of this enzyme was determined by monitoring the increase in absorbance at 340 nm.
2.8.9. Mitochondrial DNA fragmentation assay by DPA assay
The diphenylamine (DPA) reaction of mitochondria of liver, kidney and spleen was performed by the method of Paradones et al[26]. Perchloric acid (0.5 M) was added to the sample containing uncut DNA (resuspended in 200 µL of hypotonic lysis buffer) and to the other half of the supernatant containing DNA fragments. Then two volumes of a solution consisting of 0.088 M DPA, 98% (v/v) glacial acetic acid, 1.5% (v/v) sulphuric acid, and a 0.5% (v/v) concentration of 1.6% acetaldehyde solution were added. The samples were stored at 4 °C for 48 h. The reaction was quantified spectrophotometrically at 575 nm. The percentage of fragmentation was calculated as the ratio of DNA in the supernatants to the total DNA.
2.9. Protein estimation
Protein was determined according to Lowry et al[27] using bovine serum albumin as standard.
2.10. Statistical analysis
The data were expressed as mean±SEM, n=6. Comparisons of the means of control, nicotine and CMC-EDBE-FA treated group were made by two-way ANOVA test (using a statistical package, Origin 6.1, Northampton, MA 01060 USA) with multiple comparison t-tests, P<0.05 as a limit of significance.
3. Results
3.1. Characterization of CMC-EDBE-FA
The peak assignment of CMC was as follows, 1 741 cm−1 (-COOH), 1 070-1 136 cm−1 (-C-O) and 1 624 and 1 506 cm−1 (-NH3+). FA-EDBE showed the characteristic absorption bands at 1 650 and 1 550 cm−1 located in the zone related to the (-CONH-), corresponding, respectively, to the (C=O) stretching band and to the (-NH) bending vibration band. The presence of these two bands indicates that an amide bond has been formed between -COOH of folic acid and the -NH2 amine end group of EDBE. The more characteristic of these two bands have become more prominent and intense in CMC-EDBE-FA. This provides evidence for the formation of an extra amide bond during the attachment of folic acid. 1H NMR spectrum of CMC-EDBE-FA showed the peaks at about 1.9 ppm attributed to the methyl hydrogen of acetamido-2-deoxy-β-D-glucopyranosyl unit; the peaks at about 2.9-3.2 ppm attributed to methylene hydrogen atoms of EDBE and 3.5-4 ppm observed the glucopyranosyl hydrogen atoms. It was clear the proton peaks of 8.7, 7.6, 6.9, 6.4 ppm were observed in 1H NMR spectrum of CMC-EDBE-FA. No such peaks were observed in the same chemical shifts of 1H NMR spectrum for CMC. The appearance of these peaks confirms the successful conjugation of FA-EDBE with CMC. The size of CMC-EDBE-FA self-assembled nanoparticles in aqueous medium measured by dynamic laser light-scattering (DLS) ranged between (210±40) nm. The morphology of CMC-EDBE-FA self-aggregated nanoparticles was investigated by TEM. The nanoaggregate shows a spherical geometry and having a uniform size. At lower magnification nanoparticles having an average size of about 50 nm were observed[11].
3.2. Histological study
Histological analysis revealed that nicotine administration resulted with severe pathological changes and tissue injury in liver, kidney and spleen. On the other hand, CMC-EDBE-FA treatment showed no tissue damage in liver, kidney and spleen. This was confirmed by histopathological examinations of the liver, kidney and spleen.
Microscopic observations of control liver showed regular structure of hepatic lobules, central vein and polyhedral cell (Figure 1a) while in nicotine treated group (1 mg/kg bw/day) the liver showed portal inflammation, sinusoidal dilatation and dilatation of central vein (Figure 1b). CMC-EDBE-FA supplementation to nicotine treated mice repaired the dilatation of central vein (Figure 1d). Control kidney showed prominent regular structure of Bowman's capsule and collecting tube (Figure 2a) while in the nicotine treated group (1 mg/kg bw/day) the kidney was extensively degenerated with severe vasocongestion and edema in the parenchyma, also there were wide dilatations in the Bowman's capsule. In most areas the Bowman's capsule had lost its structural morphology (Figure 2b). Supplementation of CMC-EDBE-FA to nicotine treated mice caused the repairing of Bowman's capsule (Figure 2d). Microscopic observations of control spleen showed regular structure of red pulp and white pulp (Figure 3a) while in nicotine treated group (1 mg/kg bw/day) the spleen showed degeneration of red pulp and white pulp (Figure 3b). Supplementation of CMC-EDBE-FA to nicotine treated mice caused regeneration of red pulp (Figure 3d). CMC-EDBE-FA treatment (1 mg/kg bw/day) showed no tissue damage in liver, kidney and spleen of experimental mice (Figure 1c, 2c, 3c).
Figure 1. Photomicrographs of the histological analysis of the mice liver tissues (100× & 450×).
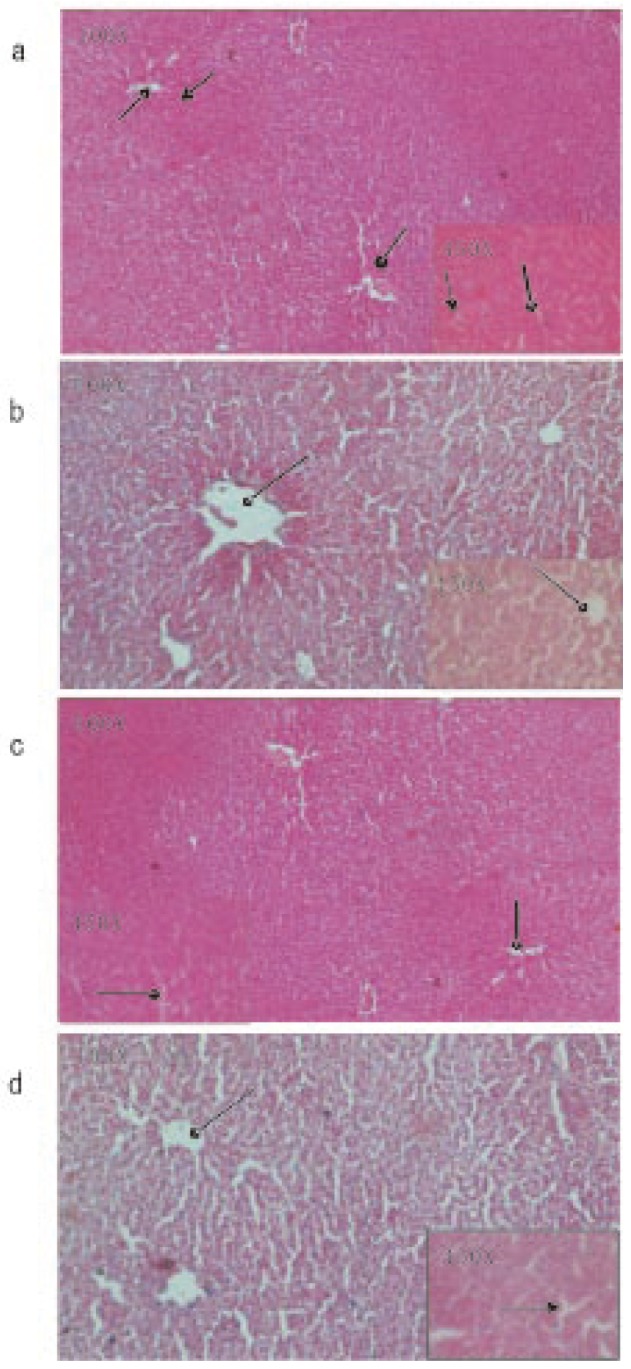
a: Control group: normal hepatic lobules ( ), central vein (
 ) and polyhedral cell (
 ); b: Nicotine-treated group (1 mg/kg bw/day): dilatation of central vein (
 ); c: CMC-EDBE-FA treated group (1 mg/kg bw/day): no dilatation of central vein (
 ); d: CMC-EDBE-FA supplemented group (1 mg/kg bw/day): repairing of dilatation of central vein (
 ).
).
Figure 2. Photomicrographs of the histological analysis of the mice kidney tissues (100× & 450×).
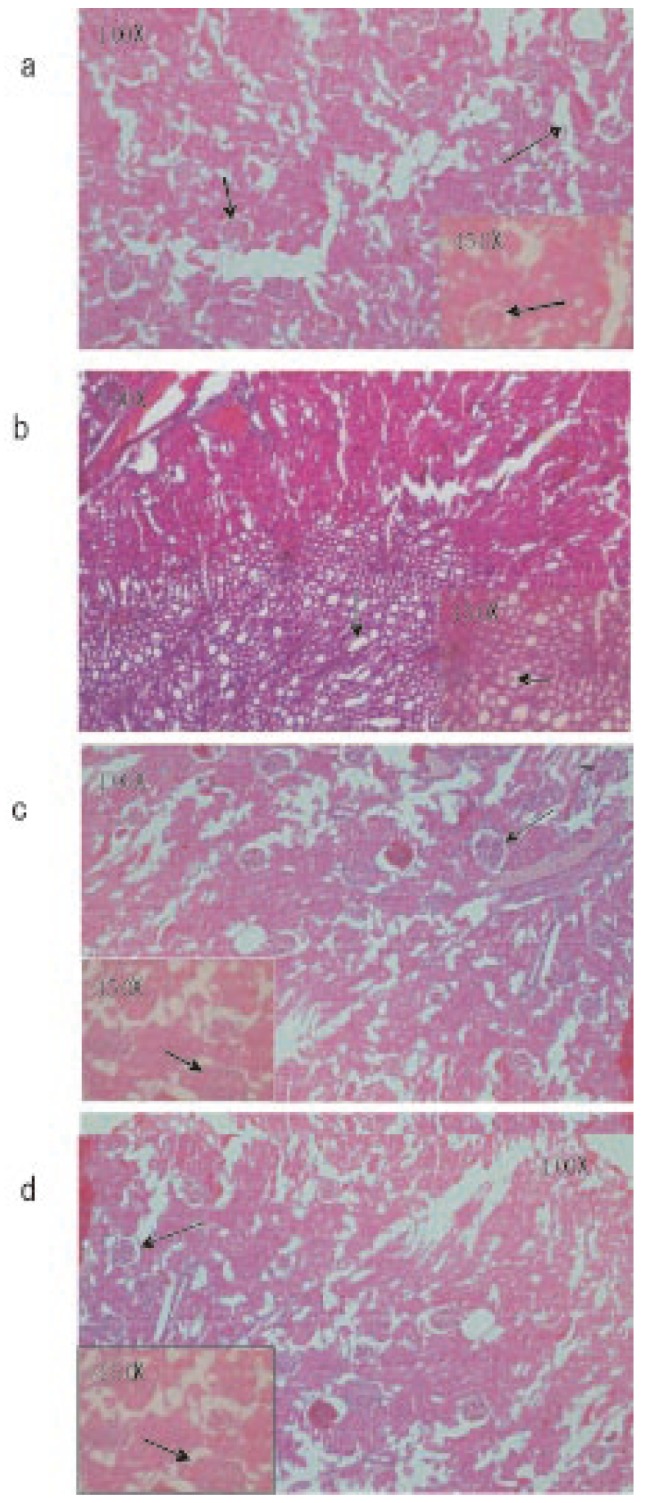
a: Control group: normal bowman's capsule ( ) and collecting tube (
 ); b: Nicotine-treated group (1 mg/kg bw/day): dilatations of the bowman's capsule (
 ); c: CMC-EDBE-FA treated group (1 mg/kg bw/day): bowman's capsule (
 ); d: CMC-EDBE-FA supplemented group (1 mg/kg bw/day): repairing of bowman's capsule (
 ).
).
Figure 3. Photomicrographs of the histological analysis of the mice spleen tissues (100× & 450×).
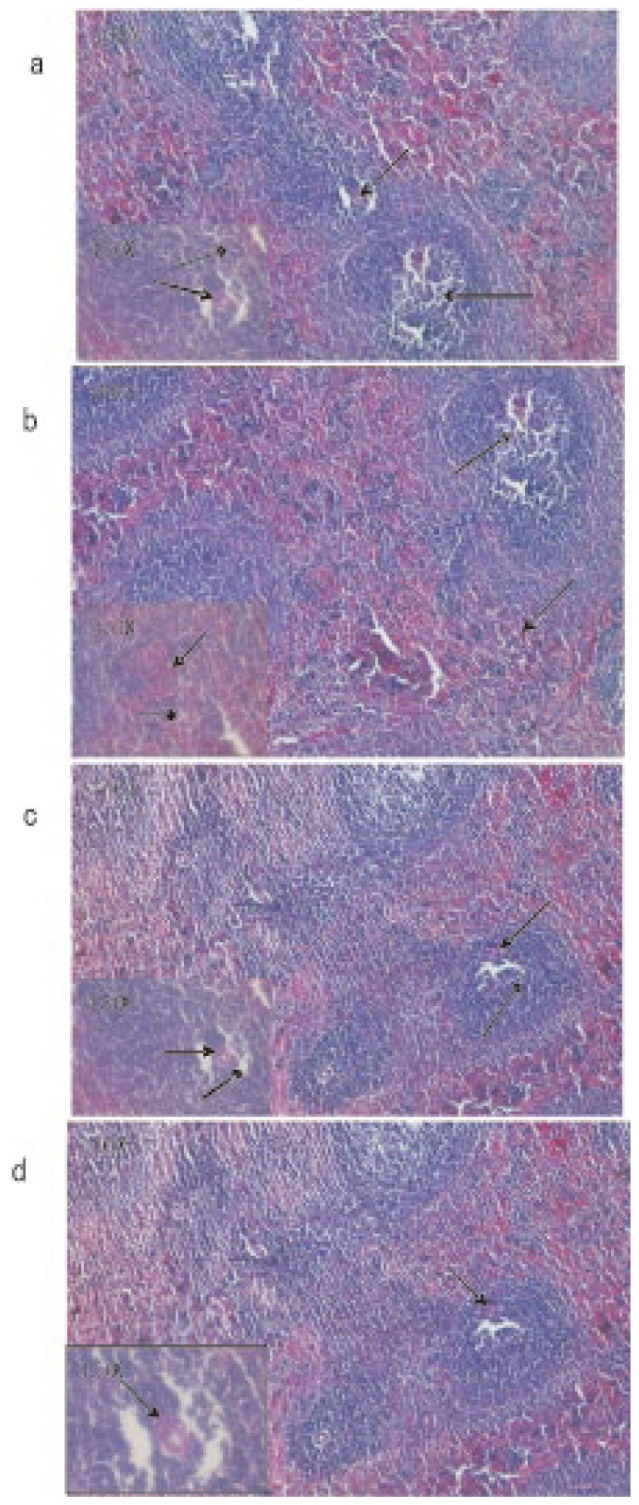
a: Control group: normal red pulp ( ) and white pulp (
 ); b: Nicotine-treated group (1 mg/kg bw/day): degeneration of red pulp (
 ) and white pulp (
 ); c: CMC-EDBE-FA treated group (1 mg/kg bw/day): red pulp (
 ) and white pulp (
 ); d: CMC-EDBE-FA supplemented group (1 mg/kg bw/day): regenerating of red pulp (
 ).
).
3.3. Lipid peroxidation level
MDA levels were significantly (P<0.05) increased in serum and mitochondria of liver, kidney and spleen by 222.89%, 303.89%, 64.67% and 301.63%, respectively, due to nicotine treatment as compared with control group. MDA levels were increased in serum and mitochondria of liver and kidney by 35.84%, 3.38% and 1.20%, respectively, and decreased in mitochondria of spleen by 12.82% due to CMC-EDBE-FA treatment as compared with control that are not significant (P<0.05). Supplementation of CMC-EDBE-FA to nicotine treated group decreased MDA levels significantly in serum and mitochondria of liver, kidney and spleen by 35.91%, 34.12%, 25.02% and 53.73%, respectively (P<0.05) (Figure 4).
Figure 4. Lipid peroxide (MDA) level in control, nicotine, CMC-EDBE-FA, nicotine + CMC-EDBE-FA treated serum and mitochondria of liver, kidney, spleen.

Values are expressed as mean±SEM, n=6. * indicates significant difference (P<0.05) compared with control group. # indicates significant difference (P<0.05) compared with nicotine treated group.
3.4. Reduced glutathione level
GSH content was significantly (P<0.05) decreased in serum and mitochondria of liver, kidney and spleen by 55.64%, 73.20%, 63.43% and 69.29%, respectively, due to nicotine administration as compared with control group. GSH content was decreased in mitochondria of liver, kidney and spleen by 0.82%, 10.03% and 1.49%, respectively, and increased in serum by 0.78% due to CMC-EDBE-FA administration as compared with control that are not significant (P<0.05). CMC-EDBE-FA supplementation to nicotine treated group increased GSH levels significantly in serum and mitochondria of liver, kidney and spleen by 93.64%, 145.00%, 60.34% and 78.69%, respectively (P<0.05) (Figure 5).
Figure 5. Reduced glutathione (GSH) level in control, nicotine, CMC-EDBE-FA, nicotine + CMC-EDBE-FA treated serum and mitochondria of liver, kidney, spleen.

Values are expressed as mean±SEM, n=6. * indicates significant difference (P<0.05) compared with control group. # indicates significant difference (P<0.05) compared with nicotine treated group
3.5. Oxidized glutathione level
GSSG level was significantly (P<0.05) increased in serum and mitochondria of liver, kidney and spleen by 235.66%, 131.43%, 140.28% and 240.80%, respectively, due to nicotine treatment as compared with control. GSSG level was increased in serum and mitochondria of liver, kidney and spleen by 25.20%, 7.43%, 5.56% and 42.18%, respectively, due to CMC-EDBE-FA treatment as compared with control that are not significant (P<0.05). Supplementation of CMC-EDBE-FA to nicotine treated mice reduced GSSG levels significantly in serum and mitochondria of liver, kidney and spleen by 43.05%, 30.97%, 45.43% and 33.47%, respectively (P<0.05) (Figure 6).
Figure 6. Oxidized glutathione (GSSG) level in control, nicotine, CMC-EDBE-FA, nicotine + CMC-EDBE-FA treated serum and mitochondria of liver, kidney, spleen.

Values are expressed as mean±SEM, n=6. * indicates significant difference (P<0.05) compared with control group. # indicates significant difference (P<0.05) compared with nicotine treated group.
3.6. Activity of superoxide dismutase
SOD activity was significantly (P<0.05) decreased in serum and mitochondria of liver, kidney and spleen by 73.24%, 89.47%, 34.50% and 87.90%, respectively, due to nicotine treatment as compared with control group. SOD activity was decreased in serum and mitochondria of liver and kidney by 3.52%, 13.77% and 13.02%, respectively, and increased in mitochondria of spleen by 2.44% due to CMC-EDBE-FA treatment as compared to control that are not significant (P<0.05). CMC-EDBE-FA supplementation to nicotine treated group increased SOD activity significantly in serum and mitochondria of liver, kidney and spleen by 157.89%, 232.59%, 15.98% and 450.17%, respectively (P<0.05) (Figure 7).
Figure 7. Superoxide dismutase (SOD) activity in control, nicotine, CMC-EDBE-FA, nicotine + CMC-EDBE-FA treated serum and mitochondria of liver, kidney, spleen.

Values are expressed as mean±SEM, n=6. * indicates significant difference (P<0.05) compared with control group. # indicates significant difference (P<0.05) compared with nicotine treated group.
3.7. Activity of catalase
CAT activity was significantly (P<0.05) decreased in serum and mitochondria of liver, kidney and spleen by 78.45%, 64.79%, 69.56% and 58.97%, respectively, due to nicotine administration as compared with control. CAT activity was decreased in mitochondria of liver by 2.45%, and increased in serum and mitochondria of kidney and spleen by 3.31%, 3.40% and 1.92%, respectively, due to CMC-EDBE-FA administration as compared with control that are not significant (P<0.05). Supplementation of CMC-EDBE-FA to nicotine treated mice increased CAT activity significantly in serum and mitochondria of liver, kidney and spleen by 183.76%, 140.86%, 57.62% and 63.08%, respectively (P<0.05) (Figure 8).
Figure 8. Catalase activity in control, nicotine, CMC-EDBE-FA, nicotine + CMC-EDBE-FA treated serum and mitochondria of liver, kidney, spleen.

Values are expressed as mean±SEM, n=6. * indicates significant difference (P<0.05) compared with control group. # indicates significant difference (P<0.05) compared with nicotine treated group.
3.8. Activity of glutathione peroxidase
GPx activity was significantly (P<0.05) decreased in serum and mitochondria of liver, kidney and spleen by 73.21%, 52.33%, 76.72% and 72.85%, respectively, due to nicotine administration as compared with control. GPx activity was decreased in serum and mitochondria of liver and spleen by 4.85%, 3.29% and 5.88%, respectively, and increased in mitochondria of kidney by 23.95% due to CMC-EDBE-FA administration as compared with control that are not significant (P<0.05). Supplementation of CMC-EDBE-FA to nicotine treated group increased GPx activity significantly in serum and mitochondria of liver, kidney and spleen by 178.45%, 67.48%, 225.51% and 133.28%, respectively (P<0.05) (Figure 9).
Figure 9. Glutathione peroxidase (GPx) activity in control, nicotine, CMC-EDBE-FA, nicotine + CMC-EDBE-FA treated serum and mitochondria of liver, kidney, spleen.

Values are expressed as mean±SEM, n=6. * indicates significant difference (P<0.05) compared with control group. # indicates significant difference (P<0.05) compared with nicotine treated group.
3.9. Activity of glutathione reductase
GR activity was significantly (P<0.05) decreased in serum and mitochondria of liver, kidney and spleen by 54.51%, 51.86%, 48.85% and 71.08%, respectively, due to nicotine administration as compared with control group. GR activity was decreased in serum and mitochondria of kidney by 4.12% and 2.89%, respectively, and increased in mitochondria of liver and spleen by 6.02% and 1.45%, respectively, due to CMC-EDBE-FA administration as compared to control that are not significant (P<0.05). CMC-EDBE-FA supplementation to nicotine treated mice increased GR activity significantly in serum and mitochondria of liver, kidney and spleen by 66.57%, 64.9%, 23.85% and 188.16%, respectively (P<0.05) (Figure 10).
Figure 10. Glutathione reductase (GR) activity in control, nicotine, CMC-EDBE-FA, nicotine + CMC-EDBE-FA treated serum and mitochondria of liver, kidney, spleen.

Values are expressed as mean±SEM, n=6. * indicates significant difference (P<0.05) compared with control group. # indicates significant difference (P<0.05) compared with nicotine treated group.
3.10. Activity of glutathione-s-transferase
GST activity was significantly (P<0.05) decreased in serum and mitochondria of liver, kidney and spleen by 70.99%, 62.13%, 79.56% and 53.01%, respectively, due to nicotine administration as compared with control. GR activity was decreased in serum and mitochondria of liver by 4.12% and 4.88%, respectively, and increased in mitochondria of kidney and spleen by 1.74% and 5.49%, respectively, due to CMC-EDBE-FA administration as compared to control that are not significant (P<0.05). CMC-EDBE-FA supplementation of to nicotine treated mice increased GST activity significantly in serum and mitochondria of liver, kidney and spleen by 96.97%, 102.73%, 160.3% and 71.4%, respectively (P<0.05) (Figure 11).
Figure 11. Glutathione-s-transferase (GST) activity in control, nicotine, CMC-EDBE-FA, nicotine + CMC-EDBE-FA treated serum and mitochondria of liver, kidney, spleen.

Values are expressed as mean±SEM, n=6. * indicates significant difference (P<0.05) compared with control group. # indicates significant difference (P<0.05) compared with nicotine treated group.
3.11. DNA fragmentation
DNA fragmentation was significantly (P<0.05) increased in mitochondria of liver, kidney and spleen by 352.05%, 306.13% and 386.66%, respectively, due to nicotine administration as compared with control. DNA fragmentation was increased in mitochondria of liver, kidney and spleen by 12.33%, 6.08% and 6.04%, respectively, due to CMC-EDBE-FA administration as compared to control that are not significant (P<0.05). Supplementation of CMC-EDBE-FA to nicotine treated mice decreased DNA fragmentation significantly in mitochondria of liver, kidney and spleen by 56.96%, 65.02% and 61.99% respectively (P<0.05) (Figure 12).
Figure 12. DNA fragmentation in control, nicotine, CMC-EDBE-FA, nicotine + CMC-EDBE-FA treated mitochondria of liver, kidney and spleen.

Values are expressed as mean±SEM, n=6. * indicates significant difference (P<0.05) compared with control group. # indicates significant difference (P<0.05) compared with nicotine treated group.
4. Discussion
Nicotine, a pharmacologically active ingredient in smoke and smokeless tobacco, is generally regarded as a primary risk factor in the development of cardiovascular disorders, myocardial infraction, stroke, kidney cancer, pulmonary diseases and different immunological dysfunction[28]. This highly addictive alkaloid has been reported to induce oxidative stress both in vivo and in vitro[12],[14]. The mechanism of free radical generation by nicotine is not clear. However, it has been reported that nicotine disrupts the mitochondrial respiratory chain leading to an increase generation of superoxide anions and hydrogen peroxide[29]. Previous studies have suggested that, superoxide anion and hydrogen peroxide are the main source of nicotine induced free radical generation and depletion of cellular antioxidants[30],[31].
CMC-EDBE-FA nanoparticle were prepared by the carboxylic group (-COOH) of folic acid and -COOH group of functionalized carboxymethyl chitosan connected through the end-amino groups hydrophilic spacer, 2,2′-(ethylenedioxy)-bis-ethylamine. It is well known that carboxymethyl chitosan is easily soluble in water but folic acid has very less solubility in water. When carboxymethyl chitosan is connected by folic acid through a spacer, carboxymethyl chitosan may act as a hydrophilic part and folic acid as a hydrophobic part.
The results of the present study demonstrated that, in vivo nicotine treatment for 7 days causes tissue damage and alteration of oxidant-antioxidant status in serum, and mitochondria of liver, kidney and spleen, as evidenced by enhanced MDA and GSSG level, decreased GSH level and also SOD, CAT, GPx, GR and GST activity. Moreover, DNA damage assessed by DPA assay, due to nicotine treatment was also observed. But in vivo treatment of CMC-EDBE-FA for 7 days did not cause any kind of tissue damage, alteration of oxidant-antioxidant status and DNA damage of experimental group.
Nicotine metabolism occurs extensively in the liver, catalysed by cytochrome P450 enzymes and produced free radicals. These free radicals are known to cause lipid peroxidation. Lipid peroxidation is known to disturb the integrity of cellular membrane, and thus causes cellular injury[32]. In the present study, hepatic damage, dilatations of Bowman's capsule with severe vasocongestion and edema in the parenchyma of kidney, degeneration of red pulp and white pulp of spleen were observed that may be due to nicotine-induced excess free radicals generation. Any type of damage in liver, kidney and spleen of CMC-EDBE-FA treated group was not found. Supplementation of CMC-EDBE-FA to nicotine treated group could repair the tissue damage of liver, kidney and spleen.
In this study, significant elevation of malondialdehyde (MDA) level was observed in serum and mitochondria of liver, kidney and spleen of nicotine treated mice; whereas MDA levels were increased in serum and mitochondria of liver and kidney, and decreased in mitochondria of spleen of CMC-EDBE-FA treated group. Supplementation of CMC-EDBE-FA to nicotine treated mice decreased MDA level significantly in serum and mitochondria of liver, kidney and spleen. Lipid peroxidation is known to disturb the integrity of cellular membranes, leading to the leakage of cytoplasmic enzymes[33]. Enhanced lipid peroxidation is associated with antioxidant depletion in different tissues, and may yield a range of toxic aldehydes that are capable of damaging membrane proteins[34],[35]. Recent report by our laboratory suggested that, increased lipid peroxidation and decreased antioxidant enzyme status can be an indicator of disease progression of oral cavity cancer patients[36].
Glutathione, an important cellular reductant, is involved in protection against free radicals, peroxides, and toxic compounds in cellular systems[37]. In the present study, the GSH level was decreased in serum and liver, kidney and spleen mitochondria of nicotine treated mice. CMC-EDBE-FA supplementation to nicotine treated mice increased GSH level significantly in serum and mitochondria of liver, kidney and spleen compared with control. In this study, it was observed that GSSG level was increased in serum and liver, kidney and spleen mitochondria of nicotine treated group and CMC-EDBE-FA treated group. But GSSG level was decreased significantly in nicotine treated mice after supplementation of CMC-EDBE-FA. The decreased GSH levels represent its increased utilization due to nicotine administration. On the other hand, decreased GSH level may be due to increasing level of lipid oxidation products which may be associated with less availability of NADPH required for the activity of glutathione reductase (GR) to transform GSSG to GSH due to the increasing production of ROS[38]. In our present study, the increasing levels of GSSG and decreasing GR activity due to nicotine toxicity may support the explanation.
Antioxidant enzymes are considered to be a primary defense that prevents biological macromolecules from oxidative damage. SOD rapidly dismutates superoxide anion (O2−) to less dangerous H2O2, which is further degraded by CAT and GPx to water and oxygen[31]. The results of the present study showed a significant fall in SOD and CAT activities in serum and liver, kidney and spleen mitochondria of nicotine treated group. SOD activity was decreased in serum and mitochondria of liver and kidney, and increased in mitochondria of spleen in CMC-EDBE-FA treated group. CAT activity was decreased in mitochondria of liver, and increased in serum and mitochondria of kidney and spleen in CMC-EDBE-FA treated group. Supplementation of CMC-EDBE-FA to nicotine treated mice increased SOD and CAT activity significantly in serum and mitochondria of liver, kidney and spleen. SOD, dismutate O2− and the same in turn is a potent inhibitor of CAT[39]. The depletion in SOD activity was may be due to dispose off the free radicals, produced due to nicotine toxicity. Beside this, on nicotine administration, H2O2 produced by dismutation of superoxide anion, may have been efficiently converted to O2 by CAT and the enzyme activities showed a marked reduction. The depletion of antioxidant enzyme activity was may be due to inactivation of the enzyme proteins by nicotine-induced ROS generation, depletion of the enzyme substrates, and/or down-regulation of transcription and translation processes.
GPx works non-specifically to scavenge and decompose excess hydroperoxides including H2O2, which may be prevalent under oxidative stress[40],[41]. Glutathione-S-transferase (GST) mainly detoxifies electrophilic compounds and has a well-established role in protecting cells from mutagens and carcinogens as a free radical scavenger along with glutathione[42]. In the present study, the significant decreasing of GSH level and GSH-dependent enzymes, i.e. GPX, GR, and GST in serum and mitochondria of liver, kidney and spleen on in vivo treatment of nicotine may be due to increased utilization to scavenge the free radical generation. GPx activity was decreased in serum and mitochondria of liver and spleen, and increased in mitochondria of kidney in CMC-EDBE-FA treated group. GR activity was decreased in serum and mitochondria of kidney, and increased in mitochondria of liver and spleen in CMC-EDBE-FA treated group. GR activity was decreased in serum and mitochondria of liver, and increased in mitochondria of kidney and spleen in CMC-EDBE-FA treated group. CMC-EDBE-FA supplementation to nicotine treated mice increased GPx, GR and GST activity significantly in serum and mitochondria of liver, kidney and spleen.
In the present study, it was observed that MDA level and DNA fragmentation were significantly elevated in liver, kidney and spleen mitochondria due to nicotine toxicity. This elevated MDA level decreases GSH level and SOD activity, which may be associated with DNA fragmentation in liver, kidney and spleen mitochondria. DNA fragmentation was slightly increased in mitochondria of liver, kidney and spleen of CMC-EDBE-FA treated group; but supplementation of CMC-EDBE-FA to nicotine treated group decreased DNA fragmentation significantly in mitochondria of liver, kidney and spleen. Diminution of GSH depending enzyme in nicotine treated group may be due to the generation of free radicals by nicotine.
In summary, our present data with both biochemical and histological study clearly demonstrate that 1 mg/kg bw/day nicotine treatment for 7 days causes tissue damage, decreases the activities of antioxidant enzymes, decreases reduced glutathione level, increases lipid peroxidation, increases oxidized glutathione level and induces DNA damage; whereas 1 mg/kg bw/day CMC-EDBE-FA treatment for 7 days has no such effect; rather than supplementation of CMC-EDBE-FA to nicotine treated mice recovers tissue damage, increases antioxidant enzymes activity and reduced glutathione level, decreases lipid peroxidation, oxidized glutathione level and DNA fragmentation. So, it can be concluded that, CMC-EDBE-FA nanoparticle is non toxic and may be a potential for prophylaxis of nicotine-induced chronic diseases.
Acknowledgments
The authors express gratefulness to the Department of Biotechnology, Government of India for funding. The authors also express gratefulness Indian Institute of Technology, Kharagpur and Vidyasagar University, Midnapore for providing the facilities to execute these studies.
Footnotes
Conflict of interest statement: We declare that we have no conflict of interest.
References
- 1.Khor E, Lim LY. Implantable applications of chitin and chitosan. Biomaterials. 2003;24:2339–2349. doi: 10.1016/s0142-9612(03)00026-7. [DOI] [PubMed] [Google Scholar]
- 2.Dornish M, Kaplan D, Skaugrud O. Standards and guidelines for biopolymers in tissue-engineered medical products. Ann N Y Acad Sci. 2001;944:388–397. doi: 10.1111/j.1749-6632.2001.tb03850.x. [DOI] [PubMed] [Google Scholar]
- 3.Koide SS. Chitin-chitosan: properties, benefits and risks. Nutr Res. 1998;18:1091–1101. [Google Scholar]
- 4.White SA, Farina PR, Fulton I. Production and isolation of chitosan from Mucor rouxii. Appl Environ Microbiol. 1979;38:323–328. doi: 10.1128/aem.38.2.323-328.1979. [DOI] [PMC free article] [PubMed] [Google Scholar]
- 5.Liu XF, Guan YL, Yang DZ, Li Z, Yao KD. Antibacterial action of chitosan and carboxymethylated chitosan. J Appl Polym Sci. 2001;79(7):1324–1335. [Google Scholar]
- 6.Lu G, Kong L, Sheng B, Wang G, Gong Y, Zhang X. Degradation of covalently cross-linked arboxymethyl chitosan and its potential application for peripheral nerve regeneration. Eur Polym J. 2007;43:3807–3818. [Google Scholar]
- 7.Jayakumar R, Prabaharan M, Reis RL, Mano JF. Graft copolymerized chitosan-present status and applications. Carbohydr Polym. 2005;62:142–158. [Google Scholar]
- 8.Prabaharan M, Mano JF. A novel pH and thermo-sensitive N, O-carboxymethyl chitosan-graft-poly (N-isopropylacrylamide) hydrogel for controlled drug delivery. E-Polymers. 2007;43:1–14. [Google Scholar]
- 9.An XN, Su ZX, Zeng HM. Preparation of highly magnetic chitosan particles and their use for affinity purification of enzymes. J Chem Technol Biotechnol. 2003;78(5):596–600. [Google Scholar]
- 10.Turan K, Nagata K. Chitosan-DNA nanoparticles: the effect of cell type and hydrolysis of chitosan on in vitro DNA transfection. Dev Technol. 2006;11:503–12. doi: 10.1080/10837450600940873. [DOI] [PubMed] [Google Scholar]
- 11.Chakraborty SP, Sahu SK, Kar Mahapatra S, Santra S, Bal M, Roy S, et al. et al. Nanoconjugated vancomycin: new opportunities for the development of anti-VRSA agents. Nanotechnology. 2010;21:105103. doi: 10.1088/0957-4484/21/10/105103. [DOI] [PubMed] [Google Scholar]
- 12.Neogy S, Das S, Kar Mahapatra S, Mandal N, Roy S. Amelioratory effect of Andrographis paniculata Nees on liver, kidney, heart, lung and spleen during nicotine induced oxidative stress. Environ Toxicol Pharmacol. 2008;25:321–328. doi: 10.1016/j.etap.2007.10.034. [DOI] [PubMed] [Google Scholar]
- 13.Das S, Neogy S, Gautam N, Roy S. In vitro nicotine induced superoxide mediated DNA fragmentation in lymphocytes: protective role of Andrographis paniculata Nees. Toxicol In Vitro. 2009;23:90–98. doi: 10.1016/j.tiv.2008.10.012. [DOI] [PubMed] [Google Scholar]
- 14.Kar Mahapatra S, Das S, Bhattacharjee S, Gautam N, Majumdar S, Roy S. In vitro nicotine-induced oxidative stress in mice peritoneal macrophages: a dose-dependent approach. Toxicol Mecha Methods. 2009;19:100–108. doi: 10.1080/15376510802255184. [DOI] [PubMed] [Google Scholar]
- 15.Chandran K, Venugopal PM. Modulatory effects of curcumin on lipid peroxidation and antioxidant status during nicotine induced toxicity. Pol J Pharmacol. 2004;56:581–586. [PubMed] [Google Scholar]
- 16.Aprille JR, Austin J. Regulation the mitochondrial adenine nucleotide pool size. Arch Biochem Biophys. 1981;212:689–699. doi: 10.1016/0003-9861(81)90413-6. [DOI] [PubMed] [Google Scholar]
- 17.Iranloye BO, Bolarinwa AF. Effect of nicotine administration on weight and histology of some vital visceral organs in female albino rats. Niger J Physiol Sci. 2009;24(1):7–12. doi: 10.4314/njps.v24i1.46374. [DOI] [PubMed] [Google Scholar]
- 18.Ohkawa H, Ohishi N, Yagi K. Assay for lipid peroxides in animal tissues by thiobarbituric acid reaction. Anal Biochem. 1979;95:351–358. doi: 10.1016/0003-2697(79)90738-3. [DOI] [PubMed] [Google Scholar]
- 19.Moron MS, Kepierre JW, Mannervick B. Levels of glutathione reductase and glutathione-S-transferase activities in rat lung and liver. Biochim Biophys Acta. 1979;582:67–68. doi: 10.1016/0304-4165(79)90289-7. [DOI] [PubMed] [Google Scholar]
- 20.Griffith OW. Determination of glutathione and glutathione sulfide using glutathione reductase and 2-Vinyl pyridine. Anal Biochem. 1980;106:207–212. doi: 10.1016/0003-2697(80)90139-6. [DOI] [PubMed] [Google Scholar]
- 21.Mestro Del RF, McDonald W. Oxidative enzymes in tissue homogenates. In: Greenwald RA, editor. CRC handbook of methods for oxygen radical research. Boca Raton FL: CRC Press; 1986. pp. 291–296. [Google Scholar]
- 22.Luck H. Catalase. In: Bergmeyer HW, editor. Methods of enzymatic analysis, section 3. New York: Academic Press; 1963. pp. 885–894. [Google Scholar]
- 23.Paglia DE, Valentine WN. Studies on the quantitative and qualitative characterization of erythrocyte glutathione peroxidase. J Lab Clin Med. 1967;70:158–69. [PubMed] [Google Scholar]
- 24.Miwa S. Hematology. Mod Med Technol. 1972;3:306–310. [Google Scholar]
- 25.Habig WH, Pabst MJ, Jakoby WB. Glutathione-S-transferases. The first enzymatic step in mercapyuric acid formation. J Biol Chem. 1974;249:7130–7139. [PubMed] [Google Scholar]
- 26.Paradones CE, Illera VA, Peckham D, Stunz LL, Ashman RF. Regulation of apoptosis in vitro in mature spleen T cell. J Immunol. 1993;151:3521–3529. [PubMed] [Google Scholar]
- 27.Lowry OH, Rosenbrough NJ, Farr AL, Randall RJ. Protein measurement with the Folin phenol reagent. J Biol Chem. 1951;193:265–275. [PubMed] [Google Scholar]
- 28.Jung BH, Chung S, Shim C. Different pharmokinetics of nicotine following intravenous administration of nicotine base and nicotine hydrogen tartrate in rats. J Control Rel. 2001;77:183–190. doi: 10.1016/s0168-3659(01)00452-7. [DOI] [PubMed] [Google Scholar]
- 29.Yildiz D, Ercal N, Armstrong DW. Nicotine enantiomers and oxidative stress. Toxicology. 1998;130:155–165. doi: 10.1016/s0300-483x(98)00105-x. [DOI] [PubMed] [Google Scholar]
- 30.Kar Mahapatra S, Chakraborty SP, Majumdar S, Bag BG, Roy S. Eugenol protects nicotine-induced superoxide mediated oxidative damage in murine peritoneal macrophages in vitro. Eur J Pharmacol. 2009;623:132–140. doi: 10.1016/j.ejphar.2009.09.019. [DOI] [PubMed] [Google Scholar]
- 31.Wetscher GJ, Bagchi M, Bagchi D, Perdikis G, Hinder PR, Glaser K, et al. et al. Free radical production in nicotine treated pancreatic tissue. Free Radic Biol Med. 1995;18:877–882. doi: 10.1016/0891-5849(94)00221-5. [DOI] [PubMed] [Google Scholar]
- 32.Oscarson M. Genetic polymorphisms in the cytochrome P4502A6 (CYP2A6) gene: implications for inter individual differences in nicotine metabolism. Drug Metab Dispos. 2001;29:91–95. [PubMed] [Google Scholar]
- 33.Bagchi M, Bagchi D, Adickes E, Stohs SJ. Chronic effects of smokeless tobacco extract on rat liver histopathology and protection of HSP-90. J Environ Pathol Toxicol Oncol. 1995;14(2):61–68. [PubMed] [Google Scholar]
- 34.Husain K, Scott BR, Reddy SK, Somani SM. Chronic ethanol and nicotine interaction on rat tissue antioxidant defense system. Alcohol. 2001;25:89–97. doi: 10.1016/s0741-8329(01)00176-8. [DOI] [PubMed] [Google Scholar]
- 35.Hedley D, Chows S. Flowcytometric measurement of lipid peroxidation in vital cells using parinaric acid. Cytometry. 1992;13:686–692. doi: 10.1002/cyto.990130704. [DOI] [PubMed] [Google Scholar]
- 36.Das S, Kar Mahapatra S, Gautam N, Das A, Roy S. Oxidative stress in lymphocytes, neutrophils and serum of oral cavity cancer patients: modulatory array of L-glutamine. Support Care Cancer. 2007;15:1399–1405. doi: 10.1007/s00520-007-0266-3. [DOI] [PubMed] [Google Scholar]
- 37.Gerster H. β-Carotene, vitamin E and vitamin C in different stages of experimental carcinogenesis. Eur J Clin Nutr. 1995;49:155–168. [PubMed] [Google Scholar]
- 38.Sarkar S, Yadav P, Trivedi R, Bansal AK, Bhatnagar D. Cadmium-induced lipid peroxidation and the status of the antioxidant system in rat tissues. J Elem Med. 1995;9:144–147. doi: 10.1016/S0946-672X(11)80038-6. [DOI] [PubMed] [Google Scholar]
- 39.Ashakumari L, Vijayammal PL. Addictive effect of alcohol and nicotine on lipid peroxidation and antioxidant defense mechanism in rats. J Appl Toxicol. 1996;16:305–308. doi: 10.1002/(SICI)1099-1263(199607)16:4<305::AID-JAT353>3.0.CO;2-F. [DOI] [PubMed] [Google Scholar]
- 40.Chen LH, Xi S, Cohen DA. Liver antioxidant defense in mice fed ethanol and the AIN-76A diet. Alcohol. 1995;12:453–457. doi: 10.1016/0741-8329(95)00030-u. [DOI] [PubMed] [Google Scholar]
- 41.Somani SM. Exercise, drugs and tissue specific antioxidant system. In: Somani SM, editor. Pharmacology in exercise and sports. Boca Raton: CRC Press; 1996. pp. 57–95. [Google Scholar]
- 42.Hemachand T, Gopalakrishnan B, Salunke DM, Totey SM, Shaha C. Sperm plasmamembrane-associated glutathione S-transferases as gamete recognition molecules. J Cell Sci. 2002;115:2053–2065. doi: 10.1242/jcs.115.10.2053. [DOI] [PubMed] [Google Scholar]