Abstract
OBJECTIVE
To examine the utility of commonly used insulin sensitivity indices in nondiabetic European Americans (EAs) and African Americans (AAs).
RESEARCH DESIGN AND METHODS
Two-hundred forty nondiabetic participants were studied. Euglycemic-hyperinsulinemic clamp was the gold standard approach to assess glucose disposal rates (GDR) normalized by lean body mass. The homeostatic model assessment for insulin resistance (HOMA-IR) and the quantitative insulin sensitivity check index (QUICKI) were calculated from fasting plasma glucose and insulin (FIL). Oral glucose tolerance test (OGTT) was performed to determine Matsuda index, the simple index assessing insulin sensitivity (SIisOGTT), Avignon index, and Stomvoll index. Relationships among these indices with GDR were analyzed by multiple regression.
RESULTS
GDR values were similar in EA and AA subgroups; even so, AA exhibited higher FIL and were insulin-resistant compared with EA, as assessed by HOMA-IR, QUICKI, Matsuda index, SIisOGTT, Avignon index, and Stumvoll index. In the overall study population, GDR was significantly correlated with all studied insulin sensitivity indices (/r/ = 0.381–0.513); however, these indices were not superior to FIL in predicting GDR. Race and gender affected the strength of this relationship. In AA males, FIL and HOMA-IR were not correlated with GDR. In contrast, Matsuda index and SIisOGTT were significantly correlated with GDR in AA males, and Matsuda index was superior to HOMA-IR and QUICKI in AAs overall.
CONCLUSIONS
Insulin sensitivity indices based on glucose and insulin levels should be used cautiously as measures of peripheral insulin sensitivity when comparing mixed gender and mixed race populations. Matsuda index and SIisOGTT are reliable in studies that include AA males.
Insulin resistance is central to pathogenesis of cardiometabolic disease and confers increased risk of type 2 diabetes and cardiovascular disease (1). The gold standard approach for measuring insulin resistance is euglycemic-hyperinsulinemic clamp (2); however, it is rarely used in clinical practice and in epidemiological studies because it is laborious and requires intravenous infusions. Several surrogate indices using glucose and insulin levels have been devised as alternative measures of insulin sensitivity and are commonly used in cohort studies, including fasting insulin level (FIL), homeostasis model assessment of insulin resistance (HOMA-IR), quantitative insulin sensitivity check index (QUICKI), Matsuda index, Avignon index, Stumvoll index, and the new simple index assessing insulin sensitivity using oral glucose tolerance test (SIisOGTT). FIL is a simple and practical surrogate marker for insulin resistance (3) when elevated in the presence of normoglycemia or hyperglycemia; however, insulin assay has not been standardized for more universal applications. HOMA-IR (4) and QUICKI (5) are models that incorporate both fasting insulin and glucose levels, although QUICKI uses a log-transformation that is reported to provide a stronger linear correlation with the clamp (5). Matsuda index (6) and SIisOGTT (7) are models that use dynamic glucose and insulin values obtained during oral glucose tolerance tests (OGTT). Avignon index (8) and Stumvoll index (9) also are derived from OGTT with incorporation of glucose’s volume of distribution or BMI in their equations. These indices are potentially of high value because they are facile and inexpensive in comparison with euglycemic-hyperinsulinemic clamp. Furthermore, it is difficult to clinically identify insulin resistance because individual variability in insulin sensitivity exists largely independent of obesity in populations (10). Clinical constructs such as metabolic syndrome and prediabetes are used to assess risk for future diabetes and cardiometabolic disease; however, insulin sensitivity indices potentially could be used to more optimally identify insulin resistance in individuals as a central pathophysiological process responsible for cardiometabolic disease.
Given the widespread use of insulin sensitivity indices in epidemiology and clinical trials, it is important to assess their predictive value for insulin resistance. Several studies have assessed correlations between various indices and clamp measures of insulin resistance (11–17); however, these studies are often lacking in three aspects. First, the correlations often include nondiabetic subjects together with type 2 diabetic patients. Type 2 diabetes is a disease state with distortions in the relationship between circulating glucose and insulin values in a manner that does not reflect systemic insulin sensitivity. Hyperglycemia is the hallmark of type 2 diabetes and is accompanied by “glucose toxicity” with respect to insulin secretion. Consequently, studies assessing the relationship between indices based on fasting glucose and insulin levels and clamp measures could reflect falsely inflated slopes and correlation coefficients in regression equations when data from nondiabetic and diabetic subjects are included in the same regression analyses. Hence, rigorous analyses confined to nondiabetic subjects are needed to evaluate true value of insulin sensitivity indices. Second, even among nondiabetic subjects, there are factors influencing insulin secretion and circulating insulin concentrations independent of insulin sensitivity. Studies have shown that insulin secretory responses primarily can be impaired, independent of insulin resistance, and this trait is an independent risk factor for future diabetes (18). African Americans (AAs) are known to have hypersecretion of insulin independent of systemic insulin sensitivity (19–25), and this could alter glucose-to-insulin ratios in a manner that distorts ability to use insulin sensitivity indices in studies involving multiple racial groups. Thus, careful analyses across racial and ethnic groups are warranted. Finally, few studies have addressed the relative values of multiple insulin sensitivity indices in the same population, with attention to the potential impact of race.
Our study attempted to address these shortcomings in the literature. We performed euglycemic-hyperinsulinemic glucose clamp in a substantial number of nondiabetic European American (EA) and AA subjects and compared the predictive value of FIL, HOMA-IR, log HOMA-IR, QUICKI, Matsuda index, SIisOGTT, Avignon index, and Stumvoll index as indices of peripheral insulin resistance.
RESEARCH DESIGN AND METHODS
Study subjects
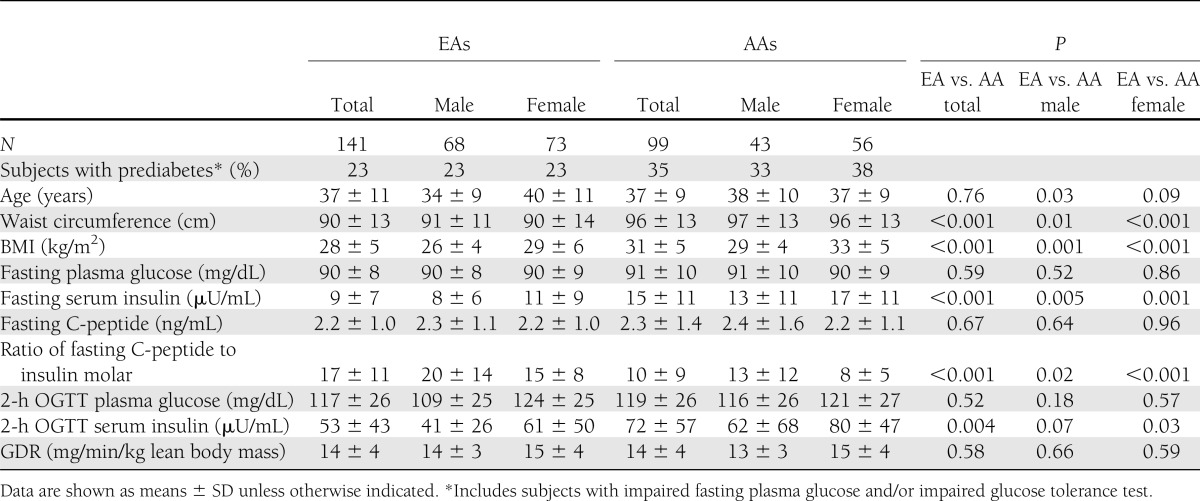
Study subjects included 240 nondiabetic participants: 141 EAs and 99 AAs. Baseline characteristics are shown in Table 1. None of volunteers had cardiovascular, renal, or hepatic disease, and all were chemically euthyroid. Pregnant women were excluded and premenopausal females were studied between days 4 and 11 of the menstrual cycle by history. Race was determined by self-report. Informed consent was obtained from every participant, and the protocol was approved by University of Alabama at Birmingham Institutional Review Board.
Table 1.
Descriptive characteristics of study subjects
Protocol
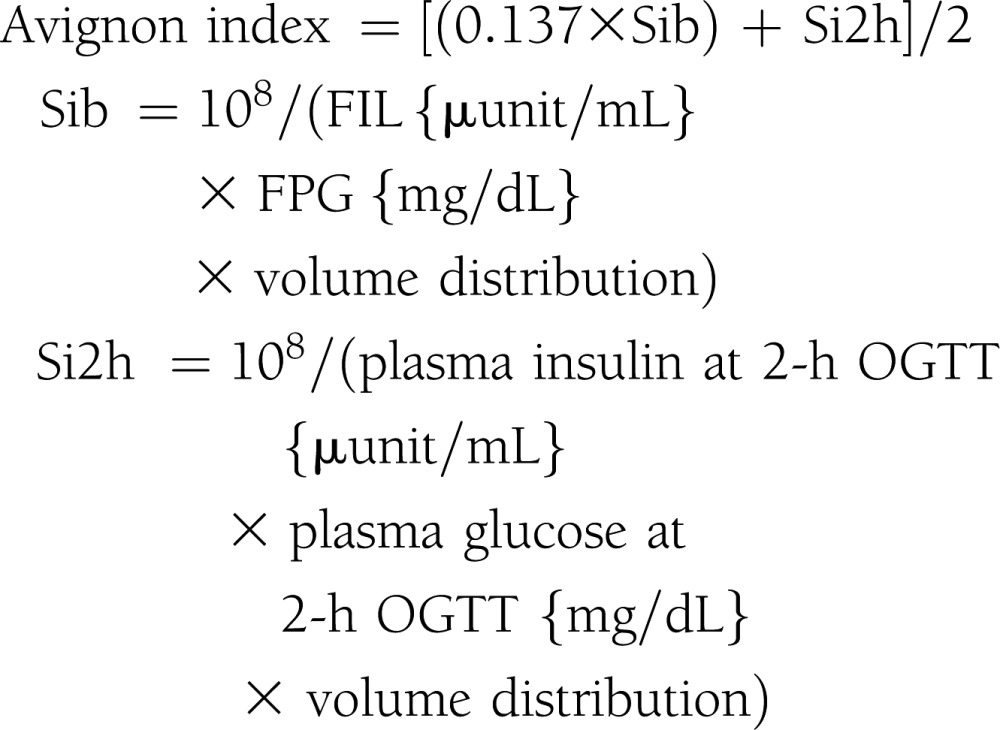
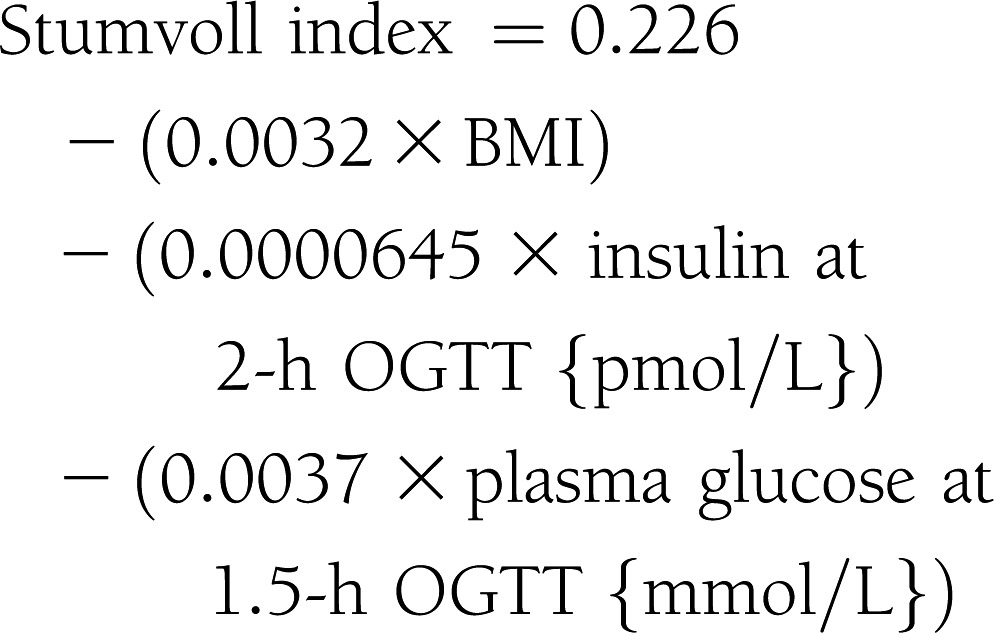
Subjects were admitted to the Clinical Research Unit at the University of Alabama at Birmingham, where they received eucaloric diet consisting of 20% protein, 30% fat, and 50% carbohydrate of total calories during a 3-day stay. All procedures were conducted in the morning after a 10-h fast. Participants received standard 75-g OGTT. Plasma glucose and insulin levels were obtained at 0, 30, 60, 90, 120, and 180 min. Insulin sensitivity indices were calculated by the following equations (4–9):
 |
 |
 |
 |
 |
 |
 |
Lean body mass was determined by dual-energy X-ray absorptiometry with DPX-L version 1.33 (Lunar Radiation, Madison, WI).
Assays
Plasma glucose was measured by glucose oxidase method using a glucose analyzer (YSI 2300; Yellow Springs Instruments, Yellow Springs, OH). Serum insulin levels were measured using an electrochemiluminescence immunoassay (Roche Diagnostics, Mannheim, Germany).
Clamps
Hyperinsulinemic-euglycemic clamps were performed at a maximally effective insulin concentration as described (26). In brief, a catheter was inserted into brachial vein to infuse insulin, glucose, and potassium phosphate. Insulin was administered at a rate of 200 mU/m2/min for 4 h, and this provided steady-state serum insulin levels that were maximally effective for promoting glucose uptake largely into skeletal muscle and that achieved full suppression of hepatic glucose output (27). The mean of clamp-induced steady insulin level in EAs and AAs was 579 (SD, 183) and 645 (SD, 178) µU/mL (P = not significant), respectively. A potassium phosphate solution was simultaneously infused to prevent hypokalemia. A variable-rate infusion of a 20% dextrose solution was used to maintain plasma glucose level. Plasma glucose was clamped at 90 mg/dL for at least 3 h. Plasma glucose levels were evaluated every 5 min and plasma insulin was measured every 30 min throughout the clamp. Maximal glucose uptake for each individual was calculated from mean glucose infusion rate over the final three 20-min intervals. Whole-body glucose uptake was calculated based on glucose infusion rate corrected for changes in the glucose pool size, assuming a distribution volume of 19% body weight and a pool fraction of 0.65. Glucose disposal rate (GDR) was normalized per kilogram of lean body mass, excluding bone mass determined by dual-energy X-ray absorptiometry.
Statistical analysis
Mean differences in patient characteristics were assessed by ANOVA. ANCOVA was used to detect mean differences in GDR and insulin sensitivity indices (FIL, HOMA-IR, log HOMA-IR, QUICKI, Matsuda index, SIisOGTT, Avignon index, and Stumvoll index), independent of BMI. BMI was rather higher in AA than in EA; therefore, BMI-adjusted correlations between GDR and insulin sensitivity indices were calculated for all patients and for groups stratified by race and gender. A Steiger t test was used to compare correlation coefficients among surrogate indices. Best-fit analyses of the data correlating all indices with clamp measures of insulin sensitivity across gender and racial groups were performed. Coefficient of determination to indicate predictability of each insulin sensitivity index was determined by multiple regression analysis that the model included; surrogate indices of insulin sensitivity, BMI, race, gender, and interaction between insulin sensitivity indices and race were used as independent variables and hyperglycemic-euglycemic clamp measure was used as the dependent variable. P < 0.05 was considered significant. Statistical analyses were performed using the SAS program version 9.2 (SAS Institute, Cary, NC).
RESULTS
The analyses included 141 EAs (68 males and 73 females) and 99 AAs (43 males and 56 females). Hyperinsulinemic clamp measurements as well as HOMA-IR and QUICKI results were available in all 240 subjects, although Matsuda index, SIisOGTT, Avignon index, and Stumvoll index were assessed only in 198 participants (119 EAs and 79 AAs) who were administered the OGTT. Descriptive characteristics of study participants stratified by race and gender are shown in Table 1. Mean age was similar in EAs and AAs, although BMI and waist circumference were somewhat higher in AAs than in EAs. Fasting glucose values were similar in all subgroups; however, FIL tended to be higher in females than in males and was elevated in AAs in comparison with their EA counterparts. Importantly, EAs and AAs were equally insulin-sensitive, with similar mean GDR values (P = not significant).
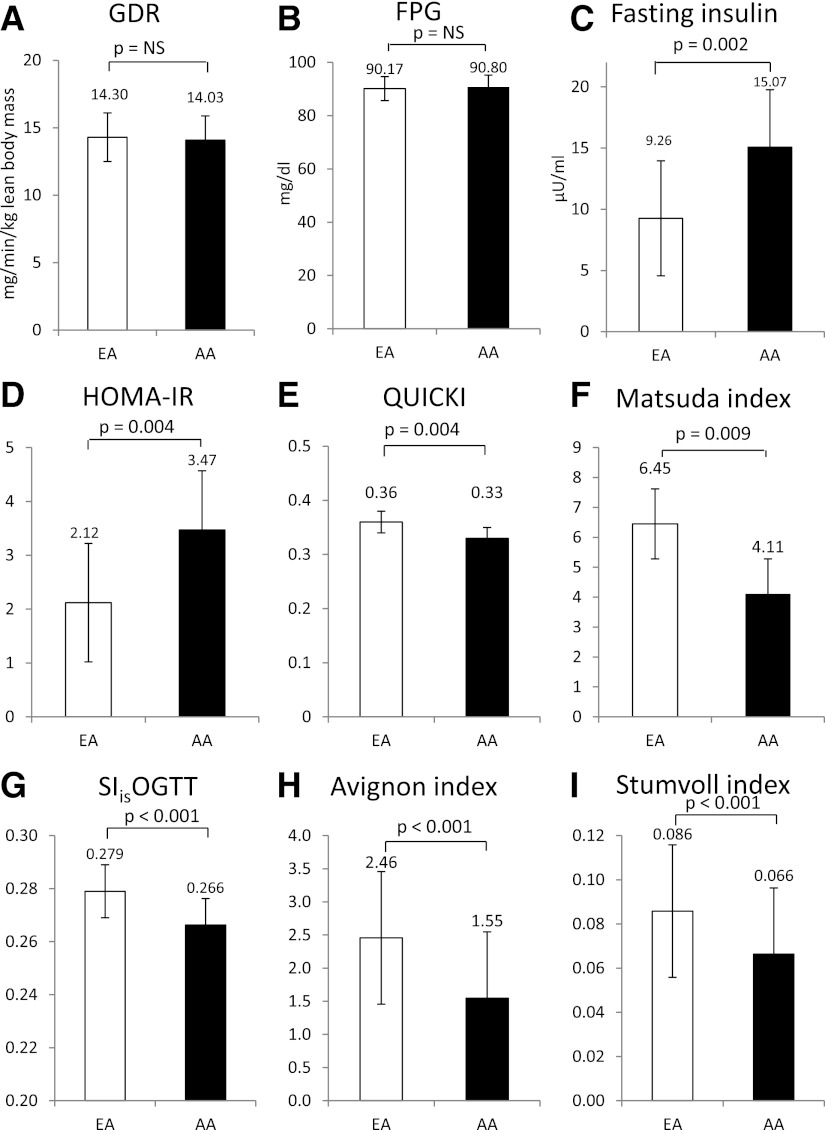
As shown in Fig. 1, although both GDR and fasting plasma glucose were similar in EAs and AAs (Fig. 1A, B), FIL was higher in AAs (Fig. 1C), and AA had lower QUICKI values (Fig. 1E), lower Matsuda index (Fig. 1F), lower SIisOGTT (Fig. 1G), lower Avignon index (Fig. 1H), lower Stumvoll index (Fig. 1I), and higher HOMA-IR values (Fig. 1D) than EAs.
Figure 1.
Mean differences in insulin sensitivity indices between EAs and AAs as assessed by ANCOVA adjusted for BMI. FPG, fasting plasma glucose.
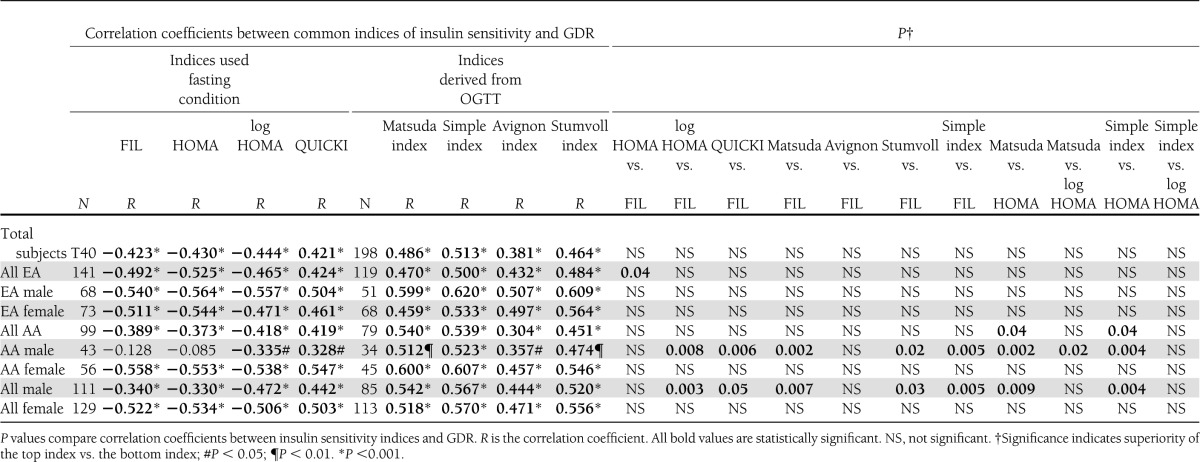
As delineated in Table 2, GDR was significantly negatively correlated with FIL, HOMA-IR, and log-transformed HOMA-IR, and was positively correlated with QUICKI, Matsuda, SIisOGTT, Avignon, and Stumvoll indices, with absolute r values ranging between 0.381 and 0.513 in overall cohort controlling for BMI. When stratified by race and gender, significant correlations persisted, except that in AA males FIL and HOMA-IR failed to achieve a significant relationship with GDR. Log transformation of HOMA-IR produced a significant correlation with GDR in AA males but did not significantly strengthen this relationship in other groups stratified by race and gender. All relationships in Table 2 also were analyzed without adjustment for BMI, which did not affect the results and conclusions (Supplementary Table 1). Steiger t tests were performed to compare correlation coefficients among these insulin sensitivity indices with the GDR measure of insulin sensitivity. In entire cohort, HOMA-IR, log HOMA-IR, QUICKI, Matsuda index, SIisOGTT, Avignon index, and Stumvoll index were not superior to FIL in predicting insulin sensitivity (i.e., r values were similar; P = not significant). In EA subgroup, the strengths of the correlations with GDR were comparable, although HOMA-IR was marginally superior to FIL (P = 0.04) but similar to QUICKI and Matsuda index (Supplementary Table 2); and Matsuda index was superior in a head-to-head comparison with QUICKI, but not with HOMA-IR. In AA females, all indices were similarly correlated with GDR, but it was in AA men that Matsuda index and SIisOGTT emerged as stronger predictors of insulin sensitivity. The correlation between GDR and Matsuda in AA men was significantly stronger than with FIL, HOMA-IR, log HOMA-IR, and QUICKI. The correlation between GDR and SIisOGTT in AA males also was significantly higher than FIL and HOMA-IR. When AA females and AA males were considered together, Matsuda was more strongly correlated with GDR than HOMA-IR or QUICKI but not different from FIL, whereas SIisOGTT was only more strongly correlated with GDR than HOMA-IR. Further details are provided in Supplementary Tables.
Table 2.
Correlation coefficients between common indices of insulin sensitivity and GDR per lean body mass with BMI adjustment and comparison of correlation coefficients between common indices of insulin sensitivity and GDR
Multiple linear, quadratic, and exponential models of fit were analyzed. Both linear and curvilinear models fit the data, although differences in fit were not statistically significant. Scatter plots between GDR and insulin sensitivity indices are shown in Fig. 2 stratified by race and gender. These figures illustrate impact of race and gender on these relationships. For HOMA-IR (Fig. 2A), regression curves essentially overlapped in EA males and EA females; however, the slope was reduced in AA females and was completely flat in AA males. For QUICKI (Fig. 2B), regression lines overlapped for male subgroups (i.e., both EA and AA males) and for both female subgroups (EA and AA females), with the female regression lines having sharper slopes than those observed for males. For Matsuda index (Fig. 2C) and SIisOGTT (Fig. 2D), all regression lines for EA and AA males and females exhibited a relatively greater degree of overlap and similarity of slope.
Figure 2.
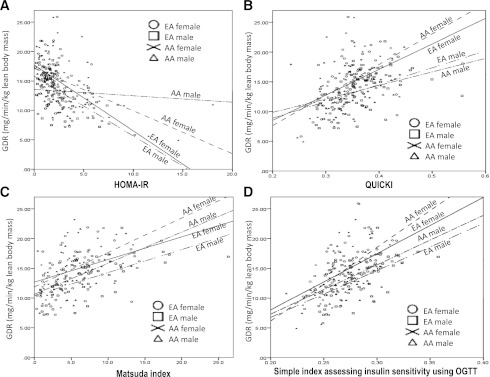
Correlation between the GDR measured by hyperinsulinemic clamp and HOMA-IR, QUICKI, Matsuda index, and SIisOGTT in nondiabetic subjects comparing race and gender. Circle, EA female; square, EA male; cross, AA female; triangle, AA male.
Table 3 shows results of multiple regression analyses assessing independent contributions of each index, race, gender, and BMI as determinants of GDR. FIL and HOMA-IR were similar in that the index, gender, BMI, and the interaction between index and race proved to be significant factors in the multiple regression equation, and together these factors explained 28–29% of variability in GDR. Log transformation of HOMA-IR did not improve the R2 value in the multiple regression equation but eliminated the interaction between index and race. The interaction between QUICKI and gender also had a significant effect on predictability of GDR (β=−0.188; P = 0.03), but this interaction was not operative in the models for other insulin sensitivity indices (data not shown). For Matsuda index, SIisOGTT, and Strumvoll indices, the independent effects of the index, gender, and BMI could explain a greater degree of variability in GDR, ranging between 33.3% and 36.5%.
Table 3.
Coefficient of determinations using a model that includes surrogate indices of insulin sensitivity as independent variables and the hyperglycemic-euglycemic clamp measure as the dependent variable in multiple regression analyses

Discussion
The purpose of this study was to examine the relative ability of key indices based on ambient glucose and insulin concentrations to predict insulin sensitivity, and to study the impact of gender and race on these relationships. We assessed insulin sensitivity via the gold standard hyperinsulinemic-euglycemic clamp, which directly measures the ability of insulin to promote glucose uptake in peripheral tissues. Under the conditions of clamp studies, the degree of steady-state hyperinsulinemia is sufficient to completely suppress hepatic glucose output, and the observed GDRs reflect maximally stimulated glucose transport rates predominantly into skeletal muscle (2,27,28). An important consideration is that EA and AA subgroups, and males and females within each racial group, are characterized by the same degree of insulin sensitivity measured by hyperinsulinemic clamp. Despite similarities in insulin sensitivity, AAs display higher FIL, HOMA-IR, and log HOMA-IR, and lower QUICKI, Matsuda index, SIisOGTT, Avignon index, and Stumvoll index values. Thus, the indices are indicative of greater insulin resistance in AAs despite that the subgroups are well-matched to have similar mean clamp GDR measurements.
We (29) and others (30) have shown that sample populations of EAs and AAs have similar degrees of insulin sensitivity using hyperinsulinemic-euglycemic clamp. Furthermore, investigators using FIL, HOMA-IR, or frequently sampled intravenous glucose tolerance tests that rely on interactions between ambient glucose and insulin values are likely to conclude that AAs are more insulin-resistant than EAs (19,21–25,31–39). The current study provides a direct demonstration in the same subject groups of the discrepancies between surrogate indices and clamp measures of insulin sensitvity in comparing EAs and AAs subgroups. There are several potential explanations. First, AAs have been reported to hypersecrete insulin at any given level of insulin sensitivity (21–23). Additionally, we have analyzed ratios of C-peptide to insulin molar as an indicator of insulin clearance, and we observed that AAs had a lower ratio of C-peptide to insulin than EAs, as other authors also have reported (24,31,38,39). Thus, both insulin hypersecretion and reduced clearance in AAs have the potential to impact relationships involving circulating insulin, glucose, and insulin sensitivity, and could confound the application of these indices to study racial differences in insulin sensitivity. Even so, the indices using fasting levels of insulin and glucose assess systemic concentrations regardless of the impact of insulin secretion or clearance on fasting levels.
A more feasible explanation for these discrepancies relates to potential differences in relative insulin sensitivity affecting different organs, such as liver versus skeletal muscle. HOMA-IR and QUICKI are derived from fasting glucose and insulin levels (4,5) and are believed to primarily reflect hepatic insulin sensitivity (40). Matsuda index, SIisOGTT, Avignon index, and Stumvoll index are surrogate markers calculated from OGTT glucose and insulin values and are used as combined indicators of both hepatic and peripheral insulin sensitivity (6–9). This is contrary to hyperinsulinemic clamps performed at maximally effective steady-state serum insulin levels that fully suppress hepatic glucose production and directly reflect glucose disposal predominantly into skeletal muscle. To explain why AAs were more insulin-resistant than EAs when assessed by surrogate indices, although no difference in insulin sensitivity was observed by clamp, one could hypothesize that AAs are characterized by greater hepatic insulin resistance relative to insulin sensitivity in skeletal muscle and relative to hepatic insulin sensitivity in EAs. Although relative hepatic insulin resistance in AAs is an attractive hypothesis to explain the data, there have been little data published to directly support this idea, and this area is deserving of greater study.
Current data are consistent with previous literature in several aspects. Other authors have reported higher FILs in lean AA adults (19) and in AA adolescents (31) when compared with their EA counterparts. Furthermore, the insulin area under the curve in response to OGTT was reported to be higher in both AA children and adults than in EAs (32,33). Studies using hyperglycemic clamp to assess β-cell function also have found a higher insulin response and lower insulin sensitivity in AA adolescents and adults when compared with EAs (21,22,34,35). Moreover, studies using the minimal model analysis of frequently sampled intravenous glucose tolerance test have revealed lower insulin sensitivity, reduced hepatic insulin extraction and clearance, and increased acute insulin response in AA children and adults compared with EAs (23,24,36–39). However, based on the current results, these previous reports using glucose and insulin levels to estimate insulin sensitivity, whether obtained under fasting conditions or after oral or intravenous glucose challenge, should not be interpreted to mean that AAs display greater peripheral insulin resistance. Race appears to alter insulin and glucose values in a manner that diminishes the ability of these indices to predict systemic or peripheral insulin resistance.
Although several reports have found correlations between surrogate indices and insulin sensitivity (11–17), there has been no definite conclusion regarding which surrogate marker is the most predictive of insulin sensitivity. Our study examined differences in the relationships among GDR and surrogate markers of insulin sensitivity in nondiabetic populations. These results revealed that HOMA-IR, log HOMA-IR, QUICKI, Matsuda index, SIisOGTT, Avignon index, and Stumvoll index are not superior to FIL in predicting GDR in overall nondiabetic population. Furthermore, although all indices were significantly correlated with GDR, the correlation coefficients were rather modest, ranging from 0.381 to 0.513. This finding is consistent with a previous study that demonstrated equivalent usefulness of FIL, HOMA-IR, and QUICKI in nondiabetic subjects (14). Conversely, another report including both nondiabetic and diabetic subjects found the superiority of QUICKI and log transformation of HOMA-IR to FIL (15). In general, the correlations between measures of insulin sensitivity and various indices are stronger when patients with type 2 diabetes are included in the analyses, with representative values ranging from 0.51 to 0.88 (4–6,11–13,15–17), when compared with the current data of nondiabetic subjects. Factors other than insulin resistance contribute to the increase in glucose in type 2 diabetic patients, and glucose toxicity affects circulating insulin levels independently from insulin resistance. Therefore, indices based on fasting glucose and insulin levels may not accurately track with changes in insulin sensitivity. The higher correlation coefficients when diabetic patients are included in these regressions may partially represent an artifact created by the extremely high glucose values in patients who are predictably insulin-resistant by virtue of having diabetes. Consequently, indices based on glucose and insulin values exaggerate the relative degree of insulin resistance, resulting in stronger correlation coefficients in studies including both type 2 diabetic and nondiabetic participants than is evident in studies restricted to nondiabetic subjects. Because insulin resistance is an integral feature of type 2 diabetes, these indices are most valuable to the extent they can identify insulin resistance in nondiabetic individuals. Based on our current data, results using these indices should be interpreted cautiously when used as an estimate of peripheral insulin sensitivity.
Our correlation analyses also found that race and gender significantly impacted the relationship between each index and GDR, and affected the utility of the different indices in specific ethnic and gender subgroups. When stratified by race and gender, significant correlations persisted between GDR and all studied indices with the notable exception that in AA males, FIL and HOMA-IR were no longer related to GDR and the strength of the relationship between QUICKI and GDR was weakened. Log transformation of HOMA-IR was required to achieve a statistically significant relationship with GDR in AA males. Importantly, however, Matsuda index and SIisOGTT emerged as better indices of insulin sensitivity in AA males without diminution in the strength of the correlation with GDR. These findings may or may not relate to differences in hepatic insulin sensitivity as discussed; however, it appears that indices that include both fasting and postchallenge glucose and insulin concentrations, i.e., Matsuda index and SIisOGTT, are better predictors of peripheral insulin sensitivity in AA men than indices that rely only on fasting glucose and insulin levels. In contrast, indices derived from OGTT that incorporate measures of the volume of distribution of glucose (Avignon index) and BMI (Stumvoll index) provide no additional predictive value. Moreover, in male-only analyses consisting of both EAs and AAs, Matsuda index and SIisOGTT proved to be the best predictors of GDR. The data indicate that indices derived from OGTT, i.e., Matsuda index and SIisOGTT, are preferred surrogate indices of insulin sensitivity in any study of AAs and in mixed race studies that include AAs, particularly AA males.
The multiple regression models for prediction of GDR included as independent variables each surrogate index of insulin sensitivity, BMI, race, gender, and interaction between index and race. These analyses highlighted the differential impact of race and gender. Models for FIL, HOMA-IR, and Matsuda index demonstrated independent effects of the index, gender, BMI, and the interaction between index and race in predicting GDR. The model for QUICKI, SIisOGTT, and Avignon index established the independent significance of the index, BMI, and gender, and with QUICKI there was an interaction between QUICKI and gender (data not shown). The model for Stumvoll index indicated independent effects of only the index and gender. The overall predictive value (R2) in these models was generally higher for indices derived from OGTT, i.e., SIisOGTT (R2=0.365), Matsuda index (R2=0.333), and Stumvoll index (R2=0.336), than that observed for FIL (R2=0.280), HOMA-IR (R2=0.290), log HOMA-IR (R2=0.280), or QUICKI (R2=0.265).
A strength of our study is that we enrolled a relatively large nondiabetic cohort with a significant population of both AAs and EAs, providing adequate power to analyze ethnic and gender differences. In comparing our results with those of other publications, it is important to consider that our study enrolled mixed racial groups, including EAs and AAs of both genders, whereas other publications involved more homogenous ethnic populations predominated by Caucasians (4–6,11–13). Furthermore, our study included both obese and nonobese participants; some studies found that predictability of insulin sensitivity indices is lower in lean individuals than in obese counterparts (16,17). One weakness of our study is that race was determined by self-report, which may not accurately reflect ancestral genetic admixture.
CONCLUSIONS
In AAs and EAs with similar peripheral insulin sensitivity measured by hyperinsulinemic clamp, AAs exhibited higher FIL and exhibited more insulin resistance than EAs, as assessed by HOMA-IR, QUICKI, Matsuda index, SIisOGTT, Avignon index, and Stumvoll index. In a mixed race and mixed gender sample population, HOMA-IR, QUICKI, Matsuda index, SIisOGTT, Avignon index, and Stumvoll index were not superior to FIL alone in predicting GDR. Racial and gender differences were detected in the ability of the indices to predict insulin sensitivity. Most remarkably, FIL and HOMA-IR were not correlated with GDR in AA males. In contrast, Matsuda index and SIisOGTT were significantly correlated with GDR in AA males, and Matsuda index was superior to HOMA-IR and QUICKI in overall AA subgroup consisting of males and females. These data indicate that commonly used indices based on glucose and insulin levels should be used cautiously as measures of peripheral insulin sensitivity when comparing mixed gender and mixed race populations. Matsuda index and SIisOGTT appear to be most reliable in studies of AAs.
Supplementary Material
Acknowledgments
This work was supported from grants from the National Institutes of Health (DK-083562 and DK-038764 to W.T.G.) and by the Merit Review program of the U.S. Department of Veterans Affairs (W.T.G.).
No potential conflicts of interest relevant to this article were reported.
V.P., K.H.I., and M.F.L.-D. performed statistical analyses. V.P. wrote the manuscript. K.H.I., M.F.L.-D., A.J.M., and W.T.G. critically reviewed the manuscript. K.H.I., M.F.L.-D., A.J.M., and W.T.G. provided editorial recommendations. W.T.G. conceived and designed the study. W.T.G. is the guarantor of this work and, as such, had full access to all the data in the study and takes responsibility for the integrity of the data and the accuracy of the data analysis.
This study was presented previously in abstract form at the 3rd Annual University of Alabama at Birmingham Diabetes Research Day, Birmingham, Alabama, 1 May 2012.
The authors are grateful to Dr. Barbara Gower (Department of Nutrition Sciences, University of Alabama at Birmingham) and Dr. Mark Beasley (Department of Biostatistics, University of Alabama at Birmingham) for insightful discussions regarding these data. The authors thank the support of the research core facilities of the UAB Diabetes Research and Training Center (P60-DK079626) and their research volunteers.
Footnotes
This article contains Supplementary Data online at http://care.diabetesjournals.org/lookup/suppl/doi:10.2337/dc12-0840/-/DC1.
References
- 1.Reaven GM. Insulin resistance: the link between obesity and cardiovascular disease. Med Clin North Am 2011;95:875–892 [DOI] [PubMed] [Google Scholar]
- 2.DeFronzo RA, Tobin JD, Andres R. Glucose clamp technique: a method for quantifying insulin secretion and resistance. Am J Physiol 1979;237:E214–E223 [DOI] [PubMed] [Google Scholar]
- 3.American Diabetes Association Consensus Development Conference on Insulin Resistance. 5-6 November 1997. Diabetes Care 1998;21:310–314 [DOI] [PubMed] [Google Scholar]
- 4.Matthews DR, Hosker JP, Rudenski AS, Naylor BA, Treacher DF, Turner RC. Homeostasis model assessment: insulin resistance and beta-cell function from fasting plasma glucose and insulin concentrations in man. Diabetologia 1985;28:412–419 [DOI] [PubMed] [Google Scholar]
- 5.Katz A, Nambi SS, Mather K, et al. Quantitative insulin sensitivity check index: a simple, accurate method for assessing insulin sensitivity in humans. J Clin Endocrinol Metab 2000;85:2402–2410 [DOI] [PubMed] [Google Scholar]
- 6.Matsuda M, DeFronzo RA. Insulin sensitivity indices obtained from oral glucose tolerance testing: comparison with the euglycemic insulin clamp. Diabetes Care 1999;22:1462–1470 [DOI] [PubMed] [Google Scholar]
- 7.Bastard JP, Vandernotte JM, Faraj M, et al. Relationship between the hyperinsulinemic-euglycaemic clamp and a new simple index assessing insulin sensitivity in overweight and obese postmenopausal women. Diabetes Metab 2007;33:261–268 [DOI] [PubMed] [Google Scholar]
- 8.Avignon A, Boegner C, Mariano-Goulart D, Colette C, Monnier L. Assessment of insulin sensitivity from plasma insulin and glucose in the fasting or post oral glucose-load state. Int J Obes Relat Metab Disord 1999;23:512–517 [DOI] [PubMed] [Google Scholar]
- 9.Stumvoll M, Mitrakou A, Pimenta W, et al. Use of the oral glucose tolerance test to assess insulin release and insulin sensitivity. Diabetes Care 2000;23:295–301 [DOI] [PubMed] [Google Scholar]
- 10.Reaven G. All obese individuals are not created equal: insulin resistance is the major determinant of cardiovascular disease in overweight/obese individuals. Diab Vasc Dis Res 2005;2:105–112 [DOI] [PubMed] [Google Scholar]
- 11.Bonora E, Targher G, Alberiche M, et al. Homeostasis model assessment closely mirrors the glucose clamp technique in the assessment of insulin sensitivity: studies in subjects with various degrees of glucose tolerance and insulin sensitivity. Diabetes Care 2000;23:57–63 [DOI] [PubMed] [Google Scholar]
- 12.Mari A, Pacini G, Brazzale AR, Ahrén B. Comparative evaluation of simple insulin sensitivity methods based on the oral glucose tolerance test. Diabetologia 2005;48:748–751 [DOI] [PubMed] [Google Scholar]
- 13.Chen H, Sullivan G, Quon MJ. Assessing the predictive accuracy of QUICKI as a surrogate index for insulin sensitivity using a calibration model. Diabetes 2005;54:1914–1925 [DOI] [PubMed] [Google Scholar]
- 14.Straczkowski M, Stepień A, Kowalska I, Kinalska I. Comparison of simple indices of insulin sensitivity using the euglycemic hyperinsulinemic clamp technique. Med Sci Monit 2004;10:CR480–CR484 [PubMed] [Google Scholar]
- 15.Mather KJ, Hunt AE, Steinberg HO, et al. Repeatability characteristics of simple indices of insulin resistance: implications for research applications. J Clin Endocrinol Metab 2001;86:5457–5464 [DOI] [PubMed] [Google Scholar]
- 16.Yokoyama H, Emoto M, Fujiwara S, et al. Quantitative insulin sensitivity check index and the reciprocal index of homeostasis model assessment in normal range weight and moderately obese type 2 diabetic patients. Diabetes Care 2003;26:2426–2432 [DOI] [PubMed] [Google Scholar]
- 17.Kang ES, Yun YS, Park SW, et al. Limitation of the validity of the homeostasis model assessment as an index of insulin resistance in Korea. Metabolism 2005;54:206–211 [DOI] [PubMed] [Google Scholar]
- 18.Kahn SE. The importance of the beta-cell in the pathogenesis of type 2 diabetes mellitus. Am J Med 2000;108(Suppl 6a):2S–8S [DOI] [PubMed] [Google Scholar]
- 19.Palaniappan LP, Carnethon MR, Fortmann SP. Heterogeneity in the relationship between ethnicity, BMI, and fasting insulin. Diabetes Care 2002;25:1351–1357 [DOI] [PMC free article] [PubMed] [Google Scholar]
- 20.Haffner SM, D’Agostino RJ, Saad MF, et al. Increased insulin resistance and insulin secretion in nondiabetic African-Americans and Hispanics compared with non-Hispanic whites. The Insulin Resistance Atherosclerosis Study. Diabetes 1996;45:742–748 [DOI] [PubMed] [Google Scholar]
- 21.Arslanian S, Suprasongsin C. Differences in the in vivo insulin secretion and sensitivity of healthy black versus white adolescents. J Pediatr 1996;129:440–443 [DOI] [PubMed] [Google Scholar]
- 22.Arslanian S, Suprasongsin C, Janosky JE. Insulin secretion and sensitivity in black versus white prepubertal healthy children. J Clin Endocrinol Metab 1997;82:1923–1927 [DOI] [PubMed] [Google Scholar]
- 23.Gower BA, Fernández JR, Beasley TM, Shriver MD, Goran MI. Using genetic admixture to explain racial differences in insulin-related phenotypes. Diabetes 2003;52:1047–1051 [DOI] [PubMed] [Google Scholar]
- 24.Osei K, Schuster DA. Race and ethnicity determine serum insulin and C-peptide concentrations and hepatic insulin extraction and insulin clearance: comparative studies of three populations of West African ancestry and white Americans. Metabolism 1997;46:53–58 [DOI] [PubMed] [Google Scholar]
- 25.Gower BA, Granger WM, Franklin F, Shewchuk RM, Goran MI. Contribution of insulin secretion and clearance to glucose-induced insulin concentration in african-american and caucasian children. J Clin Endocrinol Metab 2002;87:2218–2224 [DOI] [PubMed] [Google Scholar]
- 26.Lara-Castro C, Newcomer BR, Rowell J, et al. Effects of short-term very low-calorie diet on intramyocellular lipid and insulin sensitivity in nondiabetic and type 2 diabetic subjects. Metabolism 2008;57:1–8 [DOI] [PMC free article] [PubMed] [Google Scholar]
- 27.Garvey WT, Olefsky JM, Griffin J, Hamman RF, Kolterman OG. The effect of insulin treatment on insulin secretion and insulin action in type II diabetes mellitus. Diabetes 1985;34:222–234 [DOI] [PubMed] [Google Scholar]
- 28.DeFronzo RA, Ferrannini E, Hendler R, Felig P, Wahren J. Regulation of splanchnic and peripheral glucose uptake by insulin and hyperglycemia in man. Diabetes 1983;32:35–45 [DOI] [PubMed] [Google Scholar]
- 29.Ingram KH, Lara-Castro C, Gower BA, et al. Intramyocellular lipid and insulin resistance: differential relationships in European and African Americans. Obesity (Silver Spring) 2011;19:1469–1475 [DOI] [PMC free article] [PubMed] [Google Scholar]
- 30.Lee S, Guerra N, Arslanian S. Skeletal muscle lipid content and insulin sensitivity in black versus white obese adolescents: is there a race differential? J Clin Endocrinol Metab 2010;95:2426–2432 [DOI] [PMC free article] [PubMed] [Google Scholar]
- 31.Jiang X, Srinivasan SR, Radhakrishnamurthy B, Dalferes ERJ, Berenson GS. Racial (black-white) differences in insulin secretion and clearance in adolescents: the Bogalusa heart study. Pediatrics 1996;97:357–360 [PubMed] [Google Scholar]
- 32.Svec F, Nastasi K, Hilton C, Bao W, Srinivasan SR, Berenson GS. Black-white contrasts in insulin levels during pubertal development. The Bogalusa Heart Study. Diabetes 1992;41:313–317 [DOI] [PubMed] [Google Scholar]
- 33.Donahue RP, Bean JA, Donahue RA, Goldberg RB, Prineas RJ. Insulin response in a triethnic population: effects of sex, ethnic origin, and body fat. Miami Community Health Study. Diabetes Care 1997;20:1670–1676 [DOI] [PubMed] [Google Scholar]
- 34.Chiu KC, Cohan P, Lee NP, Chuang LM. Insulin sensitivity differs among ethnic groups with a compensatory response in beta-cell function. Diabetes Care 2000;23:1353–1358 [DOI] [PubMed] [Google Scholar]
- 35.Chiu KC, Chuang LM, Yoon C. Comparison of measured and estimated indices of insulin sensitivity and beta cell function: impact of ethnicity on insulin sensitivity and beta cell function in glucose-tolerant and normotensive subjects. J Clin Endocrinol Metab 2001;86:1620–1625 [DOI] [PubMed] [Google Scholar]
- 36.Osei K, Schuster DP. Ethnic differences in secretion, sensitivity, and hepatic extraction of insulin in black and white Americans. Diabet Med 1994;11:755–762 [DOI] [PubMed] [Google Scholar]
- 37.Haffner SM, Howard G, Mayer E, et al. Insulin sensitivity and acute insulin response in African-Americans, non-Hispanic whites, and Hispanics with NIDDM: the Insulin Resistance Atherosclerosis Study. Diabetes 1997;46:63–69 [DOI] [PubMed] [Google Scholar]
- 38.Ball GD, Huang TT, Gower BA, et al. Longitudinal changes in insulin sensitivity, insulin secretion, and beta-cell function during puberty. J Pediatr 2006;148:16–22 [DOI] [PubMed] [Google Scholar]
- 39.Chandler-Laney PC, Phadke RP, Granger WM, et al. Age-related changes in insulin sensitivity and β-cell function among European-American and African-American women. Obesity (Silver Spring) 2011;19:528–535 [DOI] [PMC free article] [PubMed] [Google Scholar]
- 40.Muniyappa R, Lee S, Chen H, Quon MJ. Current approaches for assessing insulin sensitivity and resistance in vivo: advantages, limitations, and appropriate usage. Am J Physiol Endocrinol Metab 2008;294:E15–E26 [DOI] [PubMed] [Google Scholar]
Associated Data
This section collects any data citations, data availability statements, or supplementary materials included in this article.


