

Abstract
OBJECTIVE
In type 2 diabetes mellitus (T2DM), it remains unclear whether coronary artery calcium (CAC) provides additional information about cardiovascular disease (CVD) mortality beyond the Framingham Risk Score (FRS) factors.
RESEARCH DESIGN AND METHODS
A total of 1,123 T2DM participants, ages 34–86 years, in the Diabetes Heart Study followed up for an average of 7.4 years were separated using baseline computed tomography scans of CAC (0–9, 10–99, 100–299, 300–999, and ≥1,000). Logistic regression was performed to examine the association between CAC and CVD mortality adjusting for FRS. Areas under the curve (AUC) with and without CAC were compared. Net reclassification improvement (NRI) compared FRS (model 1) versus FRS+CAC (model 2) using 7.4-year CVD mortality risk categories 0% to <7%, 7% to <20%, and ≥20%.
RESULTS
Overall, 8% of participants died of cardiovascular causes during follow-up. In multivariate analysis, the odds ratios (95% CI) for CVD mortality using CAC 0–9 as the reference group were, CAC 10–99: 2.93 (0.74–19.55); CAC 100–299: 3.17 (0.70–22.22); CAC 300–999: 4.41(1.15–29.00); and CAC ≥1,000: 11.23 (3.24–71.00). AUC (95% CI) without CAC was 0.70 (0.67–0.73), AUC with CAC was 0.75 (0.72–0.78), and NRI was 0.13 (0.07–0.19).
CONCLUSIONS
In T2DM, CAC predicts CVD mortality and meaningfully reclassifies participants, suggesting clinical utility as a risk stratification tool in a population already at increased CVD risk.
Diabetes is a coronary heart disease risk equivalent because diabetes-affected individuals experience a poorer prognosis compared with nondiabetic subjects (1). The high overall mortality is largely driven by increased cardiovascular mortality (1–3). Diabetes is characterized by accelerated atherosclerosis (4), with increased amounts of connective tissue, glycoproteins, and calcified plaque in blood vessels (5,6). Imaging by computed tomography (CT) reveals that diabetes-affected individuals have extensive calcification of their vascular beds (7–9), reported as the coronary artery calcium (CAC) score, reflecting significant cardiovascular disease (CVD) burden.
Several observational studies demonstrate that subclinical atherosclerosis, such as CAC, predicts (10–12) and reclassifies (13–15) future CVD events, independent of conventional risk factors in the general population. We have previously shown that a higher CAC score in diabetes predicts all-cause mortality (16). Whether higher CAC scores are associated with adverse clinical outcomes, in particular CVD mortality, in diabetes has not been studied extensively. One aim of this study was to examine the risk of CVD mortality in participants with diabetes across a range of CAC scores.
Pencina et al. (17) introduced the concept of net reclassification improvement (NRI), which measures the extent to which individuals with and without events are appropriately reclassified into clinically accepted higher or lower risk categories with the addition of a new marker. A second part of this study was to evaluate the extent to which adding CAC to a model based on Framingham risk factors correctly reclassifies diabetes participant’s risk of future CVD mortality.
RESEARCH DESIGN AND METHODS
Study population and data collection
The Diabetes Heart Study (DHS) is a community-based study of the genetic and epidemiological contributions to diabetic heart disease in which siblings concordant for type 2 diabetes mellitus (T2DM), as well as unaffected family members, were recruited from internal medicine and endocrinology clinics in western North Carolina. The DHS study design has been described in detail previously (18). To summarize, entry criteria required index patients diagnosed with T2DM after age 34 years and no historical evidence of diabetic ketoacidosis. At least one T2DM sibling was recruited for each index individual enrolled. Additional nondiabetic and diabetic family members were also enrolled when possible. Relevant to the study reported here, this is a community-based cohort that reflects a cross section of families with diabetes-affected members in our region. The study was approved by the institutional review board at the Wake Forest School of Medicine, and all subjects provided written informed consent for all study protocols.
Laboratory measurements
The participant examinations were conducted in the General Clinical Research Center of the Wake Forest Baptist Medical Center and included interviews for medical history and health behaviors, including smoking history, and anthropometric measurements. Weight and height were measured to the nearest 0.1 kg and 0.5 cm, and resting blood pressure was recorded. Hypertension was defined as current use of any antihypertensive medication or a resting systolic blood pressure greater than 140 mmHg or resting diastolic blood pressure greater than 90 mmHg. Fasting laboratory assays for total cholesterol, HDL cholesterol, triglycerides, glucose, and hemoglobin A1c were obtained. LDL cholesterol was calculated with the Friedewald equation (19). Diabetes was defined by self-reported history of adult onset of diabetes, fasting glucose 126 mg/dL or greater, or use of insulin or oral glucose-lowering medications.
CAC
CAC was measured using fast-gated helical CT. All scans were performed on two single-slice subsecond helical CT scanners equipped for retrospective cardiac gating and capable of 500-ms temporal resolution (HiSpeed LX with the Smart Score Cardiac scan package; General Electric Medical Systems, Milwaukee, WI). Participants were placed supine on the CT couch over a quality-control calibration phantom (Image Analysis, Columbia, KY). After a scout image of the chest was obtained, a helical volume of the entire heart during suspended respiration at end inspiration was obtained with the following parameters: 3-mm slice thickness, 26-cm display field of view, retrospective cardiac gating, 120 kV, 240 mA, and CT scan pitch adjusted to heart rate, as previously described (20). To further improve the precision of the calcium score, a replicated scan was performed immediately after the initial scan so that the average of the two scores could be calculated. The reproducibility of the calcium score was high (Spearman correlation coefficient r = 0.98) between the first and second calcium scores. The amount of coronary calcium was scored using a modified Agatston method with the traditional 130-Hounsfield units threshold and a minimum lesion definition of 0.52 mm2. A previously published work showed this method has very high correlation with the electron-beam CT–derived measure of coronary calcium (r = 0.98) and high agreement when categorizing individuals based on their coronary calcium score (20).
Cardiovascular mortality
The primary outcome, cardiovascular mortality, was recorded for an average of 7.4 years (range 4–12) after CAC screening. At intervals of 9 to 12 months, an interviewer contacted each participant or a family member by telephone to inquire about well-being. For participants who had died, interviews were conducted with the next-of-kin, and copies of death certificates were obtained. A search by Social Security number in the national Social Security Death Index was also performed to determine the vital status of subjects lost to follow-up.
Cardiovascular death was defined as death as a result of myocardial infarction, congestive heart failure, cardiac arrhythmia, sudden cardiac death, peripheral vascular disease, or stroke as annotated on death certificates. Noncardiovascular death was defined as death due to cancer, infection, end-stage renal disease, accident, Alzheimer’s dementia, or others, including obstructive pulmonary disease, pulmonary fibrosis, or liver failure.
Statistical analysis
We used χ2 tests for discrete variables and one-way ANOVA for continuous variables to test for differences in demographic and risk factors between surviving and deceased participants.
Subjects were separated into five groups on the basis of CAC scores derived from baseline CT scans (CAC scores 0–9, 10–99, 100–299, 300–999, and ≥1,000). Only one subject with a CAC score of 0 died of cardiovascular causes; hence, for statistical validity and robustness, we selected the above CAC categories. Logistic regression was used to estimate odds ratios (ORs) for CVD mortality for each CAC group. The discriminatory capacity of CAC was assessed by using the area under the receiver operating characteristic curve (AUC) C statistic as an index of model performance (21). The C statistic reflects the concordance of predictions with actual outcomes in rank order, with a C statistic of 1.0 indicating perfect discrimination (21).
The NRI index (17) was also determined and compared with the distribution of risk with Framingham Risk Score (FRS) variables (model 1) versus FRS+CAC (model 2). The predicted risk for CVD mortality was categorized into prespecified categories as 0% to <7%, 7% to <20%, and ≥20% using logistic regression models. These categories were chosen to indicate ≤1% annual mortality as being low risk, 1–3% as intermediate risk, and ≥3% as high risk. The NRI is estimated as {[(number of events reclassified higher – number of events reclassified lower)/number of events] – [(number of nonevents reclassified higher – number of nonevents reclassified lower)/number of nonevents]}.
Additional analyses were performed to test for interactions between CAC and race and sex. In a separate analysis that used CAC score as a continuous variable, the base 2 logarithm of the sum of the CAC score plus 1 (log2 [CAC + 1]) was used. The choice of base 2 for the logarithm allowed examination of how a doubling of the calcium score affects CVD mortality, because each unit difference in the log-transformed CAC score represents a doubling of the score. Additional multivariable analyses used ordinal CAC categories to predict CVD mortality. All models were adjusted for age, sex, race, smoking, total and HDL cholesterol, systolic blood pressure, and antihypertensive medications. In additional analyses, adjustment for duration of diabetes, and hemoglobin A1c, were also undertaken. All statistical analyses were performed using JMP 8 software (SAS Institute, Cary, NC). Statistical significance was accepted at P < 0.05.
RESULTS
Participant characteristics
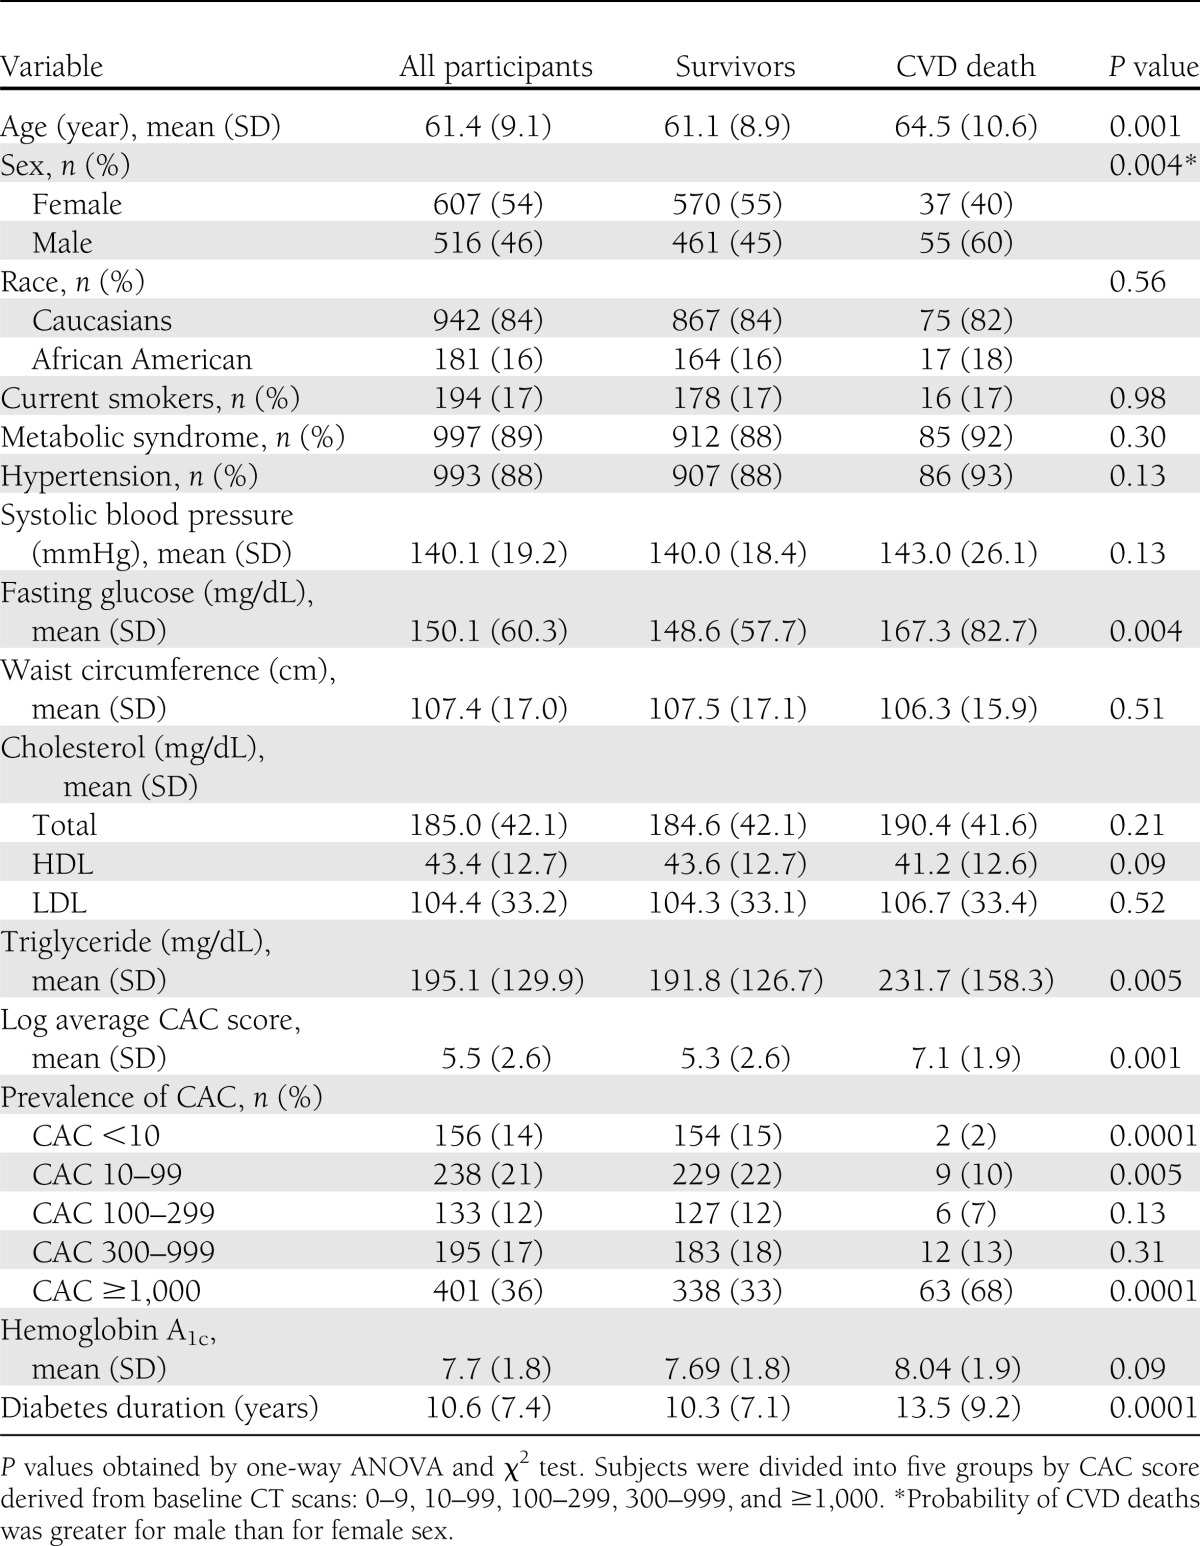
Among 1,443 participants in the DHS cohort, 224 nondiabetic subjects and 96 subjects with missing data were excluded: 61 for CAC score, 25 for total and HDL cholesterol, 3 for systolic blood pressure and antihypertensive medications, and 7 for smoking history. The baseline characteristics of 1,123 participants are reported in Table 1. The participants were a mean age of 61 years, >50% were women, and 16% were African American. A total of 86% participants (963 of 1,123) had a CAC score ≥10, and 23% of African American participants (42 of 181), 12% of Caucasians (114 of 942), 21% of women (128 of 607), and only 5% of men (28 of 516) had a CAC score <10. Risk factors were nearly equally distributed between the CVD mortality and no mortality groups, except for higher glucose and triglyceride levels in the CVD mortality group. Significant differences were found between the two groups, with higher mean CAC scores, higher prevalence of CAC scores ≥1,000, higher hemoglobin A1c levels, and longer diabetes duration in the CVD mortality group (Table 1).
Table 1.
Baseline demographic characteristics and risk factors stratified by cardiovascular mortality in the DHS cohort
CVD mortality
During 7.4 years of follow-up, 92 CVD deaths were identified: myocardial infarction (n = 40), coronary artery disease (n = 24), cardiac arrest (n = 12), congestive heart failure (n = 12), and stroke (n = 4), as annotated in death certificates. There was an increased incidence of CVD mortality across higher categories of CAC (P < 0.0001; Supplementary Fig. 1). In a multivariate analysis, adjusted for age, sex, race, smoking, total and HDL cholesterol, systolic blood pressure, and antihypertensive medications, the ORs (95% CI) for CVD mortality using CAC scores 0–9 as a reference group were CAC 10–99: 2.93 (0.74–19.55); CAC 100–299: 3.17 (0.70–22.22); CAC 300–999: 4.41(1.15–29.00); and CAC ≥1,000: 11.23 (3.24–71.00; Fig. 1). In additional analyses, after further adjusting for duration of diabetes, and hemoglobin A1c, the results were qualitatively similar (Supplementary Table 1).
Figure 1.

OR for cardiovascular mortality with higher CAC scores in the DHS cohort compared with CAC score <10 in a full model.
The AUC for the prediction of CVD mortality was 0.70, using traditional Framingham risk variables, and increased to 0.75 (P = 0.0001) with the addition of CAC to the model (Fig. 2).
Figure 2.

Receiver operating characteristic curve analysis depicting AUC with and without CAC to predict CVD mortality. (A high-quality color representation of this figure is available in the online issue.)
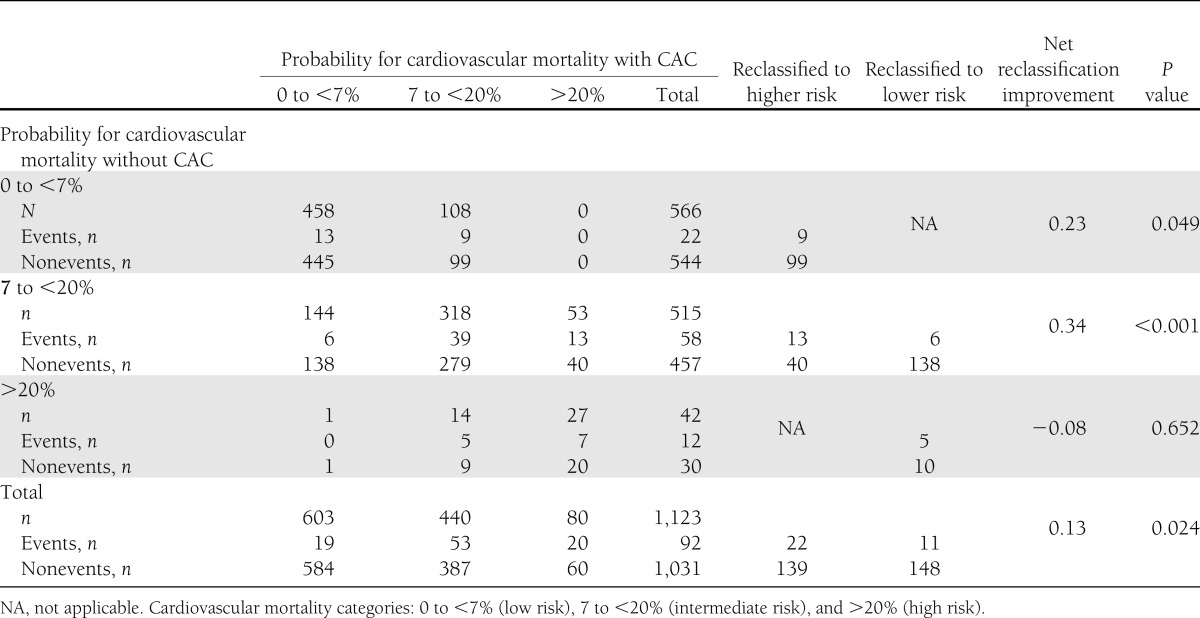
Cross-tabulations of the 7.4-year estimated mortality using the models with and without CAC are reported in Table 2. The addition of CAC to the predictive model resulted in reclassification of 28% of the sample. The NRI was 0.12 for events and 0.01 for nonevents, achieving an NRI for the entire study cohort of 0.13 (95% CI 0.07–0.19; P < 0.02; Table 2). Overall, 161 individuals in the entire cohort were reclassified to a higher risk category, with an event rate of 13.7%, and 159 were reclassified to a lower risk category, with an event rate of 6.9%. The 7.4-year event rate for the entire cohort was 8.2%. Among intermediate-risk individuals, 53 (10%) were reclassified as high risk, and 144 (28%) were classified as low risk (NRI 0.34 [0.28–0.40]; P < 0.001). In model 1 (FRS alone), 54% of the cohort was classified in the highest or lowest risk categories compared with 61% in model 2 (FRS+CAC). An additional 24% of those who experienced events were reclassified as high risk, and an additional 14% without events were reclassified as low risk using model 2.
Table 2.
Risk of cardiovascular mortality at 7.4 years predicted by models with and without CAC in DHS
A separate analysis found no significant interaction between CAC and race (P = 0.5) and CAC and sex (P = 0.7) in the prediction of CVD mortality. In addition, a separate sensitivity analysis using CAC as a continuous variable in a full model showed CAC was a significant predictor of CVD mortality (P = 0.0001). After adjustment, a doubling of the CAC score resulted in a 24% increase in the risk of CVD mortality. In another analysis, the odds for CVD death increased by 71% in patients with diabetes for every increase in CAC grouping from 10 to 99 to 100 to 299, 300 to 999, and ≥1,000 (P = 0.0001; Supplementary Table 1).
CONCLUSIONS
The current study examined the utility of CAC in predicting CVD mortality in a biracial sample of diabetes-affected subjects with a mean follow-up of 7.4 years. CAC predicted CVD mortality independent of Framingham risk factors and the presence of any CAC (CAC ≥10) predicted risk for CVD mortality compared with participants with no or minimal CAC (CAC 0–9). Further, the addition of CAC to traditional risk factors resulted in a significant improvement in the classification of risk for the prediction of CVD mortality. An important feature of this study design is that the results likely reflect real trends of mortality in this region. The DHS is an observational study in which the participants are representative of our community. Mortality has not been affected by confounders such as an imposed clinical trial design or selective inclusion or exclusion of diabetes-affected participants based on the presence or absence of clinical characteristics.
Several studies have shown that CAC can be used as a CVD event risk stratification tool in the general population because it has prognostic power beyond the Framingham risk factors (13,14,22,23). However, few data exist on the prognostic value of CAC for CVD events and none for CVD mortality among diabetes-affected participants. In this analysis of a high-risk diabetes-affected population, CAC provides added insight into the prognosis of CVD-related mortality.
In a study of 510 asymptomatic T2DM subjects from West London, the adjusted risk for CVD events during a mean follow-up of 2.2 (SD 0.4) years was 58.05 (95% CI 12.28–274.48) among participants with CAC ≥1,000 compared with participants with no CAC (24). CAC was categorized into four segments (≤100, 101–400, 401–1,000, and >1,000 Agatston units), and the adjusted overall rate of death and nonfatal myocardial infarction by CAC categories was 0% (n = 0), 2.6% (n = 2), 13.3% (n = 4), and 17.9% (n = 5), respectively (P < 0.0001), which are similar to our findings of CVD mortality rates ranging from 1 to 16% by CAC categories (Supplementary Fig. 1). The investigators found that CAC predicted events more accurately than the FRS (AUC 0.92 for CAC vs. 0.60 for FRS, P < 0.0001), similar to our findings (Fig. 2). In the Prospective Evaluation of Diabetic Ischaemic Disease by Computed Tomography (PREDICT) study (25), designed to evaluate CAC as a predictor of CVD events in T2DM, 589 T2DM subjects were monitored for a median of 4 years and 66 CVD events were identified. Hazard ratios relative to CAC (0–10) were CAC 11–100, 5.4 (P = 0.02); 101–400, 10.5 (P = 0.001); 401–1,000, 11.9 (P = 0.001); and >1,000, 19.8 (P < 0.001). The current analysis extends and adds to this body of literature because it involved a larger cohort of T2DM (n = 1,123) with longer follow-up (mean 7.4 years) and focused on CVD mortality as the primary end point.
In a prior report from the DHS, we showed that CAC was an independent predictor of all-cause mortality (16). Using a similar approach to risk assessment, we observed an estimated OR >6.7 when highest CAC was compared with lowest CAC for all-cause mortality. In this report we have extended this observation to focus on CVD-related mortality, where it is striking that we observed a doubling of an OR >11 for CVD-associated death. We have further included conventional risk factors from the components of the FRS and shown that this substantial risk is observed when accounting for FRS. We have also shown that AUC analysis of mortality risk significantly improves predictive value beyond FRS components, even in this high-risk T2DM sample. Further, we have incorporated NRI analysis to show that CAC reclassifies individuals with intermediate FRS, which is statistically significant. Each of these elements is new to this current study and represents a significant step forward in understanding of mortality in the population of diabetes-affected individuals.
Diabetes is characterized by high CVD mortality (2). In diabetes, multivessel coronary atherosclerosis is often present before ischemic symptoms occur and before treatment is instituted (3). A delayed recognition of various forms of CVD worsens the prognosis for survival in diabetes. Several studies (24,26,27) indicate that in diabetes, traditional risk factors predict CAC but not other prognostic markers such as an abnormal myocardial perfusion. Abnormal myocardial perfusion has been validated as a prognostic tool in the general population (28), however, it has poor specificity in diagnosing CVD in diabetes (29). Similarly, carotid intimal medial thickness has been found to be inferior to CAC in the prediction of CVD events (12). Meaningful CAC burden (≥400) is high among patients with diabetes compared with randomly selected nondiabetic control subjects matched for CVD risk factors (8), indicating that CAC can be used as a simple, rapid, noninvasive measure of atherosclerosis in diabetes.
These findings suggest that CAC is a more reliable indicator of CVD risk than the established cardiovascular risk factors, probably because measuring the atherosclerotic plaque burden takes into account risk factors (both known and unknown) and their possible interactions. We compared characteristics of patients with diabetes CAC 0–9 versus CAC ≥10 to examine other factors potentially contributing to this increased risk of mortality and found that patients with diabetes with higher CAC scores had longer diabetes duration, were older, more likely to be men (51% vs. 18%), and had higher mean systolic blood pressure (data not shown). However, even after adjustment for systolic blood pressure, antihypertensive medications, diabetes duration and hemoglobin A1c, results were qualitatively similar (Supplementary Table 1), highlighting the significance of CAC as an independent risk predictor.
The strength of this study is the inclusion of a large population of T2DM participants with meticulous standardized measures of CAC and data collection leading to generalizability in the diabetes population. In addition to showing high risk associated with high levels of CAC, we found a subset of T2DM participants with none or minimal CAC scores who had a low risk for CVD mortality. Another feature of this study is that the addition of CAC to traditional risk factors leads to a clinically and statistically significant overall reclassification of 28% of participants with a significant reclassification in the intermediate-risk category. However, limitations need to be acknowledged. The DHS does not include patients with type 1 diabetes, but previous studies show that both forms of the disease have increased coronary calcification compared with nondiabetic subjects (7,8). Thus, the results of the current analysis may be applicable in insulin-dependent diabetic patients as well. In addition, the selection of participants from a single center may limit the generalizability of results; however, studies from different regions have also reached similar conclusions (24,25).
In conclusion, there is an epidemic of obesity and diabetes and its aftermath of micro- and macrovascular complications, necessitating multiple approaches that include better risk stratification strategies and novel therapies. This study indicates that CAC imaging can identify high- and low-risk diabetic individuals. Second, CAC scoring can be used to reclassify intermediate-risk diabetic subjects into higher- and lower-risk categories. Lastly, although diabetes is a CVD risk equivalent, there is residual cardiovascular risk that is amply captured by a CAC score above and beyond the traditional Framingham risk variables. In addition, CAC identifies a subgroup of patients with diabetes who are at low risk for CVD mortality. This may have therapeutic implications leading to individualized therapies. Further, the CAC score provides an objective quantifiable measure of disease severity to both patient and physician and has the potential to modify behavior. However, implementation of aggressive medical management in patients with diabetes with advanced calcification leading to decreased mortality remains to be determined. These issues, plus cost considerations and radiation exposure, underscore the need for further evaluation of imaging technology to maximize potential benefit in terms of identifying disease and instituting intensive therapy in this high-risk patient population.
Supplementary Material
Acknowledgments
This study was supported in part by the General Clinical Research Center of the Wake Forest School of Medicine (Grant M01-RR07122) and by Grants R01-AR48797 (to J.J.C.) and R01-HL67348 and R01-HL092301 (to D.W.B.).
No potential conflicts of interest relevant to this article were reported.
S.A. wrote the research proposal, performed statistical analysis, and wrote the manuscript. A.J.C. researched data and reviewed and edited the manuscript. D.M.H., B.I.F., and J.J.C. reviewed and edited the manuscript. N.W.J. performed statistical analysis and reviewed and edited the manuscript. J.X. researched data and helped with statistical analysis. D.W.B. contributed to discussion and reviewed and edited the manuscript. D.W.B. is the guarantor of this work and, as such, had full access to all the data in the study and takes responsibility for the integrity of the data and the accuracy of the data analysis.
Parts of this study were presented in abstract form at the 71st Scientific Sessions of the American Diabetes Association, San Diego, California, 24–28 June 2011.
Footnotes
This article contains Supplementary Data online at http://care.diabetesjournals.org/lookup/suppl/doi:10.2337/dc12-1548/-/DC1.
References
- 1.Sarwar N, Gao P, Seshasai SR, et al. Emerging Risk Factors Collaboration Diabetes mellitus, fasting blood glucose concentration, and risk of vascular disease: a collaborative meta-analysis of 102 prospective studies. Lancet 2010;375:2215–2222 [DOI] [PMC free article] [PubMed] [Google Scholar]
- 2.Wilson PW. Diabetes mellitus and coronary heart disease. Am J Kidney Dis 1998;32(Suppl. 3):S89–S100 [DOI] [PubMed] [Google Scholar]
- 3.Grundy SM, Benjamin IJ, Burke GL, et al. Diabetes and cardiovascular disease: a statement for healthcare professionals from the American Heart Association. Circulation 1999;100:1134–1146 [DOI] [PubMed] [Google Scholar]
- 4.Kannel WB, McGee DL. Diabetes and cardiovascular disease. The Framingham study. JAMA 1979;241:2035–2038 [DOI] [PubMed] [Google Scholar]
- 5.Wagenknecht LE, Bowden DW, Carr JJ, Langefeld CD, Freedman BI, Rich SS. Familial aggregation of coronary artery calcium in families with type 2 diabetes. Diabetes 2001;50:861–866 [DOI] [PubMed] [Google Scholar]
- 6.Everhart JE, Pettitt DJ, Knowler WC, Rose FA, Bennett PH. Medial arterial calcification and its association with mortality and complications of diabetes. Diabetologia 1988;31:16–23 [DOI] [PubMed] [Google Scholar]
- 7.Arad Y, Newstein D, Cadet F, Roth M, Guerci AD. Association of multiple risk factors and insulin resistance with increased prevalence of asymptomatic coronary artery disease by an electron-beam computed tomographic study. Arterioscler Thromb Vasc Biol 2001;21:2051–2058 [DOI] [PubMed] [Google Scholar]
- 8.Schurgin S, Rich S, Mazzone T. Increased prevalence of significant coronary artery calcification in patients with diabetes. Diabetes Care 2001;24:335–338 [DOI] [PubMed] [Google Scholar]
- 9.Hoff JA, Quinn L, Sevrukov A, et al. The prevalence of coronary artery calcium among diabetic individuals without known coronary artery disease. J Am Coll Cardiol 2003;41:1008–1012 [DOI] [PubMed] [Google Scholar]
- 10.Detrano R, Guerci AD, Carr JJ, et al. Coronary calcium as a predictor of coronary events in four racial or ethnic groups. N Engl J Med 2008;358:1336–1345 [DOI] [PubMed] [Google Scholar]
- 11.Raggi P, Shaw LJ, Berman DS, Callister TQ. Prognostic value of coronary artery calcium screening in subjects with and without diabetes. J Am Coll Cardiol 2004;43:1663–1669 [DOI] [PubMed] [Google Scholar]
- 12.Folsom AR, Kronmal RA, Detrano RC, et al. Coronary artery calcification compared with carotid intima-media thickness in the prediction of cardiovascular disease incidence: the Multi-Ethnic Study of Atherosclerosis (MESA). Arch Intern Med 2008;168:1333–1339 [DOI] [PMC free article] [PubMed] [Google Scholar]
- 13.Polonsky TS, McClelland RL, Jorgensen NW, et al. Coronary artery calcium score and risk classification for coronary heart disease prediction. JAMA 2010;303:1610–1616 [DOI] [PMC free article] [PubMed] [Google Scholar]
- 14.Erbel R, Möhlenkamp S, Moebus S, et al. Heinz Nixdorf Recall Study Investigative Group Coronary risk stratification, discrimination, and reclassification improvement based on quantification of subclinical coronary atherosclerosis: the Heinz Nixdorf Recall study. J Am Coll Cardiol 2010;56:1397–1406 [DOI] [PubMed] [Google Scholar]
- 15.Elias-Smale SE, Proença RV, Koller MT, et al. Coronary calcium score improves classification of coronary heart disease risk in the elderly: the Rotterdam study. J Am Coll Cardiol 2010;56:1407–1414 [DOI] [PubMed] [Google Scholar]
- 16.Agarwal S, Morgan T, Herrington DM, et al. Coronary calcium score and prediction of all-cause mortality in diabetes: the diabetes heart study. Diabetes Care 2011;34:1219–1224 [DOI] [PMC free article] [PubMed] [Google Scholar]
- 17.Pencina MJ, D'Agostino RB Sr, D'Agostino RB Jr, Vasan RS. Evaluating the added predictive ability of a new marker: from area under the ROC curve to reclassification and beyond. Stat Med 2008;27:157–172; discussion 207–212. [DOI] [PubMed]
- 18.Bowden DW, Cox AJ, Freedman BI, et al. Review of the Diabetes Heart Study (DHS) family of studies: a comprehensively examined sample for genetic and epidemiological studies of type 2 diabetes and its complications. Rev Diabet Stud 2010;7:188–201 [DOI] [PMC free article] [PubMed] [Google Scholar]
- 19.Friedewald WT, Levy RI, Fredrickson DS. Estimation of the concentration of low-density lipoprotein cholesterol in plasma, without use of the preparative ultracentrifuge. Clin Chem 1972;18:499–502 [PubMed] [Google Scholar]
- 20.Carr JJ, Crouse JR, 3rd, Goff DC, Jr, D’Agostino RB, Jr, Peterson NP, Burke GL. Evaluation of subsecond gated helical CT for quantification of coronary artery calcium and comparison with electron beam CT. AJR Am J Roentgenol 2000;174:915–921 [DOI] [PubMed] [Google Scholar]
- 21.Hanley JA, McNeil BJ. The meaning and use of the area under a receiver operating characteristic (ROC) curve. Radiology 1982;143:29–36 [DOI] [PubMed] [Google Scholar]
- 22.Greenland P, LaBree L, Azen SP, Doherty TM, Detrano RC. Coronary artery calcium score combined with Framingham score for risk prediction in asymptomatic individuals. JAMA 2004;291:210–215 [DOI] [PubMed] [Google Scholar]
- 23.LaMonte MJ, FitzGerald SJ, Church TS, et al. Coronary artery calcium score and coronary heart disease events in a large cohort of asymptomatic men and women. Am J Epidemiol 2005;162:421–429 [DOI] [PubMed] [Google Scholar]
- 24.Anand DV, Lim E, Hopkins D, et al. Risk stratification in uncomplicated type 2 diabetes: prospective evaluation of the combined use of coronary artery calcium imaging and selective myocardial perfusion scintigraphy. Eur Heart J 2006;27:713–721 [DOI] [PubMed] [Google Scholar]
- 25.Elkeles RS, Godsland IF, Feher MD, et al. PREDICT Study Group Coronary calcium measurement improves prediction of cardiovascular events in asymptomatic patients with type 2 diabetes: the PREDICT study. Eur Heart J 2008;29:2244–2251 [DOI] [PubMed] [Google Scholar]
- 26.Arad Y, Goodman KJ, Roth M, Newstein D, Guerci AD. Coronary calcification, coronary disease risk factors, C-reactive protein, and atherosclerotic cardiovascular disease events: the St. Francis Heart Study. J Am Coll Cardiol 2005;46:158–165 [DOI] [PubMed] [Google Scholar]
- 27.Wackers FJ, Young LH, Inzucchi SE, et al. Detection of Ischemia in Asymptomatic Diabetics Investigators Detection of silent myocardial ischemia in asymptomatic diabetic subjects: the DIAD study. Diabetes Care 2004;27:1954–1961 [DOI] [PubMed] [Google Scholar]
- 28.Thomas GS, Miyamoto MI, Morello AP, 3rd, et al. Technetium 99m sestamibi myocardial perfusion imaging predicts clinical outcome in the community outpatient setting. The Nuclear Utility in the Community (NUC) Study. J Am Coll Cardiol 2004;43:213–223 [DOI] [PubMed] [Google Scholar]
- 29.Kang X, Berman DS, Lewin H, et al. Comparative ability of myocardial perfusion single-photon emission computed tomography to detect coronary artery disease in patients with and without diabetes mellitus. Am Heart J 1999;137:949–957 [DOI] [PubMed] [Google Scholar]
Associated Data
This section collects any data citations, data availability statements, or supplementary materials included in this article.