

Abstract
Genome-wide ChIP-chip assays of protein–DNA interactions yield large volumes of data requiring effective statistical analysis to obtain reliable results. Successful analysis methods need to be tailored to platform specific characteristics such as probe density, genome coverage, and the nature of the controls. We describe the use of the respective software packages MAT and MA2C for the analysis of ChIP-chip data from one-color Affymetrix and two-color NimbleGen or Agilent tiling microarrays.
Keywords: ChIP-chip, probe modeling, normalization, peak detection
1. Introduction
The ChIP-chip experiment is an effective way of investigating protein–DNA interactions and chromatin structure in vivo. The technique was first applied successfully to identify binding sites of transcription factors in budding yeast (1-3) and later to small portions of mammalian genomes (4). High-density DNA oligonucleotide tiling arrays that map to all nonrepetitive genomic regions have enabled more comprehensive views of mammalian chromatin biology (5). We focus on the analysis of ChIP-chip data on two of the most commonly used tiling array platforms for ChIP-chip, Affymetrix and NimbleGen, emphasizing methods that have been broadly used and have been shown to be effective. MAT (6) is a freely available and open source software package that has been developed for the analysis of Affymetrix tiling array data and successfully applied to many important studies (7-9). MA2C (10) provides a convenient and effective analysis tool for two-color NimbleGen or Agilent tiling array data.
2. Affymetrix Platform/MAT Software
2.1. Affymetrix Tiling Array Analysis
Affymetrix tiling arrays offer the highest probe density and the shortest (25 bp) oligonucleotide probe sequence. Short oligonucleotide probes tend to display large effects that are associated with probe sequence, which need to be modeled when measuring the DNA concentration of interest. Accounting for hybridization effects, handling outlier probe signals, and grouping similar probes for normalization are the key considerations in the analysis of this data type.
2.2. MAT: Model-Based Analysis of Tiling Arrays
MAT (6) offers an accurate, robust, flexible, and comprehensible analysis of Affymetrix tiling array data. MAT analysis consists of four elements: probe intensity standardization based on a probe sequence model; MATscore calculation using sliding windows of probes along the genome; p-value and false discovery rate (FDR) calculations; annotation of significant regions according to whether they are significant in the genome. MAT was designed to allow for the analysis of data from a variety of experimental setups: a single ChIP sample without replicates or controls, a single ChIP with a single control, and replicate ChIP samples with replicate controls. The analysis of a single ChIP is useful when developing a ChIP-chip protocol or selecting an antibody. It generates useful data and valuable information at a minimal cost. However, controls and replicates are important to reduce the number of false positives and may be required to generate high-quality data for publication.
2.3. Probe Intensity Standardization
In most ChIP-chip experiments the vast majority of probes register signal from genomic DNA that is not enriched in the ChIP experiment. To adjust for probe sequence-associated intensity effects, MAT uses a set of probes to estimate the parameters in a linear model using ordinary least squares regression. The model includes terms for each independent base at each position on the probe to account for the position-specific contribution of a base to the probe intensity. Probes with similar predicted intensities are grouped together in bins. As the variance in the intensity tends to increase with the intensity itself, MAT groups probes of similar sequence and standardizes each probe’s intensity based on its model-predicted intensity and its bin variance. This standardization approach achieves probe background subtraction and normalization in one step. MAT is separately applied for each array and allows for the comparison of intensities between probes on different arrays and between different probes on the same array. Although MAT is based on the assumption that most probes measure only background signal, MAT produces good results even in cases where ChIP-enriched probes occupy a substantial percentage of the array (~20% in some histone modification ChIP-chip experiments).
2.4. Genomic Region Scoring
On the Affymetrix tiling array platform individual probes tend to produce somewhat unreliable information on the concentration of the hybridization DNA cocktail. A substantial number of probes may be unresponsive, having very low or very high intensities regardless of the experiment. Accuracy and robustness is achieved by combining information from multiple probes. MAT calculates a MATscore which is a function of the intensity and the number of probes within a range of genomic sequence, the extent of which is user specified. The default window size in MAT is 600 bp (2 × Bandwidth), a range which is compatible with the sonication fragment size for many ChIP-chip experiments. Although this window size is user specified, only in rare circumstances can an adjustment of this parameter be expected to have a significant impact on an experimental result. The precise definition of MATscore depends on whether a control array set is included in the analysis. If no control group is included MATscore is the trimmed mean of the probe intensities within that window divided by the square root of the number of probes within the window. When a control set of arrays is included it is the MATscore difference between treatment and control arrays. The trimmed mean is a robust statistic that excludes outlier probe signals and is defined as the mean after discarding a proportion of the highest and lowest signal values, which is usually set around 10%.
2.5. p-Value Estimation
MAT uses an empirical strategy to estimate the p-value for any window. First, the distribution of MATscores for a set of non-overlapping windows is examined. This distribution tends to have a longer tail on the right which represents the ChIP-enriched sites. The null distribution is assumed to be symmetrical about the mode and is estimated using the MATscores to the left of the mode. A p-value for a sliding window is calculated from that window’s MATscore and the MATscore null distribution. Windows with p-values meeting a required significance level are merged if they overlap or are separated by less than a user-defined parameter MaxGap. MaxGap is often set to the same value as Bandwidth. Windows that contain few probes may be unreliable, so only windows containing more than the minimum number of probes (user parameter MinProbe, default value 10) are considered for peak calls.
2.6. FDR Estimation
MAT estimates a false discovery rate (FDR) that is the proportion of false positives within the set of significant regions. At each MATscore cutoff, there are often positive peaks above the cutoff, as well as “negative” peaks if the sign on the MATscores was to be reversed. When control samples are available, these “negative” peaks are simply regions where probes are higher in controls than in ChIP. As controls are not expected to give rise to biologically significant peaks, these “negative” peaks are considered false positives. The FDR is then simply the number of “negative” peaks divided by the number of positive peaks at each MATscore cutoff.
To define the set of regions that are to be called significant a user-specified cutoff needs to be set. This is done by specifying one of the parameters MATscore, p -value, or FDR. FDR is a good parameter to set as this is the most easily interpretable. When using a new antibody or protocol it is advisable to confirm the results of the ChIP-chip experiment using ChIP-PCR on sites with a range of p-values.
2.7. Downloading the Software
MAT is open source software and freely available for downloading at: http://chip.dfci.harvard.edu/~wli/MAT/
MAT is readily run on Linux-x86 and Mac OS X, and can run on other operating systems with some effort from the user. Instructions for installation are posted on the web site. Careful attention to the installation procedure and software requirements is necessary to ensure a smooth installation process. Sample data, including .cel files derived from a study of estrogen receptor binding on chromosomes 21 and 22 (11), are available from the MAT website.
In addition to the software, two files are required for the ChIP-chip analysis:
.bpmap library files which contain the sequence, array coordinate to genome location map, and genome copy number of each probe. The .bpmap files that may be downloaded from the MAT website are different from those available from Affymetrix. The probe sequences in the MAT .bpmap file have been remapped to the reference genome build and the number of exact matches to the genome has been recorded. Redundant mappings of probes to within the same 1 kb region of the genome have been filtered out.
A repeat-library file which contains the chromosome coordinates of RepeatMasker repeats, simple repeats, and segmental duplication.
2.8. Running MAT
The following steps are recommended for data organization to run MAT.
Create a new directory, chip, and three subdirectories: chip/cel, chip/library, and chip/work. chip/cel and chip/work must be user readable and writeable while chip/library needs to be user readable but not necessarily writable. This is a mere recommendation, the precise names and organization of files is at the user’s discretion.
Copy the raw data containing .cel files into the chip/cel directory. MAT requires all .cel files used in an analysis to be located in the same directory.
Copy the installation-provided sample .tag file to the chip/work directory, name the my_chip.tag, and edit the MAT parameters. Details about the .tag file content are described below.
-
Change directory to chip/work and run MAT from the command line
MAT my_chip.tag
2.9. Tag File Definition
The .tag file is a plain text file that can be generated in any text editor such as emacs, vi, or notepad. The file is split into sections by the tokens “[data]”, “[bpmap]”, “[cel]”, “[intensity analysis]”, and “[interval analysis]”. The “data” section specifies the names of the directories containing the .bpmap, .cel, and repeat library files. In this section the treatment and control groups are specified by a string of zeros and ones after the token “Group”. Ones stand for ChIP .cel files, i.e., .cel files containing data from an Chromatin ImmunoPrecipitation replicate, while zeros stand for input .cel file, i.e., .cel files containing control data. In the example (Fig. 12.1), Group = 1100 means that the first two .cel files specified in any line of the “[cel]” section contain ChIP data while the last two contain genomic input data. The parameter “Pair” defines the way in which input data is used as a control. When input and IP arrays are strictly matched, setting “Pair = 1” results in the normalized value for each input probe being subtracted from the matching probe in the IP array. In most situations it is recommended that “Pair” be left blank. In the “[bpmap]” section, the name of each .bpmap file to be used for each .cel file is specified. In the example the Affymetrix human chr21/22 tiling chip set consists of three chips “A”, “B”, and “C”. There is a separate .bpmap file specified for each chip in the set. The numbering system in the “[cel]” section needs to be consistent with that of the “[bpmap]” section. In the “[intensity analysis]” section the BandWidth parameter specifies the window size that is used to group probes that lie within a genomic region spanning twice the BandWidth. Regions that are separated from each other by a distance less than the MaxGap parameter are merged. MinProbe specifies the minimum number of probes requires for a region to be called enriched. The cutoffs defining significant regions are set in the “[interval analysis]” section. The user can set the cutoff by “Matscore”, “p-value”, or “FDR”. Only one of these should be specified.
Fig. 12.1.
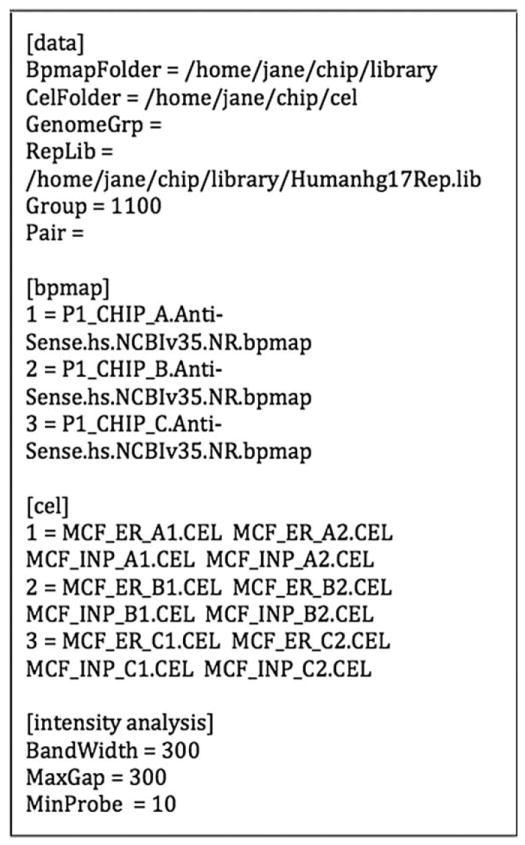
Example of a MAT .tag file.
2.10. Output Files
MAT-generated files will appear in the chip/work directory. MAT returns two types of output file: the .bar files which contain the MATscore for each probe which can be imported into the Affymetrix Integrated Genome Browser, IGB, for visualization, and a .bed file with the chromosomal coordinates of all the ChIP-regions with MATscore and repeat flags on the region labels which can be loaded into UCSC Genome Browser or IGB. Each row of the .bed file represents the chromosome start and end points, a label for a ChIP-enriched region, and a significance score, −10 log10(p-value). If more that 70% of a ChIP-enriched region is annotated as repetitive DNA through repeat masker, simple repeat (12) or segmental duplication (13) then “R_”, “R_Si”, or “R_SeN”, respectively are appended to the region label. The appendix for segmental duplication “R_SeN” indicates that there are N duplications of the region in the genome. Repetitive DNA and segmental duplications are non-unique in the genome and often show up as false-positive peaks, and are therefore of limited value in subsequent analyses of the ChIP-chip data. An extended version of the .bed file, a .bed.xls file contains the following information for each ChIP-region: chromosome, start, end, name, −10 log10(p-value), MATscore, fold change, FDR(%), peak position, length. The peak position is identified as the probe with the highest MATscore. From the FDR_table.txt one can get a sense of the relationship between the FDR, the number of negative and positive peaks, the MATscore, and p-value.
3. NimbleGen Platform/MA2C Software
3.1. NimbleGen Tiling Array Analysis
The NimbleGen platform allows customers to design arrays that cover targeted genomic regions with any desired probe density that is compatible with the size of the array. The standard ChIP-chip protocol in the NimbleGen system involves hybridizing ChIP and control samples on the same array using a two-color system. Probes in the NimbleGen system are typically 35–70 bp in length and like the Affymetrix system display considerable variability in hybridization properties.
3.2. MA2C: Model-Based Analysis of Two-Color Arrays
MA2C (10) is a Java-based software package for the robust analysis of two-color tiling array data provided in the NimbleGen format. There are three key ways in which MA2C, in its treatment of two-color arrays, differs from MAT. First, probe behavior on the NimbleGen platform can be described adequately using probe GC content instead of the more sophisticated MAT model. Second, MA2C applies its probe sequence model to correct for the correlation between Cy3 and Cy5 channels in addition to adjusting for the GC-dependent mean and variance of each probe. Finally, as NimbleGen probe densities are lower and probe qualities higher than the Affymetrix platform, alternative methods are provided to score regions.
3.3. Probe Intensity Standardization
MA2C bins probes based on the number of G and C residues within an oligonucleotide probe. The MA2C model assumes that the paired background log Cy3 and Cy5 intensities follow a bivariate normal distribution that is dependent on the GC content. This model takes into account the correlation between Cy3 and Cy5 readings that tends to increase with increasing GC count. For each GC bin, MA2C computes the mean and variance for Cy3 and Cy5 probes independently, and the correlation between paired Cy3 and Cy5 measurements. MA2C has an option to calculate these model parameters using a generalization of Tukey’s biweight estimation.
3.4. Genomic Region Scoring
The assignment of scores to regions, like MAT, is done using a series of windows of user-defined length, centered at each probe. A user-defined MA2Cscore may be defined as the median, pseudo-median, median polish, or trimmed mean of the probes in the window. The median and trimmed mean options are implemented by calculating the median or trimmed mean of all the probes in the window; when replicates are available, the median t-value or trimmed mean of all pooled probes in identical windows across replicates is used. The pseudo-median of a distribution is the median of all pairwise arithmetic means. Median polish is recommended for experiments with a large number of replicate samples, while trimmed mean is recommended for arrays with densely tiled probes. The pseudo-median and median provide robust alternatives that can be applied in experiments that are not densely tiled and have few available replicates.
3.5. FDR Estimation
The p-value and FDR estimation are carried out in MA2C using the same techniques as in MAT.
3.6. Downloading the Software
MA2C is open source software that runs on all platforms that support Java Runtime Environment 5.0 or higher and has been successfully tested on Linux-x86, Mac OS X, and Windows operating systems. MA2C can be downloaded for free from the following website together with installation instructions and user manual: http://liulab.dfci.harvard.edu/MA2C/MA2C.htm
3.7. Using MA2C
The file structure of NimbleGen data consists of three main components, DesignFiles/, PairData/, and SampleKey.txt, which should all reside in the same parent directory. The text file SampleKey.txt, an example of which is provided in Fig. 12.2, contains the relevant design information about individual arrays; in particular, the file must contain DESIGN_ID, CHIP_ID, and DYE for each array. The directory DesignFiles/ contains the sequence (.ndf) and position (.pos,) files corresponding to each DESIGN_ID, while PairData/ contains the single channel data for each CHIP_ID.
Fig. 12.2.
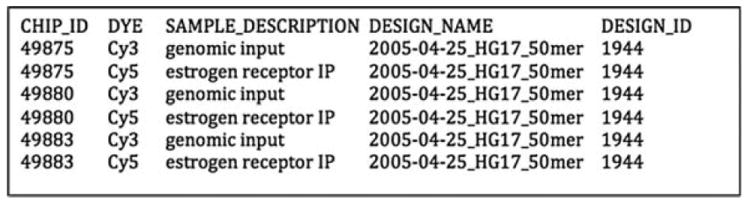
Example of a sample key file used by MA2C to specify treatment and control channels.
To start MA2C on a Windows platform, double-click on MA2C\dist\MA2C.bat. To launch the program in Linux, Unix, or on a Mac: change directory to MA2C/dist/ and execute the command: java -Xmx600m -jar MA2C.jar
To display the main interaction panel, click on the “run” button. Click on the “SampleKey” button to select a sample key file that either comes with a NimbleGen CD or is created by the user using a text editor. The entries in the sample key file are tab-delimited and must contain the CHIP ID, DESIGN ID, and DYE information corresponding to each experiment. Figure 12.2 provides an example of a sample key file involving three chips for each of which the Cy5 channel is the IP and the Cy3 the genomic input control.
If your data structure follows the pattern described above, MA2C will automatically look for sequence (.ndf, .pos) files and pair data (.txt) files and display the information on the GUI. If the sequence and pair data folder names do not follow the above convention, you can select the folders manually via the “Sequence” and “Pair Data” buttons. It is important that all data files in PairData/ have the .txt extension.
3.8. Normalization
In the SampleKey table, click Ctrl-left to select the ChIP DYE for each array to be normalized. Only the ChIP channel should be selected, as MA2C will automatically find and use the correct Input channel based on your selection of IP channel. In the example given in Fig. 12.3, to normalize all three data sets, one should select only the lines highlighted in grey. Choose a normalization method in the “Normalization” tab and click on the “Normalize” button to normalize the data. A .tpmap file will be generated in the sequence directory, and for each experiment, a _raw.txt and a _normalized.txt file will be created in the paired data directory. These files are used by MA2C but will not be of interest to the typical MA2C user. A new directory called MA2C_Output will be created in the same parent directory as SampleKey.txt.
Fig. 12.3.
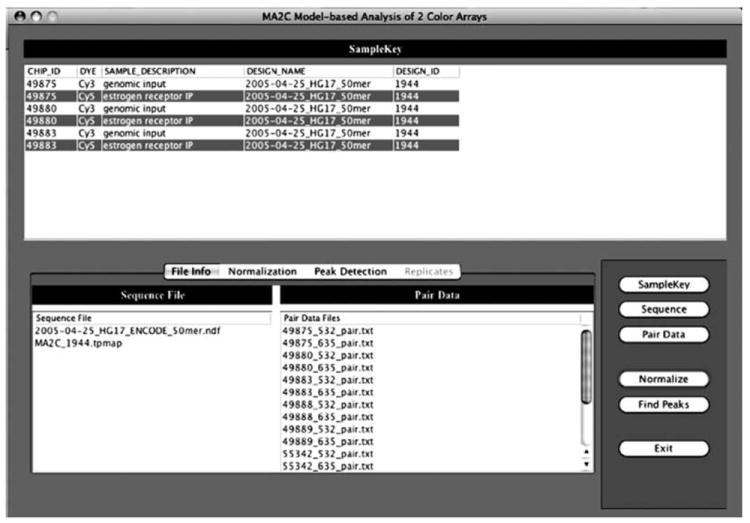
Selecting IP channels in MA2C.
3.9. Peak Detection
After normalization, check the “Peak Detection” tab for the available options that include the MA2C score statistic, the threshold statistic, the threshold value, and whether or not datasets are to be treated as replicates. Click the “Find Peaks” button to run the analysis. You do not need to renormalize the data each time you want to find peaks using different options. MA2C will generate the following files in the MA2C_Output directory: MA2C_dataset.bed, MA2C_dataset.xls, MA2C_dataset.pdf, MA2C_dataset_FDRtable.txt, MA2C_dataset.MA2Cscore. bar, and MA2C_dataset.ratio.bar, where dataset corresponds to a string of CHIP_IDs used to define the experiment. The .bar and .xls files contain the ChIP-enriched genomic regions. The .pdf files contain MA2C score, probe intensity ratios, and p-value histograms as well plots of the difference between the number of positive and negative peaks as a function of the FDR. The .FDRtable.txt allows the user to examine the relationship between the FDR, the number of negative and positive peaks, the MA2C score, and the p-value. The .bar files can be viewed in the Affymetrix Integrated Genome Browser. MA2C scores are contained in the .MA2Cscore.bar file and normalized probe ratios in the .ratio.bar file.
4. Conclusions
ChIP-chip data from tiling arrays can provide valuable biological insights if it is analyzed using robust statistical methods. MAT is a freely available, effective, software package for the analysis of Affymetrix tiling array data. MAT can be used to interpret data from a variety of experimental designs including a single ChIP with no replicates and no controls, a feature that is useful in the development of a ChIP-chip protocol and antibody selection. MA2C is a free, robust, analysis tool for NimbleGen two-color tiling array data that includes several diagnostic features for data quality assessment. Users need to join Google group to obtain a username and password for downloading, posting questions, and obtaining update emails.
References
- 1.Ren B, Robert F, Wyrick JJ, Aparicio O, Jennings EG, Simon I, Zeitlinger J, Schreiber J, Nannett N, Kanin E, Volkert TL, Wilson CJ, Bell SR, Young RA. Genome-wide location and function of DNA binding proteins. Science. 2000;290:2306–2309. doi: 10.1126/science.290.5500.2306. [DOI] [PubMed] [Google Scholar]
- 2.Iyer VR, Horak CE, Scafe CS, Botstein D, Snyder M, Brown PO. Genomic binding sites of the yeast cell-cycle transcription factors SBF and MBF. Nature. 2001;409:533–538. doi: 10.1038/35054095. [DOI] [PubMed] [Google Scholar]
- 3.Lieb JD, Liu X, Botstein D, Brown PO. Promoter-specific binding of Rap1 revealed by genome-wide maps of protein–DNA association. Nat Genet. 2001;208:327–334. doi: 10.1038/ng569. [DOI] [PubMed] [Google Scholar]
- 4.Horak CE, Mahajan MC, Luscombe NM, Gerstein M, Weissman SM, Snyder M. GATA-1 binding sites mapped in the β-globin locus by using mammalian ChIP-chip analysis. Proc Natl Acad Sci. 2002;99:2924–2929. doi: 10.1073/pnas.052706999. [DOI] [PMC free article] [PubMed] [Google Scholar]
- 5.Cawley S, Bekiranov S, Ng HH, Kapranov P, Sekinger EA, Kampa D, Piccolboni A, Sementchenko V, Cheng J, Williams AJ, Wheeler R, Wong B, Drenkow J, Yamanaka M, Patel S, Brubaker S, Tammana H, Helt G, Struhl K, Gingeras TR. Unbiased mapping of transcription factor binding sites along human chromosomes 21 and 22 points to widespread regulation of noncoding RNAs. Cell. 2004;116:499–509. doi: 10.1016/s0092-8674(04)00127-8. [DOI] [PubMed] [Google Scholar]
- 6.Johnson W, Li W, Meyer C, Gottardo R, Carroll J, Brown M, Liu X. Model-based analysis of tiling-arrays for ChIP-chip. Proc Nat Acad Sci USA. 2006;103:12457–12462. doi: 10.1073/pnas.0601180103. [DOI] [PMC free article] [PubMed] [Google Scholar]
- 7.Carroll JS, Liu XS, Brodsky AS, Li W, Meyer CA, Szary AJ, Eeckhoute J, Shao W, Hestermann EV, Geistlinger TR, Fox EA, Silver PA, Brown M. Chromosome-wide mapping of estrogen receptor binding reveals long-range regulation requiring the forkhead protein FoxA1. Cell. 2005;122:33–43. doi: 10.1016/j.cell.2005.05.008. [DOI] [PubMed] [Google Scholar]
- 8.Zheng Y, Josefowicz SZ, Kas A, Chu TT, Gavin MA, Rudensky AY. Genome-wide analysis of Foxp3 target genes in developing and mature regulatory T cells. Nature. 2007;445:936–940. doi: 10.1038/nature05563. [DOI] [PubMed] [Google Scholar]
- 9.Wendt KS, Yoshida K, Itoh T, Bando M, Koch B, Schirghuber E, Tsutsumi S, Nagae G, Ishihara K, Mishiro T, Yahata K, Imamoto F, Aburatani H, Nakao M, Imamoto N, Maeshima K, Shirahige K, Peters JM. Cohesin mediates transcriptional insulation by CCCTC-binding factor. Nature. 2008;451:796–801. doi: 10.1038/nature06634. [DOI] [PubMed] [Google Scholar]
- 10.Song JS, Johnson WE, Zhu X, Zhang X, Li W, Manrai AK, Liu JS, Chen R, Liu XS. Model-based analysis of two-color arrays (MA2C) Genome Biol. 2007;8 doi: 10.1186/gb-2007-8-8-r178. Article R178, http://genomebiology.com/2007/8/8/R178. [DOI] [PMC free article] [PubMed] [Google Scholar]
- 11.Carroll JS, Meyer CA, Song J, Li W, Geistlinger TR, Eeckhoute J, Brodsky AS, Keeton EK, Fertuck KC, Hall GF, Wang Q, Bekiranov S, Sementchenko V, Fox EA, Silver PA, Gingeras TR, Liu XS, Brown M. Genome-wide analysis of estrogen receptor binding sites. Nat Genet. 2006;38:1289–1297. doi: 10.1038/ng1901. [DOI] [PubMed] [Google Scholar]
- 12.Benson G. Tandem repeats finder: a program to analyze DNA sequences. Nucleic Acids Res. 1999;27:573–580. doi: 10.1093/nar/27.2.573. [DOI] [PMC free article] [PubMed] [Google Scholar]
- 13.Bailey JA, Yavor AM, Massa HF, Trask BJ, Eichler EE. Segmental duplications: organization and impact within the current human genome project assembly. Genome Res. 2001;11:1005–1017. doi: 10.1101/gr.187101. [DOI] [PMC free article] [PubMed] [Google Scholar]