

Abstract
We prospectively assessed the impact of a sterol regulatory element-binding factor-2 (SREBF-2) polymorphism on the risk of developing nonalcoholic fatty liver disease (NAFLD) and on liver histology and lipoprotein and glucose metabolism in biopsy-proven NAFLD. In a population-based study, we followed 175 nonobese, nondiabetic participants without NAFLD or metabolic syndrome at baseline, characterized for the SREBF-2 rs133291 C/T polymorphism, dietary habits, physical activity, adipokines, C-reactive protein (CRP), and endothelial adhesion molecules. A comparable cohort of NAFLD patients underwent liver biopsy, an oral glucose tolerance test with minimal model analysis to yield glucose homeostasis parameters, and an oral fat tolerance test with measurement of plasma lipoproteins, adipokines, and cytokeratin-18 fragments. After 7 years, 27% of subjects developed NAFLD and 5% developed diabetes. SREBF-2 predicted incident NAFLD and diabetes and CRP and endothelial adhesion molecule changes. In biopsy-proven NAFLD patients, SREBF-2 predicted nonalcoholic steatohepatitis (odds ratio 2.92 [95% CI 2.08–4.18], P = 0.002) and the severity of tissue insulin resistance, β-cell dysfunction, and oral fat intolerance (characterized by higher postprandial lipemia, cholesterol enrichment of triglyceride-rich lipoproteins and oxidized LDLs, HDL cholesterol fall, adipokine imbalance, and postprandial apoptosis activation). An SREBF-2 polymorphism predisposes individuals to NAFLD and associated cardiometabolic abnormalities and affects liver histology and glucose and lipid metabolism in biopsy-proven NAFLD.
Nonalcoholic fatty liver disease (NAFLD), the most common chronic liver disease, encompasses a histological spectrum, ranging from simple steatosis to steatosis plus necroinflammation (nonalcoholic steatohepatitis [NASH]), which can be differentiated only by liver biopsy. Although simple steatosis has a benign hepatological course, NASH can progress to end-stage liver disease and is projected to be the leading cause of liver transplantation by 2020 (1,2); furthermore, both histological subtypes confer an increased risk of type 2 diabetes mellitus (T2DM) and cardiovascular disease (CVD) independently of classical risk factors, through mechanisms potentially involving adipokine and lipoprotein dysregulation. The scant prospective data on factors predisposing individuals to NAFLD and associated cardiometabolic disorders connected baseline metabolic syndrome, insulin resistance/hyperinsulinemia, and weight gain to incident ultrasonographic NAFLD (3,4); however, not every insulin-resistant or obese subject develops NAFLD, suggesting that other genetic or environmental factors promote liver disease in insulin-resistant subjects. Among environmental factors, dietary fat excess has been extensively connected to NAFLD experimentally, although such evidence in humans remains controversial (5).
A genetic predisposition to NAFLD and NASH is indisputably present, although the exact pathway involved remains unclear. Altered cholesterol metabolism, resulting in hepatic cholesterol accumulation, has been recently linked to liver injury and NASH development in experimental and human NASH, independent of obesity (6–10). The sterol regulatory element-binding factor-2 (SREBF-2) gene codes for sterol regulatory element-binding protein-2 (SREBP-2), the master nuclear transcription factor that coordinately regulates genes involved in cellular cholesterol biosynthesis, uptake, and excretion (11). Hepatic SREBP-2 upregulation parallels the severity of liver disease in animal and human NAFLD (6–8, 10); SREBF-2 is therefore an ideal candidate for modulating the genetic susceptibility to NAFLD and NASH.
The functional single nucleotide polymorphism (SNP) rs133291 C/T in the SREBF-2 gene has been linked to serum LDL cholesterol (12), but there are no human data on the impact of this SNP on the risk of developing NAFLD and associated metabolic abnormalities.
We hypothesized that the SREBF-2 SNP may not only predispose individuals to NAFLD development but also affect the severity of liver disease and of NAFLD-associated glucose and lipid dysmetabolism. We aimed at 1) assessing the role of SREBF-2 on the risk of developing NAFLD in healthy subjects at baseline and 2) elucidating the impact of SREBF-2 on the severity of liver histology and on glucose and lipid homeostasis in biopsy-proven NAFLD.
RESEARCH DESIGN AND METHODS
Subjects.
Based on limited data on NAFLD incidence (4–6) and on SREBF-2 SNP prevalence (15), considering a type I error of 0.05 and a type II error of 0.20 and allowing for a 10% dropout rate, at least 162 subjects were needed at the end of the study to detect a significant difference in the prevalence of SREBF-2 SNP between NAFLD and control subjects.
Among 1,658 Caucasian participants in a metabolic survey in the province of Asti (northwestern Italy) in 2004–2005 (previously described) (13), 193 randomly selected subjects gave informed consent to be included in the study. At baseline, all were in good general health, with normal findings on medical history, physical examination, blood count, and chemical screening battery. Subjects with diabetes, obesity, metabolic syndrome, insulin resistance, CVD, significant alcohol consumption (as defined below), transaminase elevation, or known liver disease (as defined below) were excluded from the study, which was approved by the local ethics committee and conformed to the Helsinki Declaration.
Baseline data collected during the period 2004–2005 included measurements of weight, height, waist circumference, and blood pressure according to a uniform protocol, dietary and physical activity record (see below), and routine biochemistry. Frozen serum samples collected from all participants at entry were stored at −80°C for genetic and biochemical analyses. From January to December 2011, participants in the baseline survey were submitted to follow-up evaluation. All anthropometric, dietary, and physical activity records and biochemical analyses were repeated at the end of follow-up.
Definitions.
NAFLD was diagnosed by persistently (>6 months) elevated aminotransferases (defined by alanine aminotransferase ≥30 units/L in males and ≥20 units/L in females, according to recently proposed cutoffs that enhance sensitivity for steatosis detection) (14,15) and ultrasonographic diagnosis of steatosis based on standardized criteria (16).
Exclusion criteria included a history of alcohol consumption >20 g/day (males) and >10 g/day (females) as assessed by a detailed inquiry of patients and relatives and by a validated questionnaire filled in daily for 1 week by the patients, positive serum markers of viral hepatitis B or C, and other competing causes of hepatic steatosis (detailed in Supplementary Appendix). Diabetes was defined by a fasting plasma glucose (FPG) ≥126 mg/dL or 2-h plasma glucose ≥200 mg/dL during an oral glucose tolerance test (OGTT) or by drug treatment for elevated plasma glucose (17); obesity was defined by a BMI ≥30 kg. Insulin resistance was defined by a homeostasis model assessment of insulin resistance index ≥2, a cutoff closely correlating with clamp measures in northern Italian subjects and with OGTT-derived indices of insulin sensitivity in our subjects with NAFLD (18,19). Metabolic syndrome was defined according to the joint International Diabetes Federation/National Heart, Lung, and Blood Institute/American Heart Association/International Atherosclerosis Society/International Association for the Study of Obesity statement (20) (Table 1).
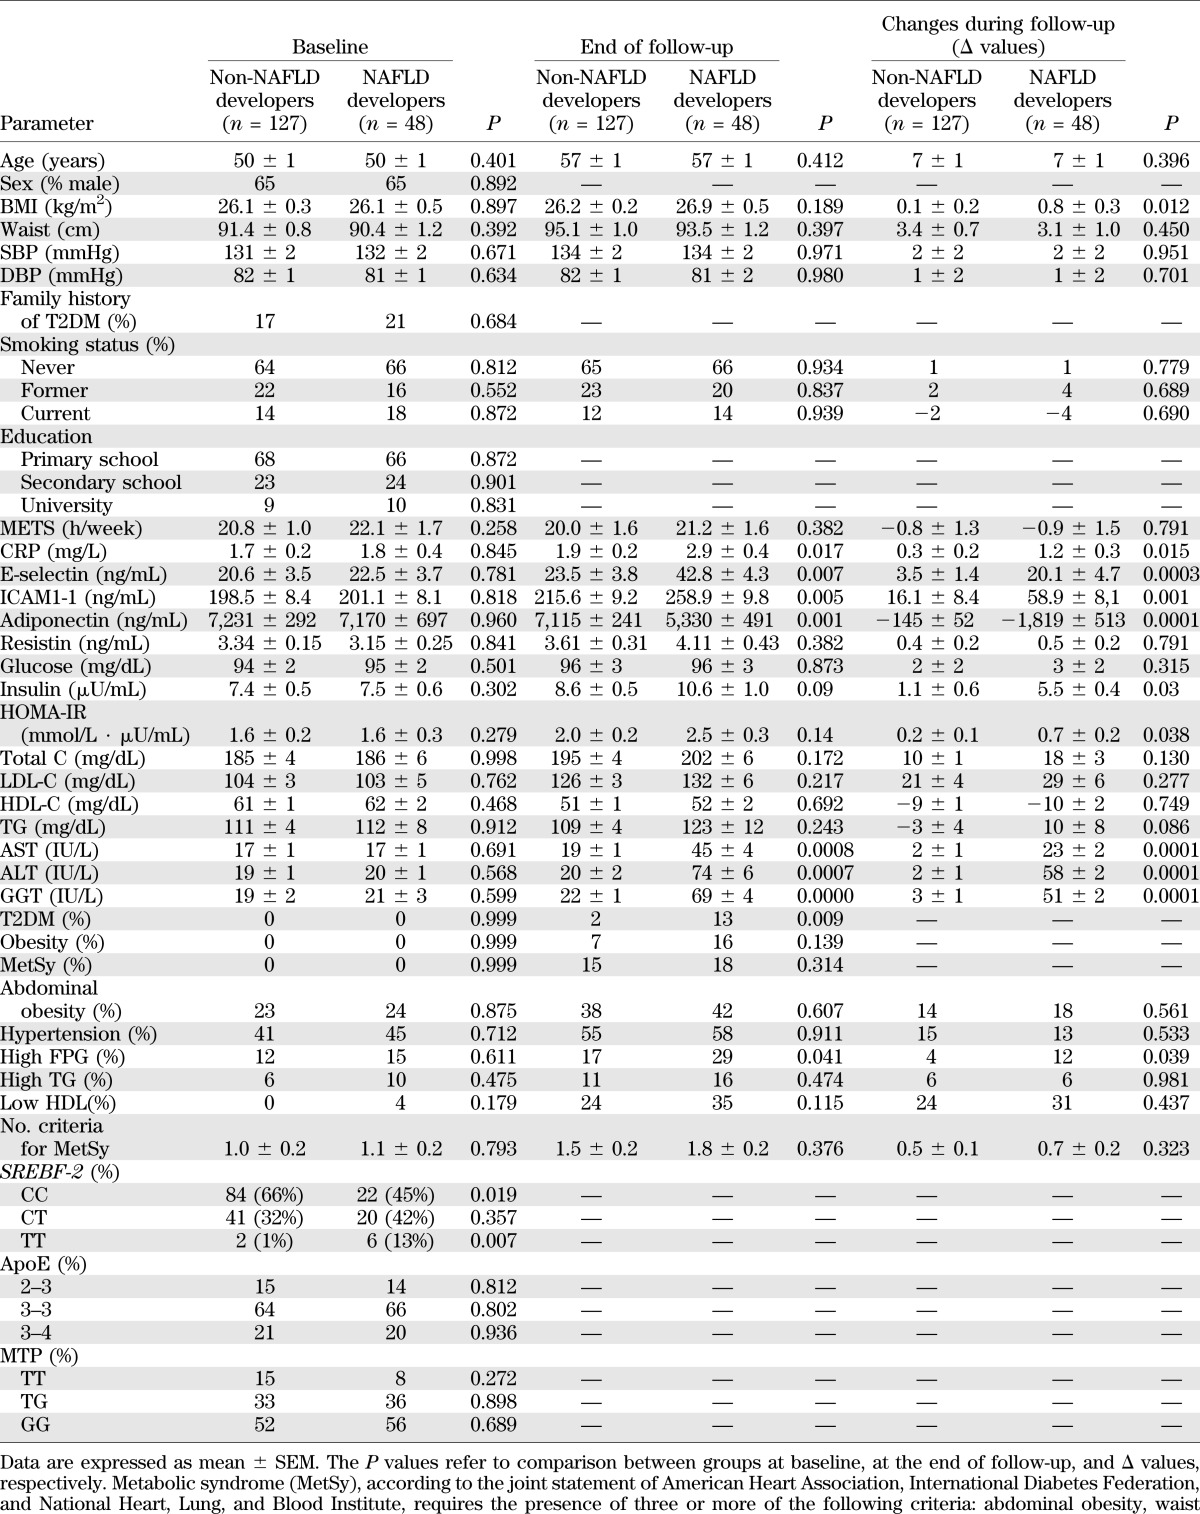
TABLE 1.
Baseline, end of follow-up, and changes during follow-up (Δ) values in main clinical and biochemical features of study subjects (n = 175), grouped according to the development (or not) of NAFLD at the end of follow-up
Dietary and physical activity record.
Subjects were instructed to fill in a 7-day validated diet record during an individual training session with a nutritionist; a list of foods was designed and different portion sizes were specified for each item according to the EPIC study (21,22). The recorded period included a complete week. The diet record was analyzed using the WinFood database (Medimatica, Teramo, Italy) according to the table of food consumption of the Italian National Institute of Nutrition and Food Composition Database for Epidemiological Study in Italy (23,24).
Patients were interviewed about smoking habits and alcohol consumption and they completed the Minnesota Leisure Time Physical Activity questionnaire (25). The physical activity level was calculated as the product of duration and frequency of each activity (in hours per week), weighed by an estimate of the metabolic equivalent of the activity, and summed for activities performed.
Proinflammatory markers and adipokines.
Serum C-reactive protein (CRP) was determined via a high-sensitivity latex agglutination method on a Hitachi 911 Analyzer (Sentinel Diagnostics, Milan, Italy). The kit had a minimum detection of <0.05 mg/L and a measurable concentration range up to 160 mg/L. The intra-assay and interassay variation coefficients of variation (CVs) were, respectively, 0.8–1.3 and 1.0–1.5%.
Serum adiponectin was measured by a sandwich ELISA (R&D Systems, Abingdon, U.K.); the kit has a sensitivity of 0.25 pg/mL in a 50-μL sample size and a range of 3.9–250 ng/mL. The intra- and interassay CVs were 3.4 and 5.8%, respectively. Resistin was measured by a biotin-labeled antibody- based sandwich enzyme immunoassay (BioVendor Laboratory Medicine, Brno, Czech Republic). The intra-assay and interassay CVs were, respectively, 2.8–3.4 and 5.5–6.8%.
Circulating markers of endothelial dysfunction.
The serum soluble adhesion molecules E-selectin and intercellular adhesion molecule-1 (ICAM-1) were measured as validated markers of endothelial dysfunction, subclinical atherosclerosis, and early cardiovascular risk (26). E-selectin and ICAM-1 levels were measured by a solid-phase ELISA (R&D Systems, Minneapolis, MN). Minimum detectable doses and intra- and interassay CVs were, respectively, <0.1 ng/mL, 4.7–5.0%, and 7.4–8.8%; 0.17–1.26 pg/mL, 2.3–3.6%, and 5.5–7.8%.
Genetic analyses.
The functional SNP rs133291 C/T in the intron region of the SREBF-2 gene was assessed by the real-time allele discrimination method, using TaqMan Allelic Discrimination Assay (Applied Biosystems, Foster City, CA). The −493 G/T microsomal triglyceride transfer protein (MTP) gene polymorphism and apolipoprotein E (apoE) genotype, affecting both lipid metabolism and the risk of NAFLD (27), were also assessed; −493 G/T MTP gene polymorphism was assessed by restriction fragment–length polymorphism PCR using a two-step nested PCR. The apoE genotype was determined by PCR amplification of genomic DNA using specific oligonucleotide primers.
Impact of SREBF-2 on liver histology in established NAFLD.
To investigate the impact of the SREBF-2 genotype on liver disease severity in NAFLD, a cohort of biopsy-proven NAFLD patients, comparable for age, sex and BMI to new-onset NAFLD patients, was selected. Each pathological feature was read and scored by a single pathologist (Ezio David, Human Pathology Service, University of Turin, Italy) blinded to the patient clinical-biochemical characteristics and scored according to the NASH Clinical Research Network criteria (28). NASH was defined according to Brunt criteria (29).
Impact of SREBF-2 on glucose homeostasis in established NAFLD.
Biopsy-proven NAFLD patients and an equal number of subjects without NAFLD (control subjects), matched for age, sex, BMI, and SREBF-2 genotype, underwent a standard OGTT. Minimal model analysis of plasma glucose, insulin, and C-peptide during the OGTT yielded the following parameters of glucose homeostasis.
Prehepatic insulin delivery was estimated as the suprabasal (Δ) 30-min area under the curve (AUC) of C-peptide divided by the 30-min increase in circulating glucose. The hepatic insulin extraction, as percentage of secreted hormone, was estimated by 1 – (AUC insulin/AUC C-pep).
Insulin sensitivity was estimated from a model of glucose clearance, which provides the oral glucose insulin sensitivity (OGIS), an index of whole-body insulin sensitivity. Muscle and hepatic insulin resistance indexes were calculated from OGTT as previously proposed and validated against clamp in nondiabetic subjects (30,31). The adipose tissue insulin resistance index was calculated as fasting free fatty acids (FFAs) × fasting insulin (32).
The following indexes of β-cell function were also calculated: the insulinogenic index (IGI), computed as the suprabasal serum insulin increment divided by the corresponding plasma glucose increment in the first 30 min (ΔI30/ΔG30), and the CP-genic index (CGI), computed as ΔC-pep30/ΔG30, previously validated against measures of β-cell functions derived from frequently sampled intravenous glucose tolerance test (33). Two integrated indexes of β-cell function, i.e., the disposition index (DI) and adaptation index (AI), were also calculated. DI and AI relate β-cell ability to adapt insulin secretion to changes in insulin sensitivity and represent integrated parameters of β-cell function. We and others previously validated DI and AI against frequently sampled intravenous glucose tolerance test minimal model parameters in NAFLD and nondiabetic subjects (34,35); these indexes also accurately predicted future T2DM in the general population (36).
Subjects with newly diagnosed diabetes were excluded, to avoid the confounding effect of T2DM on liver disease and on glucose metabolism.
Impact of SREBF-2 on dietary fat tolerance in biopsy-proven NAFLD.
As postprandial lipemia is a CVD risk factor potentially operating in NAFLD and lipotoxicity substantially contributes to NASH pathogenesis (1,9,37), biopsy-proven NAFLD patients and matched control subjects also underwent an oral fat tolerance test (OFTT). The fat load consisted of a mixture of dairy cream (35% fat) and egg yolk for a total energy content of 766 kcal. The total amount of fat was based on the subject's body surface area (78.3 g fat; 55.6% saturated fatty acids, 29.6% monounsaturated fatty acids, 4.2% polyunsaturated fatty acids, and 0.5 g cholesterol per m−2) (32). The fat load was consumed during a period of 5 min; subjects kept fasting on the test morning and strenuous activity was forbidden for 24 h before the test, since exercise can reduce postprandial lipemia. Blood samples were drawn every 2 h for 10 h, and the following parameters were assessed at each time point:
-
1)
Plasma total cholesterol, triglyceride (TG), HDL cholesterol (HDL-C), apoA1, and FFAs were measured by automated enzymatic methods.
-
2)
TG-rich lipoprotein (TRLP) subfractions were isolated through preparative ultracentrifugation, and their total TG and cholesterol contents were subsequently measured. One aliquot of plasma was brought to a density of 1,006 g/L by adding a KBr solution (d = 1,330 g/L) and centrifuging at 105,000g for 21 h at 10°C in a Beckman L8-70M ultracentrifuge. TG and total cholesterol concentrations were then determined in the lipoprotein fraction enzymatically. The first higher amount of blood (10 mL) was drawn for subfractionating TRLPs by ultracentrifugation on a discontinuous density gradient. Separated plasma was brought to a density of 1.10 g/mL by adding solid KBr. The density gradient was prepared by adding to 4 mL of this plasma 3 mL of a 1.065 g/mL solution containing 0.05% KBr/NaCl plus EDTA (pH 7.4), 3 mL of a similar solution at 1.020 g/mL, and 3 mL of physiological saline at 1.006 g/mL. The sample was ultracentrifuged in a Beckman L8-70M centrifuge at 20°C in stages, allowing the separation of two VLDL fractions with decreasing Sf values: VLDL1, Sf >100; VLDL 2, Sf = 20–100. The automated methods mentioned above were used to determine cholesterol and TGs in the two fractions.
VLDL apoB48 and apoB100 were separated by SDS-PAGE using 3.9% gel according to Battula et al. (38). Nondelipidated lipoprotein samples were reduced in SDS sample buffer for 4 min at 96°C. Samples were applied to the gel and run at 40 mA in 0.025 mol/L Tris, 0.192 mol/L glycine, and 0.1% SDS. Gel was stained with silver stain (Bio-Rad). Since the chromogenicity of apoB48 is similar to that of apoB100 (39), a protein standard was prepared from LDL isolated by sequential ultracentrifugation and used to quantify apoB100 and apoB48. The bands were quantified by densitometry using Gel Doc equipment (Bio-Rad). Density values were assigned to the apoB100 bands of the standard LDL and a standard curve was constructed. The values were recalculated by linear regression.
To isolate LDL, blood was centrifuged for 30 min at 2,500 rpm and at 4°C in a J6B centrifuge (Beckman Instruments, Palo Alto, CA), and the obtained plasma was brought to a density of 1.10 g/mL by the addition of solid KBr. The density gradient was prepared manually according to Redgrave and Carlson (40) by adding to 4 mL of this plasma 3 mL of a 1.065 g/mL solution containing 0.05% KBr/NaCl plus EDTA (pH 7.4), 3 mL of a similar solution at 1.020 g/mL, and 3 mL of physiological saline at 1.006 g/mL. The sample was ultracentrifuged in a SW4O rotor in a Beckman L8-70M centrifuge at 39,000 rpm for 18 h at 20°C to isolate LDL.
-
3)
LDL-conjugated dienes, validated markers of oxidized LDLs (oxLDLs), were determined as follows. Capillary electrophoresis was performed as described by Stocks and Miller (41). The cathode and anode electrolytes and the capillary run buffer were 40 mmol/L methylglucamine-Tricine, pH 9.0. LDL samples were injected by low pressure for 4 s. Dimethylformamide was injected as an electroendosmotic flow marker for 1 s. A voltage of 24 kV was applied, ramping over 0.8 min. Migration of LDL particle was monitored at 200 and 234 nm. The amount of conjugated dienes was obtained from the percentage of the height of LDL peak at 234 nm related to the height of LDL peak at 200 nm.
-
4)
Circulating adipokines (resistin and adiponectin) and cytokeratin-18 (CK-18) fragments (a validated marker of hepatocyte apoptosis) were determined (2). CK-18 fragments were measured with the M30-Apoptosense ELISA kit, a one-step in vitro immunoassay for the quantitative determination of the apoptosis-associated CK18Asp396 neo-epitope in serum (Peviva AB, Bromma, Sweden), with a sensitivity of 25 units/L in a 25-μL sample size and a range of 75–1,000 units/L. The intra- and interassay CVs are <8%.
Statistical analysis.
Participants with and without follow-up visits were compared with the determined appropriateness of an analysis based on participants with complete data only. Hardy-Weinberg equilibrium was assessed using χ2 test. Comparisons of genotype frequencies between NAFLD developers and non-NAFLD developers were performed using 2 × 2 contingency tables with χ2 analysis. Subjects with and without NAFLD at the end of the follow-up were compared for baseline values and for changes during follow-up (Δ values). Normality was evaluated by the Shapiro-Wilk test, and nonnormal values were log transformed for regression analysis. Fisher or χ2 test was used to compare categorical variables, as appropriate.
Differences across groups were analyzed by ANOVA and then by Bonferroni correction, when variables were normally distributed; otherwise the Kruskal-Wallis test, followed by the post hoc Dunn test, was used to compare nonparametric variables. To adjust for multiple comparison testing, the Benjamini-Hochberg false discovery rate correction was applied to raw P values. Significance was set at an adjusted P value threshold of 0.05 (42).
Analysis of lifestyle, anthropometric and metabolic parameters, and genetic polymorphisms was performed using the Spearman correlation test. Genetic polymorphisms were modeled as an additive effect, i.e., quantitative predictor variables reflecting the number of risk alleles (0, 1, or 2).
Based on the results of univariate analysis, a logistic regression model was used to identify independent predictors of incident NAFLD/NASH and incident T2DM and markers of subclinical atherosclerosis at the end of follow-up. Variables were selected from parameters that differed between NAFLD developers and non-NAFLD developers at baseline and during follow-up (Δ values). Quartiles of continuous variables were considered for this analysis.
The AUC and incremental AUC (IAUC) of parameters measured during the oral fat test and OGTT in patients with established NAFLD and control subjects were computed by the trapezoid method. Univariate and multiple regression analyses were used to identify independent predictors of glucose, lipid homeostasis parameters, and different histological features in biopsy-proven NAFLD. Data were expressed as mean ± SEM (STATISTICA software, version 5.1; Statsoft Italia, Padua, Italy).
RESULTS
After a mean follow-up period of 7.1 ± 0.3 years, data on 175 participants were available for the follow-up examinations. The 18 (9.3%) subjects lost at follow-up did not significantly differ in baseline anthropometric, lifestyle, clinical, or biochemical features from the other participants included in the analysis. At the end of follow-up, 27% subjects developed NAFLD.
Subject characteristics at baseline and at the end of follow-up.
SREBF-2 CC carriers were 66% in non-NAFLD developers vs. 45% in NAFLD developers (P = 0.029), heterozygous CT carriers were 32% in non-NAFLD developers vs. 42% in NAFLD developers (P = 0.328), and TT carriers were 1% in non-NAFLD developers vs. 13% in NAFLD developers (P = 0.010) (Table 1). The genotype frequencies were in Hardy-Weinberg equilibrium (P > 0.05 for all), and the allele frequencies were consistent with published reports in the Caucasian population.
At baseline, there was no significant difference in any other genetic, anthropometric, lifestyle, clinical, or biochemical feature between NAFLD developers and non-NAFLD developers (Table 1).
At the end of follow-up, NAFLD patients gained significantly more weight, became more insulin resistant, and had higher fasting plasma insulin and CRP and lower plasma adiponectin levels than non-NAFLD developers; 14 (29%) NAFLD patients vs. 20 (16%) non-NAFLD developers had elevated FPG (P = 0.041), and 6 (13%) NAFLD patients vs. 2 (2%) non-NAFLD developers had T2DM (P = 0.010) (Table 1). There was no significant difference in any other anthropometric, clinical, or biochemical feature between NAFLD developers and non-NAFLD developers during follow-up. Physical activity and dietary habits did not change during follow-up (Table 1 and Supplementary Tables 1 and 2).
Liver biopsy, performed in a cohort of 40 NAFLD patients comparable to the whole NAFLD cohort, demonstrated NASH in 19 (48%) subjects (details on single histological features are reported in the Supplementary Appendix).
Predictors of incident NAFLD.
Incident NAFLD was independently predicted by SREBF-2 SNP (odds ratio 2.01 [95% CI 1.47–3.31], P = 0.009) and by Δ-BMI (1.21 [1.08–2.47], P = 0.028).
Predictors of incident T2DM and markers of subclinical atherosclerosis at the end of follow-up.
Incident T2DM was predicted by SREBF-2 SNP (odds ratio 1.91 [95% CI 1.16–3.98], P = 0.011) and Δ-BMI (1.20 [1.05–2.71], P = 0.040). SREBF-2 also predicted the upper serum CRP (2.52 [1.76–3.38], P = 0.008), E-selectin (1.62 [1.12–3.80], P = 0.010), and ICAM-1 (1.57 [1.15–3.92], P = 0.019) quartiles at the end of follow-up.
Impact of SREBF-2 SNPs on liver histology, glucose homeostasis, and oral fat tolerance in biopsy-proven NAFLD patients and matched control subjects.
To assess the relationship of SREBF-2 to liver disease and glucose and lipid homeostasis, biopsy-proven NAFLD patients and control subjects were grouped according to SREBF-2 genotypes. Due to the low prevalence of SREBF-2 TT carriers and to the overlapping clinical characteristics with heterozygous carriers, they were combined with the heterozygote genotype.
Liver histology.
In biopsy-proven NAFLD patients, CT/TT carriers showed a more severe histological steatosis, necroinflammation, NAS score, and fibrosis score and a higher prevalence of NASH (80 vs. 15%, P = 0.0002) than the CC genotype (Supplementary Table 2). The presence of NASH was independently predicted by SREBF-2 SNP (OR 2.92 [95% CI 2.08–4.18]; P = 0.002).
In both NAFLD patients and control subjects, SREBF-2 CT/TT allele carriers had higher fasting insulin, CRP, E-selectin, and ICAM-1 than the CC genotype, but they did not differ in any other clinical, biochemical, or dietary features.
Glucose homeostasis.
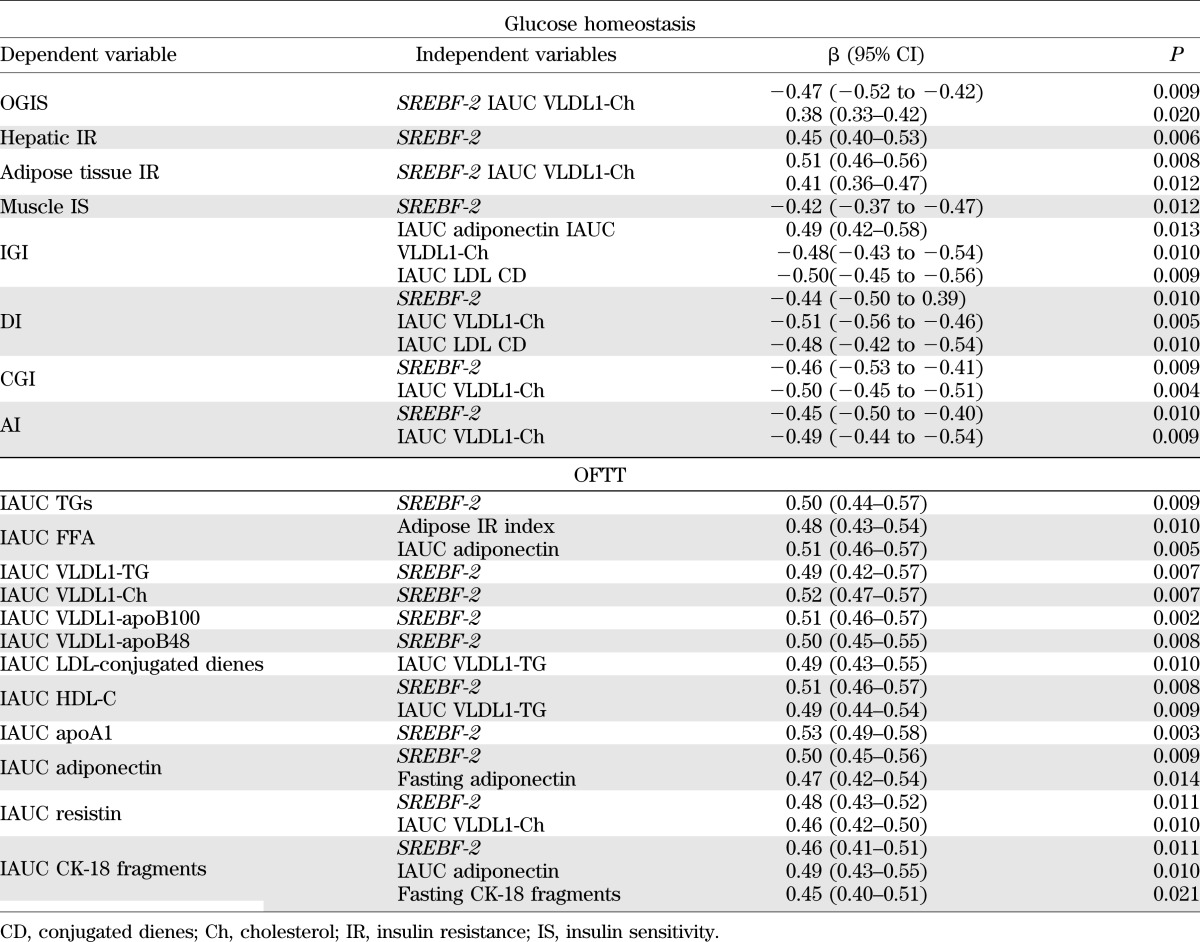
In both NAFLD patients and control subjects, SREBF-2 CT/TT carriers displayed more severe hepatic, muscle, and adipose tissue insulin resistance and pancreatic β-cell dysfunction than CC carriers (Table 2). SREBF-2 SNP independently predicted insulin resistance in different tissues and pancreatic β-cell dysfunction (Table 4).
TABLE 2.
OGTT-derived indexes of glucose homeostasis in patients with biopsy-proven NAFLD and control subjects, grouped according to SREBF-2 genotype
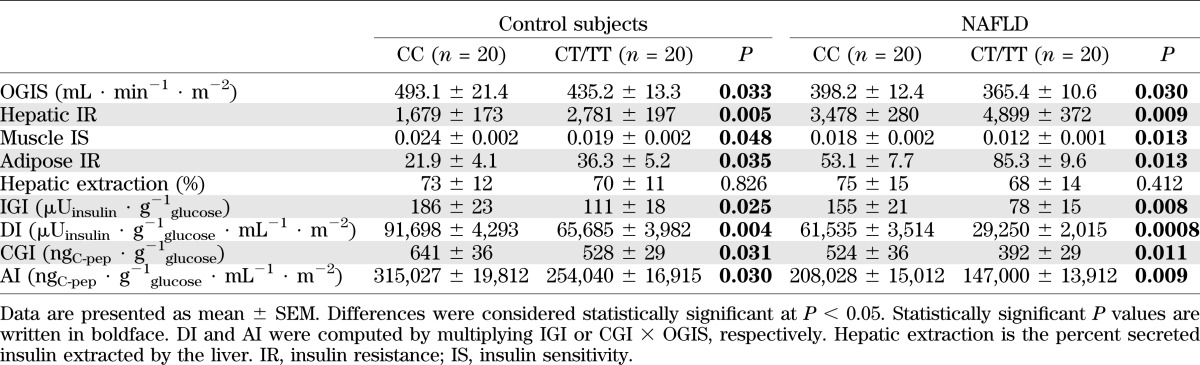
TABLE 4.
Multiple regression analysis: statistically significant predictors of parameters related to glucose and lipid metabolism in biopsy-proven NAFLD subjects and matched control subjects (n = 80)
OFTT.
After fat ingestion, CT/TT carriers showed higher postprandial lipemia (accounted for by a higher level of large TRLPs of both intestinal and hepatic origin) and FFA and oxLDL elevation than CC carriers; CT/TT carriers also had a marked postprandial increase in the cholesterol content of large TRLPs, coupled with a deeper HDL-C and apoA1 fall, a postprandial adipokine imbalance, characterized by lower adiponectin and higher resistin levels, and higher circulating CK-18 fragments (Table 3 and Figs. 1 and 2).
TABLE 3.
Oral fat load parameters in patients with biopsy-proven NAFLD and control subjects grouped according to SREBF-2 genotype
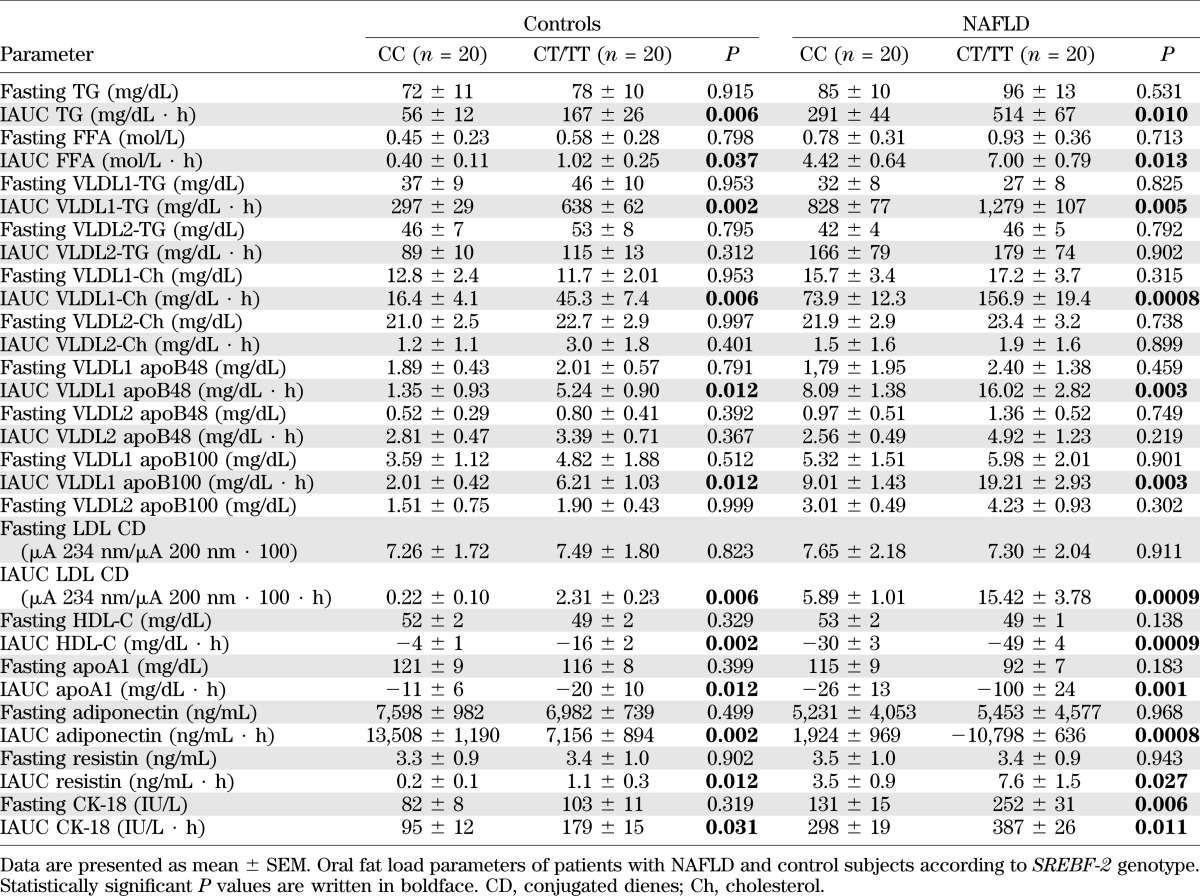
FIG. 1.


OFTT. Postprandial responses in plasma triglycerides, FFAs, VLDL1 cholesterol (VLDL1-Chol), VLDL2-Chol, LDL-conjugated dienes, and HDL-C. Data are presented as mean ± SEM.
FIG. 2.

OFTT. Postprandial responses in serum adiponectin, resistin, and CK-18 fragments. Data are presented as mean ± SEM.
SREBF-2 independently predicted the TG and cholesterol increases in TRLPs, the fall in HDL-C and apoA1 levels, and adipokine and CK-18 fragment responses postprandially (Table 4).
DISCUSSION
The main findings of this study are as follows: 1) SREBF-2 SNPs predicted 7-year incidence of NAFLD in nonobese, nondiabetic patients without metabolic syndrome at baseline. SREBF-2 also predicted incident T2DM and changes in markers of endothelial dysfunction at the end of follow-up. 2) In biopsy-proven NAFLD, SREBF-2 predicted the presence of NASH and extensively affected tissue insulin sensitivity, pancreatic β-cell function, and lipoprotein and adipokine responses to fat ingestion.
Data from cellular and human models and recent cross-sectional human studies suggested that altered cholesterol metabolism may be central for NAFLD development, with the magnitude of hepatic cholesterol overload paralleling liver disease severity (6–10); these studies demonstrated that NAFLD is characterized by increased hepatic cholesterol synthesis and uptake and reduced cholesterol excretion, favoring hepatic cholesterol accumulation, mitochondrial oxidative injury, and endoplasmic reticulum stress, which eventually leads to steatosis, hepatocyte apoptosis, inflammation, and NASH (6–10,43–46). Another set of experiments connected adipocyte cholesterol dysregulation to adipose tissue dysfunction, a key feature of obesity-associated disorders, including NAFLD (43,44).
The nuclear transcription factor SREBP-2 is a key regulator of cellular cholesterol homeostasis; its activation promotes hepatocyte cholesterol accumulation by coordinately activating cholesterol biosynthesis and uptake and repressing cholesterol excretion (6–10). Cross-sectional human studies found an increased hepatic expression of SREBP-2 and of its target genes, with the degree of SREBP-2 activation paralleling the severity of hepatic cholesterol overload and liver histology (8–10). However, to date, it was unclear whether increased SREBP-2 activation might be causally related to NAFLD or rather the consequence of obesity-associated hyperinsulinemia and chronic low-grade inflammation, which are almost universal in NAFLD and upregulate SREBP-2 expression (6,7). Our data point to a crucial role of genetically determined SREBP-2 activation, which may predispose initially lean, insulin-sensitive subjects to NAFLD development and may extensively modulate liver injury and glucose and lipid metabolism in established NAFLD. We also expanded the knowledge of the mechanisms linking SREBP-2 activation to liver and cardiometabolic disease, as the SREBF-2 polymorphism extensively modulated tissue insulin sensitivity, pancreatic β-cell function, and dietary fat tolerance. Adipose tissue dysfunction, in particular, is characterized by a resistance to the antilipolytic action of insulin and by a proinflammatory pattern of adipokine secretion, resulting in increased circulating levels of lipotoxic FFA and proinflammatory adipokines, and is emerging as a key determinant of liver disease and associated cardiometabolic abnormalities in NAFLD (32,45,46). Experimental data demonstrated that inappropriate SREBP-2 activation promotes adipocyte cholesterol overload and cholesterol-induced adipose tissue dysfunction, which were reversed by unloading adipocytes of cholesterol (43,44). Consistent with these findings, we connected a genetic variant in SREBF-2 expression with adipose tissue insulin resistance and a proinflammatory pattern of adipokine secretion. We also disclosed a novel mechanism whereby SREBF-2 promotes ectopic cholesterol accumulation after fat ingestion, i.e., an enhanced postprandial lipoprotein-mediated cholesterol delivery to peripheral tissues coupled with an impaired reverse cholesterol transport; despite comparable values in fasting conditions, SREBF-2 CT/TT carriers in fact showed an increased cholesterol content in large TRLPs and oxLDLs and a fall in HDL-C and apoA1 levels, the latter being responsible for reverse cholesterol transport. Besides promoting adipose tissue dysfunction, increased SREBP-2 expression can also contribute to increased cardiovascular risk in NAFLD, as suggested by the independent relationship between SREBF-2 and changes in CRP and endothelial adhesion molecules. Underlying mechanisms must be elucidated by future studies, but increased postprandial lipemia and postprandial dysregulation of lipoprotein-mediated cholesterol fluxes may play a role.
Finally, SREBF-2 may also affect the increased risk of T2DM in NAFLD by affecting both tissue insulin resistance and pancreatic β-cell function (47), an effect at least in part mediated by postprandial cholesterol-rich TRLP and oxLDL accumulation (Table 4).
Collectively, our findings suggest that the SREBF-2 SNP extensively affects liver disease and glucose and lipid metabolism in NAFLD, and could also explain the apparent discrepancy between animal studies, where a high-fat/high-cholesterol diet constantly promotes NASH, and human data, which variably found an excessive dietary fat and cholesterol intake in NAFLD patients (5). According to our model, the SREBF-2 polymorphism would enhance susceptibility to the lipotoxic effects of dietary cholesterol even in the absence of excessive dietary intakes.
In conclusion, we showed that a polymorphism in the SREBF-2 gene, coding for nuclear transcription factor SREBP-2, predicts NAFLD incidence and the severity of liver disease and the associated glucose and lipid dysmetabolism. Present findings may have important clinical and research implications. First, the SREBF-2 SNP may help in selecting NAFLD patients at higher risk of progressive liver disease and cardiometabolic complications for tight monitoring and experimental treatments. Second, interventions that reduce cellular cholesterol overload may ameliorate liver disease in NAFLD, regardless of coexisting hypercholesterolemia, as suggested by preliminary human trials with statins and ezetimibe, known inhibitors of cholesterol synthesis and absorption, respectively (48–50). Lastly, future research should assess whether a genetically determined, SREBF-2–mediated maladaptive response to a chronic, daily, repetitive stimulus like fat ingestion may link chronic overfeeding to NAFLD development and whether strategies targeting SREBF-2 expression, including antisense nucleotides, may improve liver and cardiometabolic disease in NAFLD patients more effectively than selective modulation of individual steps in cholesterol metabolism. The strengths of our study are the careful selection and thorough characterization of participants and the histological characterization of NAFLD. A limitation is the small number of patients, which mandates the confirmation of our findings in larger cohorts.
Supplementary Material
ACKNOWLEDGMENTS
This work was funded in part by the Piedmont Region Funds Comitato Interministeriale per la Programmazione Economica 2008.
No potential conflicts of interest relevant to this article were reported.
G.M. conceived and designed the study, analyzed the results, drafted the manuscript, and provided final approval. M.C., S.B., F.D.M., and R.G. acquired data, critically analyzed the results, contributed to the draft of the manuscript, and provided final approval. G.M. is the guarantor of this work and, as such, had full access to all the data in the study and takes responsibility for the integrity of the data and the accuracy of the data analysis.
Footnotes
This article contains Supplementary Data online at http://diabetes.diabetesjournals.org/lookup/suppl/doi:10.2337/db12-0858/-/DC1.
REFERENCES
- 1.Chalasani N, Younossi Z, Lavine JE, et al. The diagnosis and management of non-alcoholic fatty liver disease: practice guideline by the American Association for the Study of Liver Diseases, American College of Gastroenterology, and the American Gastroenterological Association. Hepatology 2012;55:2005–2023 [DOI] [PubMed] [Google Scholar]
- 2.Musso G, Gambino R, Cassader M, Pagano G. Meta-analysis: natural history of non-alcoholic fatty liver disease (NAFLD) and diagnostic accuracy of non-invasive tests for liver disease severity. Ann Med 2011;43:617–649 [DOI] [PubMed] [Google Scholar]
- 3.Hamaguchi M, Kojima T, Takeda N, et al. The metabolic syndrome as a predictor of nonalcoholic fatty liver disease. Ann Intern Med 2005;143:722–728 [DOI] [PubMed] [Google Scholar]
- 4.Rhee EJ, Lee WY, Cho YK, Kim BI, Sung KC. Hyperinsulinemia and the development of nonalcoholic fatty liver disease in nondiabetic adults. Am J Med 2011;124:69–76 [DOI] [PubMed] [Google Scholar]
- 5.Yki-Järvinen H. Nutritional modulation of nonalcoholic fatty liver disease and insulin resistance: human data. Curr Opin Clin Nutr Metab Care 2010;13:709–714 [DOI] [PubMed] [Google Scholar]
- 6.Zhao L, Chen Y, Tang R, et al. Inflammatory stress exacerbates hepatic cholesterol accumulation via increasing cholesterol uptake and de novo synthesis. J Gastroenterol Hepatol 2011;26:875–883 [DOI] [PubMed] [Google Scholar]
- 7.Van Rooyen DM, Larter CZ, Haigh WG, et al. Hepatic free cholesterol accumulates in obese, diabetic mice and causes nonalcoholic steatohepatitis. Gastroenterology 2011;141:1393–1403, 1403, e1–e5 [DOI] [PMC free article] [PubMed] [Google Scholar]
- 8.Min HK, Kapoor A, Fuchs M, et al. Increased hepatic synthesis and dysregulation of cholesterol metabolism is associated with the severity of nonalcoholic fatty liver disease. Cell Metab 2012;15:665–674 [DOI] [PMC free article] [PubMed] [Google Scholar]
- 9.Puri P, Baillie RA, Wiest MM, et al. A lipidomic analysis of nonalcoholic fatty liver disease. Hepatology 2007;46:1081–1090 [DOI] [PubMed] [Google Scholar]
- 10.Caballero F, Fernández A, De Lacy AM, Fernández-Checa JC, Caballería J, García-Ruiz C. Enhanced free cholesterol, SREBP-2 and StAR expression in human NASH. J Hepatol 2009;50:789–796 [DOI] [PubMed] [Google Scholar]
- 11.Musso G, Gambino R, Cassader M. Cholesterol metabolism and the pathogenesis of non-alcoholic steatohepatitis. Prog Lipid Res. In press. doi: 10.1016/j.plipres.2012.11.002. [DOI] [PubMed] [Google Scholar]
- 12.Miljkovic I, Yerges-Armstrong LM, Kuller LH, et al. Association analysis of 33 lipoprotein candidate genes in multi-generational families of African ancestry. J Lipid Res 2010;51:1823–1831 [DOI] [PMC free article] [PubMed] [Google Scholar]
- 13.Gambino R, Bo S, Gentile L, et al. Transcription factor 7-like 2 (TCF7L2) polymorphism and hyperglycemia in an adult Italian population-based cohort. Diabetes Care. 2010;33:1233–1235 [DOI] [PMC free article] [PubMed] [Google Scholar]
- 14.Prati D, Taioli E, Zanella A, et al. Updated definitions ranges for serum alanine aminotransferase levels. Ann Intern Med 2002;137:1–9 [DOI] [PubMed] [Google Scholar]
- 15.Chang Y, Ryu S, Sung E, Jang Y. Higher concentrations of alanine aminotransferase within the reference interval predict nonalcoholic fatty liver disease. Clin Chem 2007;53:686–692 [DOI] [PubMed] [Google Scholar]
- 16.Hernaez R, Lazo M, Bonekamp S, et al. Diagnostic accuracy and reliability of ultrasonography for the detection of fatty liver: a meta-analysis. Hepatology 2011;54:1082–1090 [DOI] [PMC free article] [PubMed] [Google Scholar]
- 17.American Diabetes Association Diagnosis and classification of diabetes mellitus. Diabetes Care 2011;34:S70–S7421193629 [Google Scholar]
- 18.Bonora E, Targher G, Alberiche M, et al. Homeostasis model assessment closely mirrors the glucose clamp technique in the assessment of insulin sensitivity: studies in subjects with various degrees of glucose tolerance and insulin sensitivity. Diabetes Care 2000;23:57–63 [DOI] [PubMed] [Google Scholar]
- 19.Musso G, Gambino R, Bo S, et al. Should nonalcoholic fatty liver disease be included in the definition of metabolic syndrome? A cross-sectional comparison with Adult Treatment Panel III criteria in nonobese nondiabetic subjects. Diabetes Care 2008;31:562–568 [DOI] [PubMed] [Google Scholar]
- 20.Alberti KG, Eckel RH, Grundy SM, et al.; International Diabetes Federation Task Force on Epidemiology and Prevention. Hational Heart, Lung, and Blood Institute. American Heart Association. World Heart Federation. International Atherosclerosis Society. International Association for the Study of Obesity Harmonizing the metabolic syndrome: a joint interim statement of the International Diabetes Federation Task Force on Epidemiology and Prevention; National Heart, Lung, and Blood Institute; American Heart Association; World Heart Federation; International Atherosclerosis Society; and International Association for the Study of Obesity. Circulation 2009;120:1640–1645 [DOI] [PubMed] [Google Scholar]
- 21.Pisani P, Faggiano F, Krogh V, Palli D, Vineis P, Berrino F. Relative validity and reproducibility of a food frequency dietary questionnaire for use in the Italian EPIC centres. Int J Epidemiol 1997;26(Suppl. 1):S152–S160 [DOI] [PubMed] [Google Scholar]
- 22.Sacerdote C, Fiorini L, Dalmasso M. Dietary habits and risk of cancer. Results of a survey on 10054 healthy residents in the Turin area. Torino: AGAT 2000 [in Italian] [Google Scholar]
- 23.Carnovale E, Marletta P. Food Composition Table Milan, Istituto Nazionale della Nutrizione, EDRA, 1997
- 24.Salvini S, Parpinel M, Gnagnarella P. Food composition database for epidemiological studies in Italy. European Oncology Institute, 1988 [in Italian] [Google Scholar]
- 25.Taylor HL, Jacobs DR, Jr, Schucker B, Knudsen J, Leon AS, Debacker G. A questionnaire for the assessment of leisure time physical activities. J Chronic Dis 1978;31:741–755 [DOI] [PubMed] [Google Scholar]
- 26.Ridker PM, Hennekens CH, Roitman-Johnson B, Stampfer MJ, Allen J. Plasma concentration of soluble intercellular adhesion molecule 1 and risks of future myocardial infarction in apparently healthy men. Lancet 1998;351:88–92 [DOI] [PubMed] [Google Scholar]
- 27.Anstee QM, Daly AK, Day CP. Genetics of alcoholic and nonalcoholic fatty liver disease. Semin Liver Dis 2011;31:128–146 [DOI] [PubMed] [Google Scholar]
- 28.Kleiner DE, Brunt EM, Van Natta M, et al. Nonalcoholic Steatohepatitis Clinical Research Network Design and validation of a histological scoring system for nonalcoholic fatty liver disease. Hepatology 2005;41:1313–1321 [DOI] [PubMed] [Google Scholar]
- 29.Brunt EM. Nonalcoholic steatohepatitis: definition and pathology. Semin Liver Dis 2001;21:3–16 [DOI] [PubMed] [Google Scholar]
- 30.Mari A, Pacini G, Murphy E, Ludvik B, Nolan JJ. A model-based method for assessing insulin sensitivity from the oral glucose tolerance test. Diabetes Care 2001;24:539–548 [DOI] [PubMed] [Google Scholar]
- 31.Abdul-Ghani MA, Matsuda M, Balas B, DeFronzo RA. Muscle and liver insulin resistance indexes derived from the oral glucose tolerance test. Diabetes Care 2007;30:89–94 [DOI] [PubMed] [Google Scholar]
- 32.Musso G, Cassader M, De Michieli F, Rosina F, Orlandi F, Gambino R. Nonalcoholic steatohepatitis versus steatosis: adipose tissue insulin resistance and dysfunctional response to fat ingestion predict liver injury and altered glucose and lipoprotein metabolism. Hepatology 2012;56:933–942 [DOI] [PubMed] [Google Scholar]
- 33.Tura A, Kautzky-Willer A, Pacini G. Insulinogenic indices from insulin and C-peptide: comparison of beta-cell function from OGTT and IVGTT. Diabetes Res Clin Pract 2006;72:298–301 [DOI] [PubMed] [Google Scholar]
- 34.Cobelli C, Toffolo GM, Dalla Man C, et al. Assessment of beta-cell function in humans, simultaneously with insulin sensitivity and hepatic extraction, from intravenous and oral glucose tests. Am J Physiol Endocrinol Metab 2007;293:E1–E15 [DOI] [PubMed] [Google Scholar]
- 35.Musso G, Gambino R, Cassader M. Lipoprotein metabolism mediates the association of MTP polymorphism with beta-cell dysfunction in healthy subjects and in nondiabetic normolipidemic patients with nonalcoholic steatohepatitis. J Nutr Biochem 2010;21:834–840 [DOI] [PubMed] [Google Scholar]
- 36.Abdul-Ghani MA, Williams K, DeFronzo RA, Stern M. What is the best predictor of future type 2 diabetes? Diabetes Care 2007;30:1544–1548 [DOI] [PubMed] [Google Scholar]
- 37.O’Keefe JH, Bell DS. Postprandial hyperglycemia/hyperlipidemia (postprandial dysmetabolism) is a cardiovascular risk factor. Am J Cardiol 2007;100:899–904 [DOI] [PubMed] [Google Scholar]
- 38.Battula SB, Fitzsimons O, Moreno S, et al. Postprandial apolipoprotein B48- and B100-containing lipoproteins in type 2 diabetes: do statins have a specific effect on triglyceride metabolism? Metabolism 2000;49:1049–1054 [DOI] [PubMed] [Google Scholar]
- 39.Karpe F, Hamsten A. Determination of apolipoproteins B-48 and B-100 in triglyceride-rich lipoproteins by analytical SDS-PAGE. J Lipid Res 1994;35:1311–1317 [PubMed] [Google Scholar]
- 40.Redgrave TG, Carlson LA. Changes in plasma very low density and low density lipoprotein content, composition, and size after a fatty meal in normo- and hypertriglyceridemic man. J Lipid Res 1979;20:217–229 [PubMed] [Google Scholar]
- 41.Stocks SG, Miller NE. Capillary electrophoresis to monitor the oxidative modification of LDL. J Lipid Res 1998;39:1305–1309 [PubMed] [Google Scholar]
- 42.Benjamini Y, Hochberg Y. Controlling the false discovery rate: a practical and powerful approach to multiple testing. J R Stat Soc, B 1995;57:289–300 [Google Scholar]
- 43.Le Lay S, Krief S, Farnier C, et al. Cholesterol, a cell size-dependent signal that regulates glucose metabolism and gene expression in adipocytes. J Biol Chem 2001;276:16904–16910 [DOI] [PubMed] [Google Scholar]
- 44.Yu BL, Zhao SP, Hu JR. Cholesterol imbalance in adipocytes: a possible mechanism of adipocytes dysfunction in obesity. Obes Rev 2010;11:560–567 [DOI] [PubMed] [Google Scholar]
- 45.Duval C, Thissen U, Keshtkar S, et al. Adipose tissue dysfunction signals progression of hepatic steatosis towards nonalcoholic steatohepatitis in C57Bl/6 mice. Diabetes 2010;59:3181–3191 [DOI] [PMC free article] [PubMed] [Google Scholar]
- 46.Amato MC, Giordano C, Galia M, et al. AlkaMeSy Study Group Visceral Adiposity Index: a reliable indicator of visceral fat function associated with cardiometabolic risk. Diabetes Care 2010;33:920–922 [DOI] [PMC free article] [PubMed] [Google Scholar]
- 47.Zhao YF, Wang L, Lee S, et al. Cholesterol induces mitochondrial dysfunction and apoptosis in mouse pancreatic beta-cell line MIN6 cells. Endocrine 2010;37:76–82 [DOI] [PubMed] [Google Scholar]
- 48.Athyros VG, Tziomalos K, Gossios TD, et al. GREACE Study Collaborative Group Safety and efficacy of long-term statin treatment for cardiovascular events in patients with coronary heart disease and abnormal liver tests in the Greek Atorvastatin and Coronary Heart Disease Evaluation (GREACE) Study: a post-hoc analysis. Lancet 2010;376:1916–1922 [DOI] [PubMed] [Google Scholar]
- 49.Chan DC, Watts GF, Gan SK, Ooi EM, Barrett PH. Effect of ezetimibe on hepatic fat, inflammatory markers, and apolipoprotein B-100 kinetics in insulin-resistant obese subjects on a weight loss diet. Diabetes Care 2010;33:1134–1139 [DOI] [PMC free article] [PubMed] [Google Scholar]
- 50.Takeshita Y, Takamura T, Kita Y. Efficacy of ezetimibe for the treatment of non-alcoholic fatty liver disease: a randomized controlled trial. J Hep 2011;54:S346 [Google Scholar]
Associated Data
This section collects any data citations, data availability statements, or supplementary materials included in this article.