

Abstract
Mutations in the gene encoding nucleophosmin (NPM1) carry a prognostic value for patients with acute myeloid leukemia (AML). Various techniques are currently being used to detect these mutations in routine molecular diagnostics. Incorporation of accurate NPM1 mutation detection on a gene expression platform would enable simultaneous detection with various other expression biomarkers. Here we present an array-based mutation detection using custom probes for NPM1 WT mRNA and NPM1 type A, B, and D mutant mRNA. This method was 100% accurate on a training cohort of 505 newly diagnosed unselected AML cases. Validation on an independent cohort of 143 normal-karyotype AML cases revealed no false-negative results, and one false positive (sensitivity 100.0% and specificity 98.7%). Based on this, we conclude that this method provides a reliable method for NPM1 mutation detection. The method can be applied to other genes/mutations as long as the mutant alleles are sufficiently highly expressed.
Introduction
Acute Myeloid Leukemia (AML) is characterized by an accumulation of immature myeloid cells in the bone marrow (Löwenberg et al., 1999). The genetic background of AML is highly heterogeneous, and cytogenetic analysis is commonly used to separate patients with AML into favorable, intermediate, and unfavorable prognostic subtypes (Grimwade et al., 1998). Further stratifications can be made based on the presence or absence of particular gene mutations (Theilgaard-Mönch et al., 2011) such as NPM1 (Falini et al., 2005), FLT3-ITD (Kottaridis et al., 2001), CEBPA (Wouters et al., 2009), and DNMT3A (Ribeiro et al., 2012), or changes in gene expression (Bullinger et al., 2004; Valk et al., 2004).
Cytoplasmic NPM1 protein was detected in 35% of AML cases (Falini et al., 2005), and was linked with insertions (often 4 base pairs) at position 960 (in exon 12) causing a frameshift in the nuclear localization signal domain (Falini et al., 2005). In cytogenetically normal AML, 50%–60% of cases were found to harbor NPM1 mutations (Boissel et al., 2005; Döhner et al., 2005; Schnittger et al., 2005; Suzuki et al., 2005; Thiede et al., 2006). The NPM1 mutations are always heterozygous, and the most frequently occurring have been named type A (TCTG, 80%), type B (CATG, 10%), and type D (CCTG, 5%) (Falini et al., 2005). The remaining NPM1 mutations are comprised of at least 20 other 4-bp insertions (including type C) at the same position, and a minority of insertions at other locations in exon 12 (Falini et al., 2005; Thiede et al., 2006). The combination of having an NPM1 mutation and absence of FLT3-ITD mutations was found to confer a favorable risk (Döhner et al. 2005; Gale et al. 2005; Verhaak et al., 2005; Schneider et al., 2012).
Several methods can be employed to detect NPM1 mutations. Immunostaining led to the initial discovery of excess abundance of NPM1 protein in the cytoplasm (Falini et al., 2005), but has been shown to be not fully concordant with the mutant NPM1 status as determined by sequencing (Mattsson et al., 2010). Alternatively, NPM1 mutations can be screened for using fluorescence resonance energy transfer (Scholl et al., 2007), denaturing high-performance liquid chromatography (dHPLC) (Ammatuna et al., 2005), allele-specific Q-PCR (Gorello et al. 2006), or gene expression profiling (Verhaak et al., 2005). Most of these methods are not standardized, not for in vitro diagnostic (IVD) use, and none of them is integrated into an AML diagnostic platform that also detects several other relevant markers.
Reliability and efficiency are important in clinical molecular diagnostics. Streamlining diagnostics by combining multiple tests into a single assay could contribute toward satisfying stringent quality demands. A gene expression microarray assay for AML can be used to detect t(8;21), inv(16)/t(16;16), t(15;17) (Valk et al., 2004), and CEBPA double mutants (Wouters et al., 2009) based on their typical gene expression signatures. Previous evaluation of gene expression-based prediction of the NPM1 mutation, however, showed limited specificity [82.7% specificity, (Verhaak et al., 2005)]. Therefore, we set out to develop an alternative approach, yet compatible with a gene expression array. This led to the development of custom-designed probes and algorithms for the array-based mutation detection of NPM1 mutations. The algorithm was developed on a large cohort of AML cases, and subsequently validated on an independent cohort of AML cases.
Materials and Methods
Gene expression array
A customized Affymetrix GeneChip microarray was designed (AMLprofiler™). For NPM1 detection, seven perfect match (PM) and seven mismatch (MM) probes for the WT and three mutation types were included (type A, type B, and type D). These seven probes were tiled at −4, −2, −1, 0, +1, +3, and +4 nucleotides relative to the 960- (exon 12) insertion hotspot of the NPM1 gene. The seven PM probes for the WT and type A mutant are shown in Figure 1A. This tiling setup is similar to Affymetrix single-nucleotide polymorphism (SNP) platform designs (Di et al., 2005). All probes were 25-mer long, and MM probes are the same as PM probes, although with their middle position flipped. In total, 56 probes were used for NPM1 detection [7*4*2=56; seven tiled probes, four variants (WT and three mutations), and both PM and MM probes].
FIG. 1.

(A) Example showing the seven 25-mer Perfect Match probes tiled across the NPM1 insertion site (relative to nt position 960). The top shows the probes that are tiled across the NPM1 WT sequence, whereas the bottom shows the probes tiled across the NPM1 A variant. (B) Heatmaps showing the intensities (log2 scale) of the 56 NPM1-associated probes for four representative examples of an NPM1 WT, NPM1 A, NPM1 B, and NPM1 D case. Color images available online at www.liebertpub.com/gtmb
Datasets
As a training cohort, we employed the blood or marrow specimens from 505 patients with AML, who had been enrolled in the Dutch–Belgian Hematology-Oncology Cooperative group protocols −04, −04A, −29, and −42 (HOVON-SAKK, Erasmus Medical Center, Rotterdam) (Valk et al., 2004; Wouters et al., 2009). Sample processing and quality control were performed as previously described (Verhaak et al., 2005). Mutations in NPM1 exon 12 were determined by cDNA amplification using polymerase chain reaction (PCR) with specific primers. PCR products were subsequently subjected to dHPLC using a Transgenomics WAVE dHPLC system. All samples with an abnormal dHPLC profile were Sanger-sequenced to determine the type of the NPM1 mutation (Verhaak et al., 2005).
As an independent validation cohort, we employed 143 AML cases with a normal karyotype, collected by the German–Austrian AML Study Group (AMLSG; Ulm University) (Kohlmann et al., 2010; Taskesen et al. 2011). Sample processing and quality control were performed as previously described (Kohlmann et al., 2010; Taskesen et al. 2011). NPM1 exon 12 was amplified using a PCR with specific primers. PCR products were subjected to Sanger sequencing, providing the mutation status (Döhner et al., 2005).
Table 1 shows an overview of the NPM1 mutation status of all samples in the training and validation cohorts. All NPM1 mutations were found to be heterozygous. NPM1 non-ABD indicates a mutant, but not type A, B, or D. In this study, we consider NPM1 A, B, and D as the positive group (collectively referred to as NPM1 ABD), and all remaining cases as negative.
Table 1.
Overview of Cases in the Two Cohorts, and Distribution of NPM1 Mutations
| |
|
Training cohort |
Validation cohort |
||
|---|---|---|---|---|---|
| NPM1 status | Label | n | % | n | % |
| NPM1 WT | Neg | 350 | 69.3% | 72 | 50.3% |
| NPM1 non-ABD | Neg | 10 | 2.0% | 5 | 3.5% |
| NPM1 A (TCTG) | Pos | 123 | 24.4% | 56 | 39.2% |
| NPM1 B (CATG) | Pos | 15 | 3.0% | 8 | 5.6% |
| NPM1 D (CCTG) | Pos | 7 | 1.4% | 2 | 1.4% |
| Total | 505 | 100.0% | 143 | 100.0% | |
Hybridization cocktails were obtained for all samples in the training and validation cohort, and were hybridized onto the AMLprofiler platform. The datasets are available at the Gene Expression Omnibus (National Center for Biotechnology Information) under accession number GSE42194 (training) and GSE42200 (validation).
All patients provided written informed consent in accordance with the Declaration of Helsinki.
Sequencing NPM1 from hybridization cocktails
For confirmation purposes, we also sequenced the NPM1 mutation status directly from the obtained hybridization cocktails. cRNA was extracted from the hybridization cocktails using RNABee (Bio-connect), and cDNA was synthesized using Superscript II (Invitrogen) and random hexamers (Roche). The fragments were amplified with NPM1 exon 12-specific primers. Direct sequencing was performed using Big Dye terminator chemistry ver.3.1 (Applied Biosystem). The fragments were loaded on an Applied Biosystem 3130XL automated sequencer and analyzed with DNA Sequencing analysis (ver.5.3) and SeqScape (ver.2.6) software (Applied Biosystem). The retrieval of cRNA fragments as a substrate for reliable bidirectional Sanger sequencing had been validated using positive (NPM1 A cell line; OCIAML3 hybridization cocktail) and negative (NPM1 WT cell line; ME-1 hybridization cocktail) controls.
Dynamic model algorithm and data analyses
The Dynamic Model algorithm (DM, Di et al., 2005) was originally developed for SNP detection purposes, and was used in the array-based mutation detection method presented in this study. The DM model considers two alleles (in this case WT and a mutant), and evaluates the possible conformations of these two alleles. To this end, probe quartets were formed consisting from all probes at the same tiling position (e.g., −4nt), that is, the WT PM, WT MM, mutant PM, and mutant MM probes. Thus, seven probe quartets were formed, one for each tiling position. For each probe quartet, separately, four models were evaluated reflecting the following four genotypes (see Fig. 2):
Model 0: WTWT, homozygous wild type
Model 1: WTMut, heterozygous wild type–mutant
Model 2: MutMut, homozygous mutant
Model −1: No call (Null model)
FIG. 2.
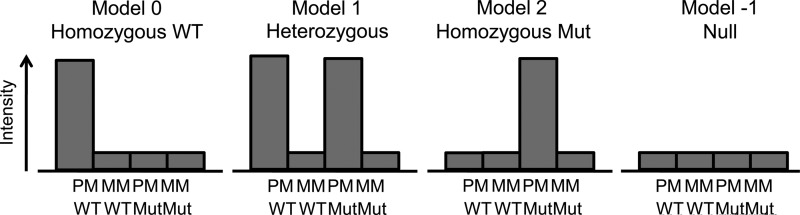
The four models analyzed by the dynamic model algorithm, showing the assumptions of high and low intensities of a probe quartet.
For each model, a log-likelihood was calculated using the probe intensities/standard deviations (assuming that the data are independent and identically [normal] distributed). Thus, four log-likelihoods were obtained for each of the seven probe quartets. Next, the log-likelihoods were corrected to take hybridization efficiencies and levels of nonspecific cross hybridization into account, leading to a score S. After that, a one-sided Wilcoxon signed-rank test was applied on the seven S scores for a given model, resulting in a p-value for each model. A low p-value implies that that model is highly likely, given the data observed. The model that had the lowest p-value was returned as the call. In case that this lowest p-value was larger than a predefined threshold (default: 0.33), the call was set to −1. In such an event, none of the models was a good fit to the data.
A difference between the previous applications of the algorithm and our current use of the algorithm is that there are more than two alleles to be called, namely, WT, A, B, and D. Therefore, for each AML case, the DM algorithm was executed for the comparison WT versus A, WT versus B, and WT versus D, resulting in three genotype calls. The case was then called NPM1 mutant if at least one model 1 (heterozygous) or model 2 (homozygous mutant) call was returned, and NPM1 WT otherwise.
Data analysis
We employed the Affymetrix Power Tools (APT) suite (version 1.10.2) for data analysis. The APT contains the DM algorithm; and requires a CEL file (file from a scanned AMLprofiler chip) and threshold (default: 0.33) as input. For optimization purposes, we needed the p-values for all four models. However, the APT implementation of the DM algorithm only returns the lowest p-value and the associated model. The source code of the algorithm was included in the APT (C++), from which we modified the DM output routine to return the p-values for all four models. MatLab R2011a (www.mathworks.com) was used for all subsequent data analyses.
All performances are reported in terms of true positives, false positives (FP), true negatives, and false negatives. In addition, specificities and sensitivities are calculated along with 95% confidence lower limit and upper limit, according to CLSI EP12-A2.
Creating in silico dilution series
Dilution series of samples are commonly employed to determine the limit of detection (LOD) of a test. In the current context, this would imply mixing BM from AML cases. Previously, we have performed in vitro mRNA mixing series and compared them with in silico mixing series of the AMLprofiler intensity data to show very high concordance for their results (data not shown). We rely on the validity of this approach to determine the LOD for NPM1 in silico by linearly interpolating all intensities/standard deviations of all probes in steps of 1% from two CEL files, one of them NPM1 mutant and one wild-type. In this way, we obtained 101 CEL files, the two original CEL files, and 99 interpolated variants.
Results
Results for the NPM1 probes on the training cohort
For the 505 cases from the training cohort, we evaluated the heatmaps of the 56 probes that were tiled across the NPM1 gene. Representative examples for a WT and the three mutants are shown in Figure 1B. As expected, the NPM1 WT only shows signal on the NPM1 WT PM probes. The NPM1 A and NPM1 B cases show signal on the NPM1 WT PM and their corresponding mutant PM probes, owing to their heterozygote genotype. However, for NPM1 D, the signal is observed on the NPM1 WT PM, mutant A PM, and mutant D PM probes. Similarly, for NPM1 A, some signal is seen on the NPM1 D PM probes, although much lower than the NPM1 A PM probes. Most likely, the concomitant positive signal on the NPM1 A and NPM1 D probes is due to cross hybridization of the NPM1 A and D mRNA transcripts, as the difference between the A and D insertion is only one base pair.
Optimizing the DM threshold for array-based mutation detection of NPM1 mutants
The DM algorithm was originally developed for SNP detection at the DNA level. Some assumptions that are valid at the DNA level (e.g., stoichiometry 1 to 1) might not be valid at the mRNA level. Therefore, the default threshold of 0.33 used in the DM algorithm might not be optimal for the current application. Therefore, we varied the threshold from 0.01 to 0.5 in steps of 0.01 (threshold 0 is not tested, as this would imply all cases to be predicted to be WT). At each threshold, we counted the number of correct WT and mutant calls (Fig. 3). For the WT cases, the algorithm appears robust; at all thresholds, the NPM1 WT cases were correctly detected. For the NPM1 ABD mutations, all but one case were correctly identified at the default threshold. Therefore, we chose a slightly higher threshold of 0.41 at which all mutants are correctly detected. Thus, using the threshold of 0.41, all 505 cases in the training cohort are correctly detected, that is, with 100% sensitivity and 100% specificity (see Table 2).
FIG. 3.

The number of correctly detected NPM1 WT cases (left), and NPM1 ABD cases (right), when varying the threshold. Results shown for the 505 cases in the training cohort.
Table 2.
Performance of the Array-Based Mutation Detection Method for Predicting NPM1 Mutations on the Training and Validation Cohorts
| |
|
|
|
|
|
|
95% CI |
|
95% CI |
||
|---|---|---|---|---|---|---|---|---|---|---|---|
| Dataset | n | TP | FP | TN | FN | Sens | LL | UL | Spec | LL | UL |
| Training data | 505 | 145 | 0 | 360 | 0 | 100.0 | 97.4 | 100.0 | 100.0 | 98.9 | 100.0 |
| Validation data | 143 | 66 | 2a | 75 | 0 | 100.0 | 94.5 | 100.0 | 97.4 | 91.0 | 99.3 |
Sequencing of the hybridization cocktails confirmed one case to be NPM1 A, and the other to be a non-ABD mutant. This results in 67 TP and 1 FP, corresponding with a sensitivity of 100.0 (95% CI 94.6–100.0) and specificity of 98.7 (95% CI 92.9–99.8).
TP, true positive; FP, false positive; TN, true negative; FN, false negative; CI, confidence interval.
Validation of the array-based mutation detection of NPM1 mutants
A dataset of 143 cytogenetically normal AML cases was used as the independent validation cohort. The array-based mutation detection method employing the DM algorithm with a threshold of 0.41 was applied to this cohort (Table 2). Similar to the results on the training data, high sensitivity (100.0%) and specificity (97.4%) values were achieved on the validation cohort. Nevertheless, two false-positive results were observed in the validation cohort (see Table 2). Therefore, we inspected the heatmaps of those two false-positive cases (Fig. 4) revealing a very strong (case 05PB2316) and a weak (case 46) NPM1 A pattern. The latter also shows an atypical high intensity for NPM1 A MM probe 4. Therefore, we hypothesized that this case is in fact a non-ABD mutant with a TCAG insertion (Fig. 1A, probe 4 with middle position flipped results in TCAG); that is, the NPM1 A mismatch probe 4 functions as a perfect match for this particular mutation. The weak NPM1 A pattern is most likely due to cross hybridization (similar to the cross hybridization between NPM1 A and D). Next, we sequenced the fragmented cRNA from the hybridization cocktails of the two FP cases (see the Materials and Methods section). The sequencing confirmed the two cases to be NPM1 A and NPM1 non-ABD (TCAG, as hypothesized). This leaves only 1 FP (the non-ABD) relative to the definition of calling the ABD mutants the positive group, see Table 2.
FIG. 4.

Heatmaps showing the intensities (log2 scale) of the 56 NPM1-associated probes for the two FP (left panel: case 05PB2316, right panel: case 46) cases in the validation cohort. Color images available online at www.liebertpub.com/gtmb
LOD of the array-based detection of NPM1 mutants
We created a dilution series of a representative heterozygous NPM1 A and homozygous NPM1 WT case, in silico in steps of 1% (see the Materials and Methods section). This resulted in NPM1-positive calls for samples with at least 43% NPM1 mutant content.
Discussion
Array-based mutation detection of NPM1 mutations at the mRNA level is possible, with a validated performance of 100.0% sensitivity and 98.7% specificity. Moreover, this test has been incorporated into an existing diagnostic chip, providing a standardized test. This is an advantage over the most screening methods such as fragment-length analysis (Scholl et al., 2007) and dHPLC (Ammatuna et al., 2005), which are typically not standardized across laboratories. A possible disadvantage of the array-based mutation detection, as it was employed in this study, is its limitation to only detect the NPM1 A, B, and D mutants constituting ∼95% of all NPM1 mutant cases. Technically, it is possible to expand the chip design to include probes for the other NPM1 mutants as well.
Typically, gene expression-derived biomarkers validate poorly across datasets without the application of some form of cohort wide corrections (e.g., GCRMA or mean variance normalization). The array-based mutation detection method does not require normalization of the data, and performs excellently across datasets, as shown on the validation dataset that was prepared in a different laboratory. This is an indication that the array-based mutation detection is robust, and is highly reproducible.
NPM1 mutations are an early event and are therefore present in all leukemic cells (Falini et al. 2011). Thus, the estimated LOD of 43% should be adequate.
Integration of the array-based mutation detection method for NPM1 mutants on the AMLprofiler Affymetrix platform provides a single standardized test capable of detecting a variety of clinically relevant biomarkers in AML. Together, this enables a more efficient analysis at diagnosis, with a single sample workup that is less time consuming.
The array-based mutation detection method can be applied to other genes/mutations as well as fusion transcripts. For every gene/mutation, the threshold in the DM algorithm should be optimized separately, as it is likely that the optimal threshold is gene/mutation specific and depends on allelic load. Probably, mutations, insertions, and deletions can be detected with high accuracy, as long as the position and type of mutation are known, and the transcript is expressed at detectable levels.
Acknowledgments
The authors would like to thank Raoul Frijters, Skyline Diagnostics, Erasmus Medical Center, for fruitful discussions on the work presented. We would also like to thank Pia Burgmer, and Linda de Quartel, Skyline Diagnostics, Erasmus Medical Center, for their assistance in the laboratory. This research was performed within the framework of CTMM, the Center for Translational Molecular Medicine, project BioCHIP grant 03O-102.
Author Disclosure Statement
MHVV researched, designed the experiments, analyzed the data, interpreted data, and wrote the manuscript. PB, BD, ES, HV, LB, KD, and HD performed research. BL and PJMV conceptuated the project, and were involved in research, design of the experiments, data interpretation, and manuscript writing. EHVB performed research, design of experiments, data interpretation, and manuscript writing. MHVV, BD, ES, HV, EHVB, BL, and PJMV have declared ownership interests in Skyline Diagnostics.
References
- Ammatuna E. Noguera NI. Zangrilli , et al. Rapid detection of nucleophosmin (NPM1) mutations in acute myeloid leukemia by denaturing HPLC. Clin Chem. 2005;51:2165–2167. doi: 10.1373/clinchem.2005.055707. [DOI] [PubMed] [Google Scholar]
- Boissel N. Renneville A. Biggio V, et al. Prevalence, clinical profile, and prognosis of NPM mutations in AML with normal karyotype. Blood. 2005;106:3618–3620. doi: 10.1182/blood-2005-05-2174. [DOI] [PubMed] [Google Scholar]
- Bullinger L. Döhner K. Bair E, et al. Use of gene-expression profiling to identify prognostic subclasses in adult acute myeloid leukemia. N Engl J Med. 2004;350:1605–1616. doi: 10.1056/NEJMoa031046. [DOI] [PubMed] [Google Scholar]
- Di X. Matsuzaki H. Webster TA, et al. Dynamic model based algorithms for screening and genotyping over 100 K SNPs on oligonucleotide microarrays. Bioinformatics. 2005;21:1958–1963. doi: 10.1093/bioinformatics/bti275. [DOI] [PubMed] [Google Scholar]
- Döhner K. Schlenk RF. Habdank M, et al. Mutant nucleophosmin (NPM1) predicts favorable prognosis in younger adults with acute myeloid leukemia and normal cytogenetics: interaction with other gene mutations. Blood. 2005;106:3740–3746. doi: 10.1182/blood-2005-05-2164. [DOI] [PubMed] [Google Scholar]
- Falini B. Mecucci C. Tiacci E, et al. Cytoplasmic nucleophosmin in acute myelogenous leukemia with a normal karyotype. N Engl J Med. 2005;352:254–266. doi: 10.1056/NEJMoa041974. [DOI] [PubMed] [Google Scholar]
- Falini B. Martelli MP. Bolli N, et al. Acute myeloid leukemia with mutated nucleophosmin (NPM1): is it a distinct entity? Blood. 2011;117:1109–1120. doi: 10.1182/blood-2010-08-299990. [DOI] [PubMed] [Google Scholar]
- Gale RE. Hills R. Pizzey AR, et al. Relationship between FLT3 mutation status, biologic characteristics, and response to targeted therapy in acute promyelocytic leukemia. Blood. 2005;106:3768–3776. doi: 10.1182/blood-2005-04-1746. [DOI] [PubMed] [Google Scholar]
- Gorello P. Cazzaniga G. Alberti , et al. Quantitative assessment of minimal residual disease in acute myeloid leukemia carrying nucleophosmin (NPM1) gene mutations. Leukemia. 2006;20:1103–1110. doi: 10.1038/sj.leu.2404149. [DOI] [PubMed] [Google Scholar]
- Grimwade D. Walker H. Oliver F, et al. The importance of diagnostic cytogenetics on outcome in AML: analysis of 1,612 patients entered into the MRC AML 10 trial. Blood. 1998;92:2322–2333. [PubMed] [Google Scholar]
- Kohlmann A. Bullinger L. Thiede C, et al. Gene expression profiling in AML with normal karyotype can predict mutations for molecular markers and allows novel insights into perturbed biological pathways. Leukemia. 2010;24:1216–1220. doi: 10.1038/leu.2010.73. [DOI] [PubMed] [Google Scholar]
- Kottaridis PD. Gale RE. Frew ME, et al. The presence of a FLT3 internal tandem duplication in patients with acute myeloid leukemia (AML) adds important prognostic information to cytogenetic risk group and response to the first cycle of chemotherapy: analysis of 854 patients from the United Kingdom Medical Research Council AML 10 and 12 trials. Blood. 2001;98:1752–1759. doi: 10.1182/blood.v98.6.1752. [DOI] [PubMed] [Google Scholar]
- Löwenberg B. Downing JR. Burnett A. Acute myeloid leukemia. N Engl J Med. 1999;341:1051–1062. doi: 10.1056/NEJM199909303411407. [DOI] [PubMed] [Google Scholar]
- Mattsson G. Turner SH. Cordell J, et al. Can cytoplasmic nucleophosmin be detected by immunocytochemical staining of cell smears in acute myeloid leukemia? Haematologica. 2010;95:670–673. doi: 10.3324/haematol.2009.011817. [DOI] [PMC free article] [PubMed] [Google Scholar]
- Ribeiro AFT. Pratcorona M. Erpelinck-Verschueren C, et al. Mutant DNMT3A: a new marker of poor prognosis in acute myeloid leukemia. Blood. 2012;119:5824–5831. doi: 10.1182/blood-2011-07-367961. [DOI] [PubMed] [Google Scholar]
- Scholl S. Mügge L-O. Landt O, et al. Rapid screening and sensitive detection of NPM1 (nucleophosmin) exon 12 mutations in acute myeloid leukaemia. Leuk Res. 2007;31:1205–1211. doi: 10.1016/j.leukres.2006.12.011. [DOI] [PubMed] [Google Scholar]
- Schneider F. Hoster E. Unterhalt M, et al. The FLT3ITD level has a high prognostic impact in NPM1 mutated, but not NPM1 unmutated AML with a normal karyotype. Blood. 2012;119:4383–4386. doi: 10.1182/blood-2010-12-327072. [DOI] [PubMed] [Google Scholar]
- Schnittger S. Schoch C. Kern W, et al. Nucleophosmin gene mutations are predictors of favorable prognosis in acute myelogenous leukemia with a normal karyotype. Blood. 2005;106:3733–3739. doi: 10.1182/blood-2005-06-2248. [DOI] [PubMed] [Google Scholar]
- Suzuki T. Kiyoi H. Ozeki K, et al. Clinical characteristics and prognostic implications of NPM1 mutations in acute myeloid leukemia. Blood. 2005;106:2854–2861. doi: 10.1182/blood-2005-04-1733. [DOI] [PubMed] [Google Scholar]
- Taskesen E. Bullinger L. Corbacioglu A, et al. Prognostic impact, concurrent genetic mutations and gene expression features of AML with CEBPA mutations in a cohort of 1182 cytogenetically normal AML: further evidence for CEBPA double mutant AML as a distinctive disease entity. Blood. 2011;117:2469–2475. doi: 10.1182/blood-2010-09-307280. [DOI] [PubMed] [Google Scholar]
- Theilgaard-Mönch K. Boultwood J, et al. Gene expression profiling in MDS and AML: potential and future avenues. Leukemia. 2011;25:909–920. doi: 10.1038/leu.2011.48. [DOI] [PubMed] [Google Scholar]
- Thiede C. Koch S. Creutzig E, et al. Prevalence and prognostic impact of NPM1 mutations in 1485 adult cases with acute myeloid leukemia (AML) Blood. 2006;107:4011–4020. doi: 10.1182/blood-2005-08-3167. [DOI] [PubMed] [Google Scholar]
- Valk PJM. Verhaak RGW. Beijen MA, et al. Prognostically useful gene-expression profiles in acute myeloid leukemia. N Engl J Med. 2004;350:1617–1628. doi: 10.1056/NEJMoa040465. [DOI] [PubMed] [Google Scholar]
- Verhaak RGW. Goudswaard CS. van Putten W, et al. Mutations in nucleophosmin (NPM1) in acute myeloid leukemia (AML): association with other gene abnormalities and previously established gene expression signatures and their favorable prognostic significance. Blood. 2005;106:3747–3754. doi: 10.1182/blood-2005-05-2168. [DOI] [PubMed] [Google Scholar]
- Wouters BJ. Löwenberg B. Erpelinck-Verschueren CAJ, et al. Double CEBPA mutations, but not single CEBPA mutations, define a subgroup of acute myeloid leukemia with a distinctive gene expression profile that is uniquely associated with a favorable outcome. Blood. 2009;113:3088–3091. doi: 10.1182/blood-2008-09-179895. [DOI] [PMC free article] [PubMed] [Google Scholar]