

Abstract
Capons are male chickens whose testes have been surgically incised. Capons show a significant increase in fat accumulation compared to intact male chickens. However, while caponization leads to a significant reduction in androgen levels in roosters, little is known about the molecular mechanisms through which androgen status affects lipogenesis in avian species. Therefore, investigation of the influence of androgens on fat accumulation in the chicken will provide insights into this process. In this study, Affymetrix microarray technology was used to analyze the gene expression profiles of livers from capons and intact male chickens because the liver is the major site of lipogenesis in avian species. Through gene ontology, we found that genes involved in hepatic lipogenic biosynthesis were the most highly enriched. Interestingly, among the upregulated genes, the cytosolic form of the phosphoenolpyruvate carboxykinase (PCK1) gene showed the greatest fold change. Additionally, in conjunction with quantitative real-time PCR data, our results suggested that androgen status negatively regulated the PCK1 gene in male chickens.
Introduction
Capons are male chickens whose testes have been surgically incised. Caponization can produce a unique type of poultry meat grown for a specialized market because the capon meat is more tender, juicy, and flavorful than that of intact cockerels [1]. A possible reason for this difference in meat quality is that caponization results in a greater increase in subcutaneous, intercellular, and abdominal fat compared with fat accumulation in intact cockerels [2]–[5]; this increase in fat improves meat flavor.
Caponization has been shown to lead to a significant reduction in androgen levels in roosters. Androgen is a steroid hormone, and the primary and most well-known androgen is testosterone; other less-important androgens include dihydrotestosterone and androstenedione. In male mammals, androgen status plays an important role in adipogenesis [6]–[12]; however, little is known about the molecular mechanisms through which androgen status affects lipogenesis in avian species. Therefore, investigation of the influence of androgens on fat accumulation in the chicken will provide interesting insights into this process.
The liver is the main organ of lipogenesis in poultry [13]. In a previous study, Chen et al [14] suggested that an increase in the activity and mRNA levels of malic enzyme 1 (ME1) may be positively associated with hepatic lipogenesis in male White Leghorn chickens. However, the global expression profiles of related hepatic lipogenic genes following caponization have not been elucidated.
Microarray technology is a powerful method for profiling gene expression patterns of thousands of genes in a single experiment, and is therefore widely applied to identify the tissue- and disease-specific conditions under which genes are expressed [15]–[20]. In many respects, the 2 types of labeled targets, i.e., cRNA and cDNA, are considered to be equivalent for microarray analysis. However, cRNA has proven to be advantageous for experiments with small amounts of starting RNA [21], [22] and is required for Affymetrix microarray analysis. In this study, Affymetrix microarray technology was employed to analyze the gene expression profiles of capons and intact male chickens. We performed gene expression profiling using livers from these 2 types of roosters and explored the possible molecular mechanisms governing lipid accumulation after caponization. From our results, we suggest that the gene encoding phosphoenolpyruvate carboxykinase 1 (PCK1) plays an important role in fat accumulation and is negatively regulated by androgen status in male chickens.
Materials and Methods
Animals
Healthy male single-comb White Leghorn chickens were selected from the Experimental Poultry Genetic Resource and Breeding Chicken Farm of China Agricultural University. All chickens were housed in a modern, nationally certified animal facility under the supervision of board-certified veterinarians. This study was carried out in strict accordance with the Regulations for the Administration of Affairs Concerning Experimental Animals of the State Council of the People’s Republic of China. The protocol was approved by the Committee on Experimental Animal Management of China Agricultural University.
Experimental Design
Sixty male chickens of the same age (ages 9 or 17 weeks) and with similar body weights were randomly divided into 3 groups (20 individuals per group per age). One group was taken as the control and the other 2 groups were caponized.
The caponization procedure was performed according to previously described methods [2], [5], [23]. Before the surgical operation, male chickens were prohibited from feeding for 12 h. The incision site was sterilized with veterinary external disinfectants. A 2–3-cm lateral incision was made at the second or third last rib, and the chicken’s 2 testes were removed. Veterinary external disinfectant was applied again to the incision site, which was closed with surgical sutures. After caponization, there was a 4-week recovery, followed by a 10-week feeding trial.
After caponization, 1 of the 2 caponized groups was used for implanting testosterone because the removal of testes leads to a greater decrease in body testosterone content. Therefore, implantation of testosterone would allow us to investigate the effects changes in body androgen status on fat biosynthesis. The testosterone implantation procedure was performed according to previously reported methods [2], [5], with modifications, and the testosterone amount implanted was based on a previously described method [5]. Exogenous testosterone was purchased from Sigma (USA) and formed into pellets (every pellet contained 18 mg testosterone). Using implantation guns from the Animal Reproduction Laboratory of China Agricultural University (Beijing), testosterone was implanted subcutaneously at the back of the chicken’s neck during the 10-week feeding trial (18 mg per individual dose with a total of 3 doses over 10 weeks; the “embed group”). The other 2 groups were called the control group (including only intact male chickens) and the capon group (including only caponized male chickens who were not given testosterone implants), respectively. All chickens were sacrificed by qualified technicians in a clean slaughterhouse by having their carotid arteries severed with clean neck cutters under anesthesia.
Determination of Abdominal Fat Content and Serum Hormone Concentrations
Blood samples were taken from the brachial veins of chickens following 12-h fasting from food and water prior to slaughter and were then stored in anticoagulant blood vessels at 4°C until use. Determination of sex hormone content using these blood samples was completed at the Sino-UK Institute of Biological Technology (Beijing). Serum testosterone and estradiol concentrations were determined by a previously described method [24] using a γ-counter (GC-911) with a radioimmunoassay kit.
After slaughter, the abdominal fat and liver tissues were removed immediately. Abdominal fat was weighed, and liver tissues were frozen in liquid nitrogen and stored at −80°C for further analysis.
Liver Microarray Analysis
We randomly selected 9 individuals from the control chickens and capons at 23 weeks of age. After slaughter, total RNA was isolated from liver tissues using Trizol (Invitrogen, Paisley, UK). We used a pooled design in order to obtain a sufficient amount of RNA to run an array. Nine RNA samples from control chickens or capons were randomly divided into 3 pools to give 3 RNA samples per pool. RNA integrity was electrophoretically verified by ethidium bromide staining and by OD260/OD280 nm absorption ratio (>1.95). Next, we prepared the cRNA and microarray chips following the technical manual for GeneChip expression analysis provided by Affymetrix (File S2). All liver microarray analyses were performed at the Bioassay Laboratory of CapitalBio Corporation (18 Life Science Parkway, Changping District, Beijing, China; http://www.capitalbio.com).
First- and second-strand cDNA were synthesized from total RNA (∼1 µg) using the SuperScript II system (Invitrogen, CA, USA). After a clean up and quality check of the double-stranded cDNA, an in vitro transcription reaction was conducted with the Enzo RNA Transcript Labeling Kit (Affymetrix, Santa Clara, CA) to produce biotin-labeled cRNA from the cDNA. The cRNA was then purified with the RNeasy Mini Kit (Qiagen, Valencia, CA) and fragmented for hybridization analysis. Finally, the fragmented cRNA was hybridized with the Chicken Liver Microarray (Affymetrix) in a hybridization cocktail. Hybridization took place overnight (16 h) at 45°C in a GeneChip Hybridization Oven 640 at 60 rpm (Affymetrix), followed by washing and staining with streptavidin-phycoery-thrin (SAPE, Molecular Probes, Eugene, OR) as described in the Affymetrix GeneChip Expression Analysis Technical Manual (File S2). The distribution of fluorescent material on the array was imaged using the GeneArray Scanner 3000 (Affymetrix). Microarray Suite (MAS) Version 5.0 and GeneChip Operating Software (GCOS), supplied by Affymetrix, were used for gene expression analysis. High-density oligonucleotide array probe level data were normalized using previously described methods [25].
Significance analysis of microarrays (SAM) is a method that can be used to identify differentially expressed genes. Each gene was assigned a score on the basis of its change in gene expression relative to the standard deviation of repeated measurements. Genes with scores that are significantly higher than the expected score were termed differentially expressed. The expected score was calculated by permuting the measurements and then taking the average score for all the permuted scores as the expected score. To control the type I error rate for multiple-hypothesis testing, SAM was used to fix the rejection region and then estimate its corresponding error rate. SAM applies the methodology to both the positive false discovery rate and q-value as presented in previous studies [26]. To identify significantly differentially expressed genes, we used the following criteria: fold change, ≥2 or ≤0.5; q-value, ≤5%. Gene ontology analysis was conducted at http://www.geneontology.org, and the pathway analysis was performed by KEGG (http://www.genome.jp/kegg).
Quantitative Real-time PCR (qRT-PCR)
Twelve chicken livers were randomly selected from each of the 3 groups. Total RNA was extracted from the livers. cDNA was synthesized from 1 µg total RNA with M-MLV Reverse Transcriptase (Promega). Aliquots of cDNA were used as a template for real-time PCR. Reactions contained primers and probes for PCK1 or ME1 genes or primers and a probe for glyceraldehyde 3-phosphate dehydrogenase (GAPDH), which served as a reference gene. Each reaction contained cDNA derived from 20 ng total RNA. Three replicates were performed for each reaction.
qRT-PCR was carried out using a CFX Connect Real-Time PCR Detection System (Bio-R, Hercules, California, USA) in a Bio-Rad Real Time-PCR9600. Relative expression of target genes was calculated by a previously described method [27]. First, 12 livers from each of the control and capon groups were selected for carrying out qRT-PCR. Then, if significant differences were found between the 2 groups, irrespective of age, 12 livers from the embed group were selected for qRT-PCR as well.
Primer sets for PCK1 (forward, 5′-GCAGGGGTTATGATGAGAAGT-3′; and reverse, 5′-ACGGATCACAGTTTTGAAGAC-3′), ME1 (forward, 5′-CTGGAGTTGCTCTTGGTGT-3′; and reverse, 5′-TCCTGTAGGCTTCTTCTGC-3′), and the housekeeping internal control gene GAPDH (forward, 5′-GAAACCAGCCAAGTATGATG-3′; and reverse, 5′-ACCATTGAAGTCACAGGAGA-3′) were designed based on the sequences published in GenBank and using Primer Premier 5.0 software.
Statistical Analysis
All statistical analyses were performed with the GLM procedure in SAS 9.1 software (SAS Institute, 1990). Tests of differences were carried out using Duncan’s new multiple range method [28] and values are presented as the mean ± standard error (SE).
Results
Abdominal Fat Content and Serum Sex Hormone Content
In previous observations, abdominal fat content and blood sex hormone content were shown to exhibit significant differences in capons compared with intact male chickens [2]–[5]. We therefore compared the 2 indexes among the different groups. As shown in Table 1, in White Leghorn male chickens aged 23 or 31 weeks, the capon group exhibited a greater increase in abdominal fat content than the embed and control groups, and there was no significant difference in abdominal fat between the embed and control groups (P>0.05). This result indicated that caponization enhanced abdominal fat deposition and that implantation of testosterone significantly inhibited abdominal fat deposition.
Table 1. Abdominal fat content of White Leghorn male chickens at different ages for the 3 groups.
| Group | Abdominal fat content (g) | |
| 23 weeks of age* | 31 weeks of age* | |
| Capon | 10.55±1.53β (n = 20) | 4.25±0.78bβ (n = 20) |
| Embed | 0.00±0.00α (n = 20) | 1.44±0.75a (n = 20) |
| Control | 0.00±0.00α (n = 20) | 0.00±0.00α (n = 20) |
Note: All values are depicted as means ± SE.
P<0.01;
P<0.05;
age at the end of the experiment.
As shown in Figure 1, after caponization, serum testosterone content decreased dramatically in the capon group compared with the control and embed groups, irrespective of age, but showed no significant difference between the control and embed groups (P>0.05). The results also indicated that implantation of testosterone resulted in a significant recovery in serum testosterone content in capons. In contrast, serum estradiol levels did not differ among all groups, irrespective of age (P>0.05; Figure 2).
Figure 1. Serum testosterone content in the different groups.

Serum testosterone content was determined in chickens from the control, capon and embed groups. *, P<0.05; **, P<0.01.
Figure 2. Serum estradiol content in the different groups.

Serum estradiol content was determined in chickens from the control, capon and embed groups. *, P<0.05; **, P<0.01.
Liver Microarray Analysis
Affymetrix microarray technology was used to analyze the gene expression profiles of chicken livers from the capon and control groups. Of the 38536 probes analyzed (File S3), 79 genes were upregulated by at least 2-fold, and 42 genes were downregulated by at least 2-fold in the livers of capons (File S1, Table 2). Gene ontology enrichment analysis indicated that the largest proportion of upregulated genes was involved in metabolic pathways, whereas genes involved in lipid metabolism were the most highly enriched (Table 3). Furthermore, pathway analysis by KEGG showed that genes with differential expression were mainly involved in lipid metabolism and Jak-STAT signaling pathways (Table 3).
Table 2. Genes differentially expressed (q <0.05) in capons’ livers compared to control livers of male White Leghorn chickens.
| Gene symbol | Gene or function | q-value | FC | |
| Upregulated1 | PCK1 | phosphoenolpyruvate carboxykinase 1 (soluble) | 0 | 28.87 |
| 2 | ABCB1 | ATP-binding cassette, sub-family B (MDR/TAP), member 1 | 0 | 6.26 |
| 3 | MOGAT1 | monoacylglycerol O-acyltransferase 1 | 0 | 5.80 |
| 4 | CDKN2B | cyclin-dependent kinase inhibitor 2B (melanoma, p16, inhibits CDK4) | 0.008 | 5.48 |
| 5 | FABP1 | fatty acid binding protein 1, liver | 0 | 4.94 |
| 6 | ABCG5 | ATP-binding cassette, sub-family G (WHITE), member 5 (sterolin 1) | 0 | 4.61 |
| 7 | RBM38 | RNA binding motif protein 38 | 0 | 4.29 |
| 8 | LOC428660 | similar to very large inducible GTPase-1 | 0 | 3.90 |
| 9 | CHAC1 | ChaC, cation transport regulator homolog 1 (E. coli) | 0.005 | 3.65 |
| 10 | GCLC | glutamate-cysteine ligase, catalytic subunit | 0.009 | 3.65 |
| 11 | RCJMB04_16d24 | ELOVL family member 6, elongation of long chain fatty acids | 0 | 3.37 |
| 12 | GALE | UDP-galactose-4-epimerase | 0 | 3.36 |
| 13 | NCAM1 | Neural cell adhesion molecule 1 | 0 | 3.30 |
| 14 | APOA4 | apolipoprotein A-IV | 0 | 3.27 |
| 15 | ADFP | Adipose differentiation-related protein | 0.010 | 3.24 |
| 16 | SIK1 | salt-inducible kinase 1 | 0.003 | 3.22 |
| 17 | TMCC2 | transmembrane and coiled-coil domain family 2 | 0 | 3.16 |
| 18 | BRP44L | brain protein 44-like | 0.005 | 3.13 |
| 19 | ELOVL2 | elongation of very long chain fatty acids-like 2 | 0 | 3.12 |
| 20 | ALDH18A1 | aldehyde dehydrogenase 18 family, member A1 | 0.006 | 2.99 |
| 21 | RCJMB04_5k4 | selenoprotein I | 0 | 2.93 |
| 22 | DBC1 | deleted in bladder cancer 1 | 0.019 | 2.91 |
| 23 | ELOVL1 | elongation of very long chain fatty acids | 0.007 | 2.87 |
| 24 | LOC420707 | hypothetical gene supported by CR386894 | 0 | 2.73 |
| 25 | WDR66 | WD repeat domain 66 | 0.011 | 2.73 |
| 26 | SEC22C | SEC22 vesicle trafficking protein homolog C (S. cerevisiae) | 0 | 2.70 |
| 27 | ABI3 | ABI gene family, member 3 | 0 | 2.68 |
| 28 | EREG | epiregulin | 0.026 | 2.68 |
| 29 | MFSD2 | major facilitator superfamily domain containing 2 | 0 | 2.66 |
| 30 | FICD | FIC domain containing | 0.014 | 2.64 |
| 31 | C7orf23 | chromosome 7 open reading frame 23 | 0.008 | 2.61 |
| 32 | FADS2 | Fatty acid desaturase 2 | 0.003 | 2.60 |
| 33 | SERPINA3 | serpin peptidase inhibitor, clade A, member 3 | 0.019 | 2.58 |
| 34 | SPG20 | spastic paraplegia 20 (Troyer syndrome) | 0.004 | 2.56 |
| 35 | IL10RB | interleukin 10 receptor, beta | 0.005 | 2.55 |
| 36 | SLC39A8 | solute carrier family 39 (zinc transporter), member 8 | 0.005 | 2.54 |
| 37 | SH3YL1 | SH3 domain containing, Ysc84-like 1 (S. cerevisiae) | 0 | 2.53 |
| 38 | CRAT | carnitine acetyltransferase | 0.031 | 2.52 |
| 39 | SEBOX | SEBOX homeobox | 0.012 | 2.49 |
| 40 | SOCS3 | suppressor of cytokine signaling 3 | 0.019 | 2.44 |
| 41 | LOC421910 | similar to Acp1 protein | 0.004 | 2.40 |
| 42 | SOCS1 | suppressor of cytokine signaling 1 | 0.006 | 2.35 |
| 43 | ATOH8 | Atonal homolog 8 (Drosophila) | 0.006 | 2.29 |
| 44 | IRG1 | immunoresponsive 1 homolog (M. musculus) | 0.020 | 2.28 |
| 45 | ECE1 | endothelin converting enzyme 1 | 0 | 2.25 |
| 46 | FADS1 | fatty acid desaturase 1 | 0.005 | 2.25 |
| 47 | ABCD3 | ATP-binding cassette, sub-family D (ALD), member 3 | 0.005 | 2.23 |
| 48 | SLC16A5 | solute carrier family 16, member 5 (monocarboxylic acid transporter 6) | 0 | 2.22 |
| 49 | THRSP | thyroid hormone responsive (SPOT14 homolog, R. norvegicus) | 0 | 2.22 |
| 50 | GNPNAT1 | glucosamine-phosphate N-acetyltransferase 1 | 0 | 2.19 |
| 51 | LOC768655 | similar to pim-3 protein | 0 | 2.19 |
| 52 | PHOSPHO1 | phosphatase, orphan 1 | 0.004 | 2.19 |
| 53 | RCJMB04_28i8 | Fas (TNFRSF6) binding factor 1 | 0.011 | 2.19 |
| 54 | SLC41A1 | Solute carrier family 41, member 1 | 0.015 | 2.19 |
| 55 | LOC418109 | hypothetical LOC418109 | 0.016 | 2.18 |
| 56 | ME1 | malic enzyme 1, NADP(+)-dependent, cytosolic | 0.013 | 2.18 |
| 57 | ZYG11B | zyg-11 homolog B (C. elegans) | 0 | 2.18 |
| 58 | C4orf33 | Chromosome 4 open reading frame 33 | 0 | 2.16 |
| 59 | CYP4B1 | cytochrome P450, family 4, subfamily B, polypeptide 1 | 0 | 2.16 |
| 60 | LOC416033 | similar to MGC80162 protein | 0 | 2.16 |
| 61 | YARS | tyrosyl-tRNA synthetase | 0.013 | 2.15 |
| 62 | CPT1A | carnitine palmitoyltransferase 1A (liver) | 0 | 2.11 |
| 63 | GATA5 | GATA binding protein 5 | 0.003 | 2.10 |
| 64 | SLC16A1 | solute carrier family 16, member 1 (monocarboxylic acid transporter 1) | 0.004 | 2.10 |
| 65 | ACAA1 | acetyl-CoenzymeA acyltransferase 1 | 0.003 | 2.09 |
| 66 | CCDC53 | Coiled-coil domain containing 53 | 0.003 | 2.09 |
| 67 | HRASLS | HRAS-like suppressor | 0.009 | 2.09 |
| 68 | FABP7 | fatty acid binding protein 7, brain | 0 | 2.08 |
| 69 | LOC422046 | similar to LOC494798 protein | 0.005 | 2.08 |
| 70 | CCDC13 | coiled-coil domain containing 13 | 0.004 | 2.05 |
| 71 | ICER | ICER protein | 0.012 | 2.05 |
| 72 | UBE2J1 | ubiquitin-conjugating enzyme E2, J1 (UBC6 homolog, S. cerevisiae) | 0 | 2.05 |
| 73 | ABHD3 | abhydrolase domain containing 3 | 0.003 | 2.04 |
| 74 | NXN | nucleoredoxin | 0.012 | 2.04 |
| 75 | CYCS | cytochrome c, somatic | 0.005 | 2.03 |
| 76 | IL20RA | interleukin 20 receptor, alpha | 0.004 | 2.01 |
| 77 | SERPINA12 | serpin peptidase inhibitor, clade A, member 12 | 0.014 | 2.01 |
| 78 | USP4 | ubiquitin specific peptidase 4 (proto-oncogene) | 0 | 2.01 |
| 79 | AGPAT4 | 1-acylglycerol-3-phosphate O-acyltransferase 4 | 0 | 2.00 |
| Downregulated | ||||
| 1 | PER3 | period homolog 3 (Drosophila) | 0.008 | −2.01 |
| 2 | SLC16A10 | Solute carrier family 16, member 10 (aromatic amino acid transporter) | 0.008 | −2.01 |
| 3 | ARHGAP24 | Rho GTPase activating protein 24 | 0 | −2.02 |
| 4 | N4BP2L1 | NEDD4 binding protein 2-like 1 | 0.005 | −2.02 |
| 5 | PTPRG | protein tyrosine phosphatase, receptor type, G | 0.005 | −2.04 |
| 6 | CYP3A80 | cytochrome P450 3A80 | 0.008 | −2.07 |
| 7 | HAL | histidine ammonia-lyase | 0.022 | −2.08 |
| 8 | RCJMB04_34j1 | protein kinase-like protein SgK196 | 0.007 | −2.08 |
| 9 | AKR1D1 | aldo-keto reductase family 1, member D1 | 0.038 | −2.09 |
| 10 | LOC416335 | apical protein 2 | 0.005 | −2.12 |
| 11 | FOXP2 | forkhead box P2 | 0.019 | −2.13 |
| 12 | SLC2A5 | solute carrier family 2, member 5 | 0.026 | −2.13 |
| 13 | KYNU | kynureninase (L-kynurenine hydrolase) | 0.018 | −2.14 |
| 14 | ZBTB16 | zinc finger and BTB domain containing 16 | 0.011 | −2.18 |
| 15 | SLC7A2 | solute carrier family 7, member 2 | 0.015 | −2.19 |
| 16 | TC2N | tandem C2 domains, nuclear | 0.048 | −2.22 |
| 17 | COL6A3 | collagen, type VI, alpha 3 | 0.027 | −2.23 |
| 18 | SRGAP1 | SLIT-ROBO Rho GTPase activating protein 1 | 0 | −2.29 |
| 19 | BUB1 | BUB1 budding uninhibited by benzimidazoles 1 homolog (S. cerevisiae) | 0.006 | −2.32 |
| 20 | PTPN1 | protein tyrosine phosphatase, non-receptor type 1 | 0 | −2.40 |
| 21 | GAL13 | beta-defensin 13 | 0.014 | −2.62 |
| 22 | LOC426431///OAT | hypothetical LOC426431///ornithine aminotransferase | 0.014 | −2.65 |
| 23 | FABP5 | fatty acid binding protein 5 | 0 | −2.69 |
| 24 | ASAH2 | N-acylsphingosine amidohydrolase 2 | 0.042 | −2.71 |
| 25 | PPAT | phosphoribosyl pyrophosphate amidotransferase | 0.013 | −2.71 |
| 26 | LPIN1 | lipin 1 | 0.021 | −2.76 |
| 27 | HNF4A | hepatocyte nuclear factor 4, alpha | 0.013 | −2.84 |
| 28 | CYP1A4 | cytochrome P450 1A4 | 0.009 | −2.89 |
| 29 | IL1RL1 | interleukin 1 receptor-like 1 | 0.008 | −3.01 |
| 30 | LOC769659///OAT | ornithine amino transferase | 0.009 | −3.18 |
| 31 | CYP7A1 | cytochrome P450, family 7, subfamily A, polypeptide 1 | 0.009 | −3.20 |
| 32 | LOC421091 | similar to transthyretin | 0.019 | −3.25 |
| 33 | SOCS2 | suppressor of cytokine signaling 2 | 0 | −3.25 |
| 34 | GLDC | glycine dehydrogenase (decarboxylating) | 0 | −3.28 |
| 35 | FKBP5 | FK506 binding protein 5 | 0.008 | −3.44 |
| 36 | EPAS1 | endothelial PAS domain protein 1 | 0 | −3.46 |
| 37 | CHIA | chitinase, acidic | 0 | −3.88 |
| 38 | GPT2 | glutamic pyruvate transaminase (alanine aminotransferase) 2 | 0 | −3.91 |
| 39 | IGSF21 | immunoglobin superfamily, member 21 | 0 | −4.64 |
| 40 | UPP2 | uridine phosphorylase 2 | 0.005 | −6.37 |
| 41 | LOC770705 | Similar to pol | 0.016 | −6.93 |
| 42 | CHIA///LOC768786 | chitinase, acidic///similar to CBPch04 | 0 | −7.12 |
Note: Accession numbers of the genes are shown in File S1.
Table 3. Gene categories according to pathway.
| Pathway | P-value | Genesa |
| Biosynthesis of unsaturated fatty acids | 1.50E−09 | ACAA1; RCJMB04_16d24; ELOVL2; FADS1; FADS2 |
| Bile acid biosynthesis | 2.24E−05 | ACAA1; AKR1D1; CYP7A1 |
| Jak-STAT signaling pathway | 2.26E−05 | IL10RB; |
| ABC transporters - General | 8.78E−05 | ABCD3; |
| Fatty acid metabolism | 1.08E−04 | CYP4B1; |
| Glutamate metabolism | 0.0015 | PPAT; |
| Aminosugars metabolism | 0.0017 | CHIA; |
| Alanine and aspartate metabolism | 0.0026 | CRAT; |
| Retinol metabolism | 0.0029 | CYP4B1; |
| Drug metabolism - other enzymes | 0.0033 | UPP2; |
| Pyruvate metabolism | 0.0043 | ME1; |
| Ubiquitin mediated proteolysis | 0.0051 | SOCS3; |
| Glycerophospholipid metabolism | 0.0092 | PHOSPHO1; |
Genes in bold are upregulated.
Expression Patterns of the PCK1 and ME1 Genes
Among the upregulated genes, the largest fold change was observed in the cytosolic form of PCK1, while only a 2-fold change was found in ME1 (Table 2). In a previous study, the ME1 gene was suggested to play a key role in fat biosynthesis in capons [14]. At the same time, microarray analysis showed that the PCK1 gene exhibited the largest fold increase in capons. Therefore, qRT-PCR was carried out to analyze the expression patterns of the ME1 and PCK1 genes. Interestingly, we found that the expression of the ME1 gene differed significantly between the capon and control groups only at 23 weeks of age, but not at 31 weeks of age (Figure 3). Thus, our results showed that expression of the ME1 gene was associated with caponization age but not androgen status in male chickens.
Figure 3. Relative mRNA expression of the ME1 gene in the different groups.

Twelve livers each from the control and capon groups (of chickens with different ages) were selected for carrying out qRT-PCR. Results are presented as means ± SE; *, P<0.05; **, P<0.01.
In contrast, there was a significant difference in the expression of the PCK1 gene between the control and capon groups and between the capon and embed groups, irrespective of age. At the same time, the expression of the PCK1 gene showed no significant difference between the control and embed groups, irrespective of age (Figure 4). These results indicated that the expression of the PCK1 gene was negatively regulated by androgen status.
Figure 4. Relative mRNA expression of PCK1 in different groups.
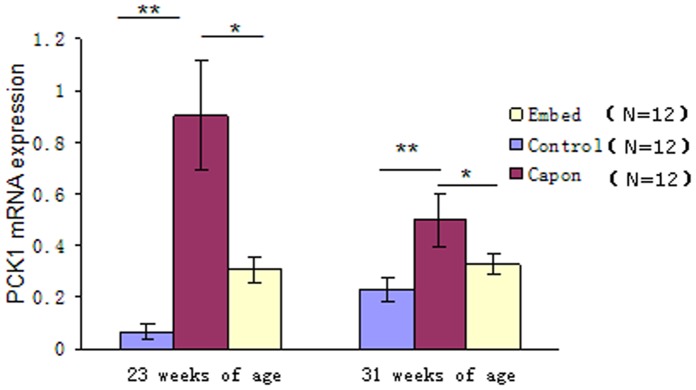
Twelve livers each from the control and capon groups (at different ages) were selected for carrying out qRT-PCR. When significant differences were found between the 2 groups, 12 livers from the embed group were also subjected to qRT-PCR. Results are presented as means ± SE; *, P<0.05; **, P<0.01.
Discussion
Androgen Status Negatively Affected Fat Accumulation in Male Chickens
Castration has been reported to result in an increase in fat accumulation over the longissimus muscle in male bulls or rams, more backfat in male boars [29], and an obvious increase in subcutaneous, intercellular, and abdominal fat in male chickens [2]–[5], which is consistent with the findings of our present study. Additionally, an increase in proliferation capacity and a loss of differentiation capacity were observed in epididymal pre-adipocytes in castrated rats [7].
Castration primarily decreases androgen levels in male animals due to the removal of the male testes. The primary and most well-known androgen is testosterone, which is an important determinant of body composition in male mammals [30], [31]. In men, abdominal obesity is usually associated with low serum testosterone levels [32]–[34]. At the same time, testosterone supplementation in healthy, young, hypogonadal men can result in a decrease in fat mass [35]–[39]. Likewise, testosterone supplementation increases skeletal muscle mass and decreases fat mass in mice [11]. In our study, we also found that serum testosterone levels were negatively correlated with abdominal fat accumulation in male chickens, irrespective of age while testosterone implantation resulted in a significant decrease in abdominal fat, which is consistent with a previous observation [14]. The results suggested that androgen status negatively affected fat accumulation in male chickens.
Liver Microarray Analysis
Capons can accumulate lipids in the body, which enhances flavor and meat juiciness when compared with intact cockerels [1], [5], [40]. Therefore, it was expected that the largest proportion of upregulated genes would be involved in lipid metabolism. Additionally, previous studies have indicated that the Jak-STAT signaling pathway plays a key role in innate immunity [41]–[43]. Thus, our results suggested that caponization increases the immune response in male chickens, which is consistent with another previous study [44].
Androgen Status Negatively Influenced PCK1 Gene Expression in Male Chickens
PCK1 catalyzes the conversion of oxaloacetate to phosphoenolpyruvate, the rate-limiting step in hepatic and renal gluconeogenesis and adipose glyceroneogenesis, and is expressed at high levels in liver, kidney, and adipose tissue [45]. In the liver, expression of the PCK1 gene at the transcriptional level is stimulated by a number of hormones, including glucagon, cAMP, glucocorticoids, and thyroid hormone [46]–[50], but is inhibited by insulin [48], [51], [52]. However, the mechanism through which testosterone regulates expression of the PCK1 gene has not been reported. Importantly, the results of our current study suggested that testosterone negatively regulates PCK1 mRNA.
An increasing number of studies have shown that the PCK1 gene plays a crucial role in multiple physiological processes in mammalian species and is involved in obesity, insulin resistance (type 2 diabetes mellitus, T2DM), and the mammary gland [53]–[65]. In chicken livers, the main form of PCK is mitochondrial PCK, also called PCK2; in contrast to PCK2, PCK1 plays an important role in gluconeogenesis in the kidney [66], [67]. Presently, the PCK1 gene has not been reported to be involved in glyceroneogenesis in avian livers. In our study, the results showed that PCK1 mRNA expression had a positive relationship with abdominal fat accumulation in male chickens, suggesting that the PCK1 gene plays a crucial role in lipogenesis in capons.
The Mechanism through which Androgen Status Affects Adipogenesis in Male Chickens
In castrated rats, androgen status is thought to affect adipogenesis from deep intra-abdominal pre-adipocytes through altered MAP kinase cascade/Fos signaling pathways [8]. In men, testosterone affects adipogenesis by regulation of the activities of lipoprotein lipase (LPL) and hormone-sensitive lipase (HSL) [12], [68]. A previous study indicated that caponization increased ME1 mRNA expression at 26 weeks of age in male chickens [15]. This could be explained by the fact that ME1 catalyzes the oxidative decarboxylation of malate and simultaneously generates reduced NAPD, which is involved in the de novo synthesis of fatty acid. According to our results, however, the expression of the ME1 gene was mainly affected by the age at castration and not by androgen status, whereas the mRNA expression of the PCK1 gene was mainly regulated by androgen status and not by age at castration. Therefore, we suggest that androgen status affects fat accumulation in male chickens by negatively regulating the expression of PCK1 gene. Additionally, our microarray data found no differences in the expression levels of LPL and HSL genes between capons and intact male chickens, implying that avian species and mammals possess different mechanisms through which androgen status affects adipogenesis. This difference could be partly explained by the fact that the sites to lipogenesis are highly variable between avian species and mammals [13], [69]. For example, in mammals, the liver and adipose tissue are the 2 major sites of fatty acid production, whereas in avian species the liver is the main lipogenic site. Additionally, Human adipose tissue has a poor capacity to synthesize fatty acids de novo compared with that of the rat [70], which could explain the differences observed between humans and rats.
Supporting Information
capon_vs_control_Result: upregulated and downregulated genes.
(RAR)
Affymetrix GeneChip technical manual.
(RAR)
all_expression_signal.
(RAR)
Acknowledgments
We thank Professor Guoshi Liu of the College of Animal Science and Technology, China Agricultural University, for performing testosterone implantation in the chickens. We thank Professor Linsheng Lian of the College of Animal Science and Technology, Yunnan Agricultural University and Jiaping Huang, Hongwei Cao of Wuding Bureau of animal husbandry, for conducting the caponization operation.
Funding Statement
The authors have no support or funding to report.
References
- 1. Chen KL, Wu CP, Hong YM (2000) Meat quality and carcass traits of capon in comparison with intact male and female Taiwan country chickens. J. Chin. Soc. Anim. Sci. 29: 77–88. [Google Scholar]
- 2. Fennell MJ, Johnson AL, Scanes CG (1990) Influence of androgens on serum concentration of growth hormone in growing castrated and intact chickens. Gen. Comp. Endocrinol. 77: 763–766. [DOI] [PubMed] [Google Scholar]
- 3. Fennell MJ, Scanes CG (1992) Inhibition of growth in chickens by testosterone, 5α-dihydrotestosterone and 19-nortestosterone. Poultry Sci. 71: 357–366. [DOI] [PubMed] [Google Scholar]
- 4. Hsieh CY, Chen KL, Chiou PWS (2001) The lipoprotein composition and structure of capon and incomplete caponized Taiwan country chicken. J. Chin. Soc. Anim. Sci. 30: 229. [Google Scholar]
- 5. Chen KL, Chi WT, Chiou PWS (2005) Caponization and testosterone implantation effects on blood lipid and lipoprotein profile in male chickens. Poultry Sci. 84: 547–552. [DOI] [PubMed] [Google Scholar]
- 6. Lacasa D, Agli B, Moynard D, Giudicelli Y (1995) Evidence for a regional specific control of rat preadipocyte proliferation and differentiation by the androgenic status. Endocrine 3: 789–793. [DOI] [PubMed] [Google Scholar]
- 7. Lacasa D, Garcia E, Henriot D, Agli B (1997) Giudicelli (1997) Site-related specificities of the control by androgenic status of adipogenesis and mitogen-activated protein kinase cascade/c-fos signaling pathways in rat preadipocytes. Endocrinology 138: 3181–3186. [DOI] [PubMed] [Google Scholar]
- 8. Garcia E, Lacasa M, Agli B, Giudicelli Y, Lacasa D (1999) Modulation of rat preadipocyte adipose conversion by androgenic status: involvement of C/EBPs transcription factors. J. Endocrinol. 161: 89–97. [DOI] [PubMed] [Google Scholar]
- 9. Charles C, Jacques G, Jean B, Arthur SL, Rao DC, et al. (2000) Contribution of body fatness and adipose tissue distribution to the age variation in serum steroid hormone concentrations in men: the HERITAGE Family Study. J. Clin. Endocrinol. Metab. 85: 1026–1031. [DOI] [PubMed] [Google Scholar]
- 10. Rajan S, Jorge NA, Wayne ET, Nestor FG, Shalender B (2003) Androgens stimulate myogenic differentiation and inhibit adipogenesis in C3H 10T1/2 pluripotent cells through an androgen receptor-mediated pathway. Endocrinology 144: 5081–5088. [DOI] [PubMed] [Google Scholar]
- 11. Pasquali R (2006) Obesity and androgens: facts and perspectives. Fertil. Steril. 85: 1319–1340. [DOI] [PubMed] [Google Scholar]
- 12. Karine B, Nadeau MI, Perreault M, Veilleux A, Drolet R, et al. (2010) Effects of androgens on adipocyte differentiation and adipose tissue explant metabolism in men and women. Clin. Endocrinol. 72: 176–188. [DOI] [PubMed] [Google Scholar]
- 13. Chapman MT (1980) Animal lipoproteins: chemistry, structure and comparative aspects. J. Lipid Res. 21: 789–852. [PubMed] [Google Scholar]
- 14. Chen KL, Chi WT, Chu C, Chen RS, Chiou PWS (2007) Effect of caponization and testosterone implantation on hepatic lipids and lipogenic enzymes in male chickens. Poultry Sci. 86: 1754–1759. [DOI] [PubMed] [Google Scholar]
- 15. Schena M, Shalon D, Davis RW, Brown PO (1995) Quantitative monitoring of gene expression patterns with a complementary DNA microarray. Science 270: 467–470. [DOI] [PubMed] [Google Scholar]
- 16. DeRisi JL, Penland L, Brown PO, Bittner ML, Meltzer PS, et al. (1996) Use of a cDNA microarray to analyse gene expression patterns in human cancer. Nat. Genet. 14: 457–460. [DOI] [PubMed] [Google Scholar]
- 17. DeRisi JL, Iyer VR, Brown PO (1997) Exploring the metabolic and genetic control of gene expression on a genomic scale. Science 278: 680–686. [DOI] [PubMed] [Google Scholar]
- 18. Kononen J, Lukas B, Anne K, Maarit B, Peter S, et al. (1998) Tissue microarrays for high-throughput molecular profiling of tumor specimens. Nat. Med. 4: 844–847. [DOI] [PubMed] [Google Scholar]
- 19. Duggan DJ, Michael B, Chen YD, Paul M, Trent JM (1999) Expression profiling using cDNA microarrays. Nat. Genet. 21: 10–14. [DOI] [PubMed] [Google Scholar]
- 20. Shoemaker DD, Schadt EE, Armour CD, He YD, Garrett EP, et al. (2001) Experimental annotation of the human genome using microarray technology. Nature 409: 922–927. [DOI] [PubMed] [Google Scholar]
- 21. David JL, Helin D, Michael CB, Maximillian TF, Michael VG, et al. (1996) Expression monitoring by hybridization to high-density oligonucleotide arrays. Nat. Biotechnol. 14: 1675–1680. [DOI] [PubMed] [Google Scholar]
- 22. Aron CE, Leah RT, Pengchin C, Roderick VJ, deFeo G, et al. (2006) Replacing cRNA targets with cDNA reduces microarray cross-hybridization. Nat. Biotechnol. 24: 1071–1073. [DOI] [PubMed] [Google Scholar]
- 23. Chen KL, Wu CP, Chou RRG (2000) Effect of caponization age on growth performance and postmortem change in muscles of Taiwan country chicken. J. Agric. Assoc. Chin. 1: 54–63. [Google Scholar]
- 24.Rosalyn SY, Solomon AB (1976) Methods in Radioimmunoassay of Peptide Hormones. North-Holland Pub Co, New York, U.S.A.
- 25. Rafael AI (2003) Exploration, normalization, and summaries of high density oligonucleotide array probe level data. Biostatistics 4: 249–264. [DOI] [PubMed] [Google Scholar]
- 26. Storey JD (2002) A direct approach to false discovery rates. J. Roy. Stat. Soc. Ser. B 64: 479–498. [Google Scholar]
- 27. Larionov A, Krause A, Miller W (2005) A standard curve based method for relative real time PCR data processing. BMC Bioinformatics 21 6: 62. [DOI] [PMC free article] [PubMed] [Google Scholar]
- 28.Steel RGD, Torrie JH (1960) Principles and Procedures of Statistics. New York: McGraw.
- 29. Field RA (1971) Effect of castration on meat quality and quantity. J. Animal Sci. 32: 849–858. [DOI] [PubMed] [Google Scholar]
- 30. Wilson JD (1988) Androgen abuse by athletes. Endocr. Rev. 9: 181–199. [DOI] [PubMed] [Google Scholar]
- 31. Bhasin S, Woodhouse L, Storer TW (2001) Proof of the effect of testosterone on skeletal muscle. J. Endocrinol. 170: 27–38. [DOI] [PubMed] [Google Scholar]
- 32. Pasquali R, Casimirri F, Cantobelli S, Melchionda N, Morselli AM, et al. (1991) Effect of obesity and body fat distribution on sex hormones and insulin in men. Metabolism 40: 101–104. [DOI] [PubMed] [Google Scholar]
- 33. Khaw KT, Barrett-Connor E (1992) Lower endogenous androgens predict central adiposity in men. Ann. Epidemiol. 2: 675–682. [DOI] [PubMed] [Google Scholar]
- 34. Gapstur SM, Gann PH, Kopp P, Colangelo L, Longcope C, et al. (2002) Serum androgen concentrations in young men: a longitudinal analysis of associations with age, obesity, and race. The CARDIA male hormone study, Cancer Epidemiol. Biomarker Prev. 11: 1041–1047. [PubMed] [Google Scholar]
- 35. Bhasin S, Storer TW, Berman N, Yarasheski KE, Clevenger B, et al. (1997) A replacement dose of testosterone increases fat-free mass and muscle size in hypogonadal men. J. Clin. Endocrinol. Metab. 82: 407–413. [DOI] [PubMed] [Google Scholar]
- 36. Katznelson L, Finkelstein JS, Schoenfeld DA, Rosenthal DI, Anderson EJ, et al. (1996) Increase in bone density and lean body mass during testosterone administration in men with acquired hypogonadism. J. Clin. Endocrinol. Metab. 81: 4358–4365. [DOI] [PubMed] [Google Scholar]
- 37. Brodsky IG, Balagopal P, Nair KS (1996) Effects of testosterone replacement on muscle mass and muscle protein synthesis in hypogonadal men–a clinical research center study. J. Clin. Endocrinol. Metab. 81: 3469–3475. [DOI] [PubMed] [Google Scholar]
- 38. Snyder PJ, Peachey H, Berlin JA, Hannoush P, Haddad G, et al. (2000) Effects of testosterone replacement in hypogonadal men. J. Clin. Endocrinol. Metab. 85: 2670–2677. [DOI] [PubMed] [Google Scholar]
- 39. Wang C, Swerdloff RS, Iranmanesh A, Dobs A, Snyder PJ, et al. (2000) Transdermal testosterone gel improves sexual function, mood, muscle strength, and body composition parameters in hypogonadal men. Testosterone Gel Study Group. J. Clin. Endocrinol. Metab. 85: 2839–2853. [DOI] [PubMed] [Google Scholar]
- 40. Chen KL, Hsieh TY, Chiou PWS (2006) Caponization effects on growth performance and lipid metabolism in Taiwan country chicken cockerels. Asian-Aust. J. Anim. Sci 19: 438–443. [Google Scholar]
- 41. Meraz MA, White JM, Sheehan KCF, Bach EA, Rodig SJ, et al. (1996) Targeted disruption of the Stat1 gene in mice reveals unexpected physiologic specificity in the JAK–STAT signaling pathway. Cell 84: 431–442. [DOI] [PubMed] [Google Scholar]
- 42. Murray PJ (2007) The Jak-STAT signaling pathway: input and output integration. J. Immunol. 178: 2623–2629. [DOI] [PubMed] [Google Scholar]
- 43. Dostert C, Jouanguy E, Irving P, Troxler L, Arnoux LG, et al. (2005) The Jak-STAT signaling pathway is required but not sufficient for the antiviral response of drosophila. Nat. Immunol. 6: 946–953. [DOI] [PubMed] [Google Scholar]
- 44. Chen KL, Tsay SM, Chiou PWS, Chen TW, Weng BC (2010) Effect of caponization and testosterone implantation on immunity in male chickens. Poultry Sci. 88: 887–894. [DOI] [PubMed] [Google Scholar]
- 45.Tilghman SM, Ballard FJ, Hanson RW (1976) Hormonal regulation of phosphoenolpyruvate carboxykinase (GTP) in mammalian tissues p. 47–91. In R. W. Hanson and M. A. Mehlman (ed.), Gluconeogenesis: Its Regulation in Mammalian Species. Wiley and Sons, New York.
- 46. Wicks WD, Lewis W, Mickibbin JB (1972) Induction of phosphoenolpyruvate carboxykinase by N6, O2′-dibutyryl cyclic amp in rat liver. Biochim. Biophys. Acta. 264: 177–185. [DOI] [PubMed] [Google Scholar]
- 47. Tilghman SM, Hanson RW, Resheft L, Hopgoodt MF, Ballardt FJ (1974) Rapid loss of translatable messenger RNA of phosphoenolpyruvate carboxykinase during glucose repression in liver. Proc. Natl. Acad. Sci. U. S. A. 71: 1304–1308. [DOI] [PMC free article] [PubMed] [Google Scholar]
- 48. Gunn JM, Hanson RW, Meyuhas O, Reshef L, Ballarde FJ (1975) Glucocorticoids and the regulation of phosphoenolpyruvate carboxykinase (Guanosine Triphosphate) in the rat. Biochem. J. 150: 195–203. [DOI] [PMC free article] [PubMed] [Google Scholar]
- 49. Muller MJ, Thomsen A, Sibrowski W, Seitz HJ (1982) 3,5,3′ Vimiodothyronine-induced synthesis of rat liver phosphoenolpyruvate carboxykinase. Endocrinology 111: 1469–1475. [DOI] [PubMed] [Google Scholar]
- 50. Andreone TL, Beale EG, Bar RS, Granner DK (1982) Insulin decreases phosphoenolpyruvate carboxykinase (GTP) mRNA activity by a receptor-mediated process. J. Biol. Chem. 257: 35–38. [PubMed] [Google Scholar]
- 51. Sasaki K, Cripe TP, Koch SR, Andreone TL, Petersen DD, et al. (1984) Multihormonal regulation of phosphoenolpyruvate carboxykinase gene transcription. J. Biol. Chem. 259: 15242–15251. [PubMed] [Google Scholar]
- 52. Zhang Y, Chen W, Li R, Li Y, Ge Y, et al. (2011) Insulin-regulated Srebp-1c and Pck1 mRNA expression in primary hepatocytes from zucker fatty but not lean rats is affected by feeding conditions. PLoS One 6: e21342. [DOI] [PMC free article] [PubMed] [Google Scholar]
- 53. Valera A, Pujol A, Pelegrin M, Bosch F (1994) Transgenic mice overexpressing phosphoenolpyruvate carboxykinase develop non-insulin-dependent diabetes mellitus. Proc. Natl. Acad. Sci. U. S. A. 91: 9151–9154. [DOI] [PMC free article] [PubMed] [Google Scholar]
- 54. She P, Shiota M, Shelton KD, Chalkley R, Postic C, et al. (2000) Phosphoenolpyruvate carboxykinase is necessary for the integration of hepatic energy metabolism. Mol. Cell. Biol. 20: 6508–6517. [DOI] [PMC free article] [PubMed] [Google Scholar]
- 55. Sun Y, Liu S, Ferguson S, Wang L, Klepcyk P, et al. (2002) Phosphoenolpyruvate carboxykinase overexpression selectively attenuates insulin signaling and hepatic insulin sensitivity in transgenic mice. J. Biol. Chem. 277: 23301–23307. [DOI] [PubMed] [Google Scholar]
- 56. She P, Burgess SC, Shiota M, Flakoll P, Donahue EP, et al. (2003) Mechanisms by which liver-specific PEPCK knockout mice preserve euglycemia during starvation. Diabetes 52: 1649–1654. [DOI] [PubMed] [Google Scholar]
- 57. Cao H, vander VE, Ban MR, Hanley AJ, Zinman B, et al. (2004) Promoter polymorphism in PCK1 (phosphoenolpyruvate carboxykinase gene) associated with type 2 diabetes mellitus. J. Clin. Endocrinol. Metab. 89: 898–903. [DOI] [PubMed] [Google Scholar]
- 58. Hakimi P, Johnson MT, Yang J, Lepage DF, Conlon RA, et al. (2005) Phosphoenolpyruvate carboxykinase and the critical role of cataplerosis in the control of hepatic metabolism. Nutr. Metab. (Lond). 2: 33. [DOI] [PMC free article] [PubMed] [Google Scholar]
- 59. Gomez-Valades AG, Vidal-Alabro A, Molas M, Boada J, Bermudez J, et al. (2006) Overcoming diabetes-induced hyperglycemia through inhibition of hepatic phosphoenolpyruvate carboxykinase (GTP) with RNAi. Mol. Ther. 13: 401–410. [DOI] [PubMed] [Google Scholar]
- 60. Beale EG, Harvey BJ, Forest C (2007) PCK1 and PCK2 as candidate diabetes and obesity genes. Cell. Biochem. Biophys. 48: 89–95. [DOI] [PubMed] [Google Scholar]
- 61. Gomez-Valades AG, Mendez-Lucas A, Vidal-Alabro A, Blasco FX, Chillon M, et al. (2008) Pck1 gene silencing in the liver improves glycemia control, insulin sensitivity, and dyslipidemia in db/db mice. Diabetes 57: 2199–2210. [DOI] [PMC free article] [PubMed] [Google Scholar]
- 62. Rees SD, Britten AC, Bellary S, Ohare JP, Kumar S, et al. (2009) The promoter polymorphism −232C/G of the PCK1 gene is associated with type 2 diabetes in a UK-resident South Asian population. BMC Med. Genet. 10: 83. [DOI] [PMC free article] [PubMed] [Google Scholar]
- 63. Hsieh CW, Millward CA, DeSantis D, Pisano S, Machova J, et al. (2009) Reduced milk triglycerides in mice lacking phosphoenolpyruvate carboxykinase in mammary gland adipocytes and white adipose tissue contribute to the development of insulin resistance in pups. J. Nutr. 139: 2257–2265. [DOI] [PMC free article] [PubMed] [Google Scholar]
- 64. Millward CA, DeSantis D, Hsieh CW, Heaney JD, Pisano S, et al. (2010) Phosphoenolpyruvate carboxykinase (Pck1) helps regulate the triglyceride/fatty acid cycle and development of insulin resistance in mice. J. Lipid Res. 51: 1452–1463. [DOI] [PMC free article] [PubMed] [Google Scholar]
- 65. Hsieh CW, Huang C, Bederman I, Yang J, Beidelschies M, et al. (2011) Function of phosphoenolpyruvate carboxykinase in mammary gland epithelial cells. J. Lipid Res. 52: 1352–1362. [DOI] [PMC free article] [PubMed] [Google Scholar]
- 66. Cook JS, Sharon LW, Garcia-ruiz JP, Hod Y, Hanson RW (1986) Nucleotide sequence of the mRNA encoding the cytosolic form of phosphoenolpyruvate carboxykinase (GTP) from the chicken. Proc. Natl. Acad. Sci. U. S. A. 83: 7583–7587. [DOI] [PMC free article] [PubMed] [Google Scholar]
- 67. Watford M, Hod Y, Chiao YB, Utter MF, Hanson RW (1981) The unique role of the kidney in gluconeogenesis in the chicken. J. Biol. Chem. 256: 10023–10027. [PubMed] [Google Scholar]
- 68. Marin P, Oden B, Bjorntorp P (1995) Assimilation and mobilization of triglycerides in subcutaneous abdominal and femoral adipose tissue in vivo in men: effects of androgens. J. Clin. Endocrinol. Metab. 80: 239–243. [DOI] [PubMed] [Google Scholar]
- 69. Florence G, Pascal F, Isabelle D (2001) ADD-1/SREBP-1 is a major determinant of tissue differential lipogenic capacity in mammalian and avian species. J. Lipid Res. 42: 106–113. [PubMed] [Google Scholar]
- 70. Earl S, Joseph AG, Edgar SG (1971) Comparative aspects of lipogenesis in mammalian tissues. Metabolism 20: 54–62. [DOI] [PubMed] [Google Scholar]
Associated Data
This section collects any data citations, data availability statements, or supplementary materials included in this article.
Supplementary Materials
capon_vs_control_Result: upregulated and downregulated genes.
(RAR)
Affymetrix GeneChip technical manual.
(RAR)
all_expression_signal.
(RAR)