

Abstract
Objective
To determine if a prediction rule for hospital mortality using dynamic variables in response to treatment of hypotension in patients with sepsis performs better than current models
Design
Retrospective cohort study
Setting
All intensive care units at a tertiary care hospital
Patients
Adult patients admitted to intensive care units between 2001 and 2007 of whom 2,113 met inclusion criteria and had sufficient data
Interventions
None
Measurements and Main Results
We developed a prediction algorithm for hospital mortality in patients with sepsis and hypotension requiring medical intervention using data from the Multiparameter Intelligent Monitoring in Intensive Care II (MIMIC-II database). We extracted 189 candidate variables, including treatments, physiologic variables and laboratory values collected before, during and after a hypotensive episode. Thirty predictors were identified using a genetic algorithm on a training set (n=1500), and validated with a logistic regression model on an independent validation set (n=613). The final prediction algorithm used included dynamic information and had good discrimination (AUC = 82.0%) and calibration (Hosmer-Lemeshow C statistic = 10.43, p=0.06). This model was compared to APACHE IV using reclassification indices and was found to be superior with a NRI of 0.19 (p<0.001) and an IDI of 0.09 (p<0.001).
Conclusions
Hospital mortality predictions based on dynamic variables surrounding a hypotensive event is a new approach to predicting prognosis. A model using these variables has good discrimination and calibration, and offers additional predictive prognostic information beyond established ones.
Keywords: Severity of Illness Index, Hospital Mortality, Sepsis, Data Mining, Physiologic Reserve
Introduction
A number of scoring systems have been developed for use in critically ill patients to determine disease severity and predict mortality. Commonly used outcome prediction scores include the Acute Physiology and Chronic Health Evaluation (APACHE) scores (1), Simplified Acute Physiology Scores (SAPS) (2), and the Mortality Probability Models (MPM)(3). These are based on a combination of variables that reflect pre-existing health as well as variables that reflect physiologic derangement due to acute illness. The first two systems rely on the worst physiologic variables collected within 24 hours of intensive care unit (ICU) admission (4). While these scoring systems have the potential to inform prognosis and resource allocation retrospectively at a cohort level in the ICU (5), their use has been mostly restricted to clinical trials (6), for case-mix determination in retrospective data analyses (7) and benchmarking ICU performance (8). This is largely due to the observation that these scoring systems perform well in predicting outcome at the group level, but continue to perform poorly when predicting survival in individual patients.
There are a number of reasons for the limited predictive ability of current systems. Pertinent causal factors such as genetic factors may be excluded (4). Recently, it has been shown that identification of “worst” values over a day by clinicians is biased (9), which may partially contribute to lower prediction performance than should be possible. In addition to this, scores used to benchmark ICU performance can only use information that is not influenced by local practice (admission and following 24 hours) and therefore do not benefit from the potential prognostic value of later observations.
Additional factors that are currently not well understood may also exist. Recent research has emphasized the importance of early goal directed therapy in reducing mortality from septic shock (10), increasing the need for accurate early warning systems. Changes in the physiologic variables measured within hours of this early critical period may be more predictive of outcome than focusing on the worst values measured within the day after ICU admission. While current scoring systems such as APACHE (1, 11, 12) try to capture the severity of the initial insult, they are likely limited in their ability to capture the “physiologic reserve” of a patient to respond to this insult because they tend to focus on the worst recorded value over 24 hours, and not on the variability in an individual’s immediate response to the physiologic insult (for example hypotension) and its treatment. Additionally, current severity scoring systems have been developed using a knowledge-driven approach where predictors are chosen based on known clinical variables associated with poor outcome. Recent developments in the field of genetic epidemiology (the study of the role of genetic factors in determining health in populations) have demonstrated that study designs which use a heuristic and data-driven approach to select predictors (13) have the potential to discover new causal factors of disease.
Unfortunately, most ICU databases lack sufficient information to fully characterize critical events such as the development of hypotension in sepsis. These variables are captured in MIMIC II (14), an open-access ICU research database that contains highly granular data including minute-by-minute changes in hemodynamic and other physiologic data as well as time-stamped treatments and their dosage, e.g. fluids, blood products, medications. Databases such as these can offer a extremely large number of potential predictive variables, and use of dimensionality reduction optimization procedures such as genetic algorithms (15) should be used in order to select candidate variables for predictive modeling.
In this study, we set out to determine if dynamic variables that change with the onset and treatment of hypotension in septic shock patients can provide prognostic information for mortality beyond the standard variables used in current severity scoring systems. Variables used for inclusion in our final prediction rule were selected via a combined heuristic and automated approach, with the latter approach employing a genetic algorithm, in order to discover new predictors of mortality.
Materials and Methods
Patient Population
MIMIC II is an open-access research database that encompasses 32,075 patients (in version 2.6) admitted to the medical and surgical at the Beth Israel Deaconess Medical Center (BIDMC, Boston, MA) since 2002 (14) and is freely available on PhysioNet (16). An Institutional Review Board (IRB) approval was obtained from both the Massachusetts Institute of Technology (MIT) and BIDMC for the development, maintenance and public use of a de-identified ICU database. This database contains high-temporal resolution data including lab results, electronic documentation, bedside monitor trends and waveforms.
Using the MIMIC II database, we identified 6,970 patients (21.7%) that matched the definition of sepsis and severe sepsis proposed by Angus et al. (17) of whom 2,155 (6.7%):
Had two consecutive nurse-verified recordings of mean arterial blood pressure below 60 mmHg (18);
Received vasopressors and/or fluid resuscitation from the onset of the event to its end.
42 patients (2.7%) with more than 50% missing data were excluded from further study leaving 2,113 patients in the final dataset (Figure 1).
Figure 1.
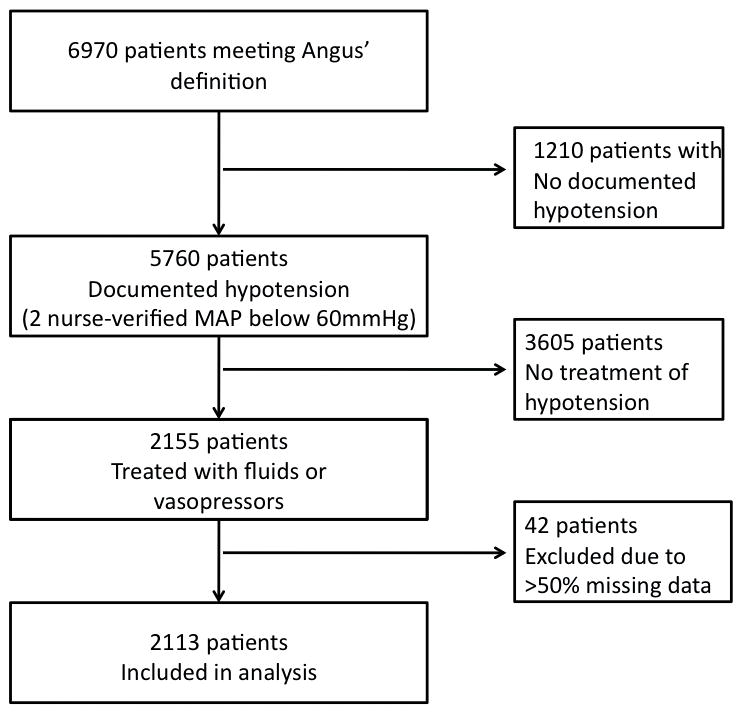
Patient record selection. Using the MIMIC II database, we identified 2,113 patients that matched the ICD-9 and procedure codes defining severe sepsis (Angus et al. 2001), met the definition of hypotension (at least 2 nurse-verified MAP recordings below 60mmHg), and required initiation of fluid resuscitation or change in or increase of vasopressors. Patients with more than 50% missing data were excluded.
For each patient record, we extracted at admission or over three different time windows (before, during and after the onset of the hypotensive episode) the following available variables from the database, (Figure 2):
Figure 2.
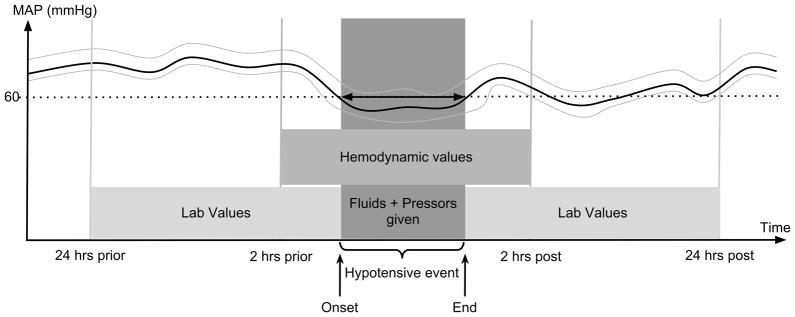
Dynamic variables extracted from MIMIC II. Physiologic variables 2 hours before the onset, during, and 2 hours after the end of hypotension, as well as laboratory values 24 hours before the onset and 24 hours after the end of hypotension were extracted. In addition, demographic and other baseline variables were extracted.
Demographic data: Age (years), weight (kg), height (cm).
Hemodynamic variables: Hypotensive event length (hrs) and time from admission to onset of the hypotensive event (hrs), arterial blood pressure components (systolic, diastolic, mean in mmHg), central venous pressure (mmHg), heart rate (bpm), peripheral arterial oxygen saturation (%), and respiratory rate (rpm) 2 hours before the onset, during, and 2 hours after the termination of the hypotensive event
Lab and clinical values: Patients’ lab results during the 24 hours before the onset and after the end of the hypotensive event: PaO2 (mmHg), FiO2 (mmHg/torr), Glasgow Coma Scale (19), temperature (°C), arterial pH (units), bicarbonate (mEq/L), Blood Urea Nitrogen (BUN, mg/dL), hematocrit (%), hemoglobin (g/dL), platelets (K/μL), calcium (mg/dL), chloride (mEq/L), creatinine (mg/dL), glucose (mg/dL), lactate (mmol/L), magnesium (mg/dL), phosphorous (mg/dL), potassium (mEq/L), sodium (mEq/L), white blood cell (WBC) count (K/μL), total bilirubin (mg/dL), alanine transaminase - ALT (IU/L), PaCO2 (mmHg), Albumin (g/dL), and INR.
Established severity of illness scores: Only SAPS-I, APS and SOFA can be automatically calculated from the database, and thus SAPS-I was used rather than SAPS-II. APACHE-IV was calculated after manual review of discharge summaries to extract the additional necessary information. Co-morbidities were scored according to the van Walraven comorbidity measure, which weights each of the 30 comorbidities present in the Elixhauser score with a coefficient derived from 228,565 hospital admissions (20, 21).
Treatment: The amount of uid (mL) given during the event. The administration (or not) of any dose of the following vasopressors: dopamine, epinephrine, norepinephrine, phenylephrine, vasopressin and dobutamine, and finally, the presence of mechanical ventilation and renal replacement therapy.
Outcome: For each patient, hospital mortality was extracted from the database.
Clinically meaningful non-linear transforms of raw physiological variables were derived: the PaO2/FiO2 ratio (mmHg/torr), heart rate to systolic blood pressure ratio (bpm/mmHg) (also known as the “shock index” (22, 23)) and the BUN to creatinine ratio. Variables known to follow an exponential distribution such as urine output, time from admission to hypotensive episode, length of hypotensive episode and SpO2, were log-transformed. For variables typically sampled at a rate of more than one per day, the minimum, median and maximum values were extracted for each time window (before, during and after the hypotensive episode). The standard deviation was also computed for hemodynamic variables, which have higher temporal resolution. Finally, the algebraic difference between “post” and “pre” measurements was computed resulting in a total of 179 variables. Observations outside a physiologically feasible range were excluded. Missing values were imputed by the mean over the training set (see below).
Development of model for predicting hospital mortality
The dataset was split into a training set with the first 1,500 patients (ordered by a randomly allocated ICU identification number) and a validation set with the last 613 patients (29.0%). The training set was used to select variables and train the model while the validation set was kept for external validation of performance.
Given the large number of potential predictors available, care must be taken to prevent over tting of the model to the training observations. As a general rule, the maximum number of predictors to include in a model should be no greater than the number of events (i.e. deaths) in a sample divided by ten (24). With 1,500 training samples and a mortality rate in this sample of 30%, up to 40 variables could potentially be included in the final model. Trying all possible combinations of 40 (or less) variables from a total of 179 potential variables is computationally prohibitive. Therefore, we used a genetic algorithm (GA) to nd the best combination of variables to be included in our model.
A GA is a search heuristic that mimics the mechanisms of DNA replication and natural selection. It was applied on the training set (n=1,500) to identify the optimal combination of variables to be included in our model. In the first iteration of the algorithm, different subsets of all potential predictors are randomly generated and the performance of each is estimated. At each iteration, the subsets of potential predictors showing the best performance are recombined to generate new subsets of the potential predictors. This process is repeated until the performance stops progressing or when the maximum number of iterations has been reached; this evolutionary process therefore selects the most adapted set of predictors with respect to the given performance (15, 25, 26). The GA has been successfully applied to variable selection (27) and in particular on biomedical datasets (28). Technical aspects of the GA are further described in the Supplemental Digital Content 1, where a link to the open-source code developed for this work is also provided.
Parameters that are selected most often with the GA in the training set were subsequently used to fit a multivariate logistic regression model to predict hospital mortality, and model performance (29, 30) was subsequently evaluated in a completely independent test set (n=613). The area under the receiver operating characteristic curve (31) was estimated using the Wilcoxon statistic (32). Model calibration was assessed by calculation of the Hosmer-Lemeshow C-statistic (33) and calibration plots are provided as recommended by Kramer et al. (34) and can be found in the appendix.
The baseline predicted mortality was obtained with APACHE-IV (1) in the test set. Measures of statistical significance for difference with baseline predicted mortality was computed for a conservative comparison of AUCs derived from the same cases (35). Recently, investigators have suggested that a more useful comparative metric of model performance is risk reclassification (36). Therefore, we calculated the Net Reclassification Improvement (NRI) (37) (38), which measures the ability of a new model to reclassify a high risk individual as higher risk, and a low risk individual as lower risk, for our model as compared to APACHE-IV. Finally, the Integrated Discrimination Improvement (IDI) (36) which takes into account the overall joint improvement in sensitivity and specificity of the new model, was also computed in comparison to APACHE-IV.
We also compared our model to traditional severity scores such as SAPS-I, APS, SOFA, the APACHE-III and IV and the Van Walraven co-morbidity score. The Van Walraven score is a modification of the Elixhauser comorbidity score (20), equivalent to the Charlson score (39, 40), which provides a weighting for 30 comorbidities: it is a validated and easily obtainable proxy for comorbid conditions. Scores designed to be measured at admission such as APACHE-IV were computed only at admission, while others were also evaluated for the day following the hypotensive episode. Finally the Complete Septic Shock Score (CSSS) (41), which is severity score for septic shock patients based on APACHE-III variables (11) was computed.
Results
Patient Characteristics
A total of 2,155 patients met the inclusion criteria of sepsis or severe sepsis with documented hypotension requiring medical intervention, of whom 2,113 had enough data. The demographic and clinical characteristics of these patients are shown in Table 1. Median age was 70.3 (57.2–80.3) years and the overall in-hospital mortality was 28.6%. The median amount of crystalloid administered during the hypotensive event was 1.85 L (0.9 – 3.7). Vasopressors were administered to 1,107 patients (52.4%) during this event.1,486 patients (70.3%) were mechanically ventilated, and 249 (11.8%) underwent renal replacement therapy over the time period considered.
Table 1.
| Parameters | Survivors (n=1,508) | Non-Survivors (n=605) | P-value |
|---|---|---|---|
|
| |||
| Patients’ data at admission | |||
|
| |||
| Age (years) | 69.4 (56.6–78.9) | 72.7 (59.9–83.0) | <0.001 |
|
| |||
| Male (%) | 47.3 | 45.5 | 0.439 |
|
| |||
| Ethnicity (%) | |||
| White | 75.1 | 69.4 | 0.007 |
| Black | 8.0 | 6.8 | 0.330 |
| Hispano | 2.8 | 1.8 | 0.199 |
| Asian | 1.9 | 2.0 | 0.847 |
| Other | 12.2 | 20.0 | <0.001 |
|
| |||
| SAPS-I | 16 (12–19) | 19 (15–23) | <0.001 |
|
| |||
| GCS | 13 (8–15) | 10 (7–15) | <0.001 |
|
| |||
| Mean Arterial Blood Pressure (mmHg) | 66.5 (62.5–72.0) | 64.5 (61.0–70.0) | <0.001 |
|
| |||
| Organ Failure (%) | 34.8 | 49.9 | <0.001 |
| Single Organ failure | 3.1 | 2.2 | 0.226 |
| 2 Organ failures | 8.2 | 7.8 | 0.767 |
| 3 organ failures | 8.2 | 7.8 | 0.767 |
| 4 organ failures | 11.7 | 12.6 | 0.568 |
|
| |||
| Hypotensive episode and treatments | |||
|
| |||
| Time to hypotensive episode onset (hrs) | 13.0 (5.3–40.8) | 24.3 (5.9–83.1) | <0.001 |
|
| |||
| Length of hypotensive episode (hrs) | 1.5 (1.0–3.0) | 2.0 (1.0–3.8) | 0.002 |
|
| |||
| Crystalloid (L) administered during hypotensive event | 1.8 (0.8–3.5) | 2.0 (1.0–4.0) | 0.028 |
|
| |||
| Vasopressors used (%) | 48.1 | 63.1 | <0.001 |
| Exactly one | 32.2 | 27.8 | 0.048 |
| Exactly two | 10.6 | 20.2 | <0.001 |
| Exactly three | 4.1 | 11.1 | <0.001 |
| Exactly four | 1.3 | 4.1 | <0.001 |
| Type of vasopressors | |||
| Dobutamine | 2.9 | 7.3 | <0.001 |
| Dopamine | 11.5 | 20.3 | <0.001 |
| Epinephrine | 2.9 | 1.8 | 0.174 |
| Vasopressin | 4.4 | 17.2 | <0.001 |
| Milirone | 4.8 | 2.5 | 0.016 |
|
| |||
| Renal Replacement Therapy (RRT) (%) | 8.4 | 20.5 | <0.001 |
|
| |||
| Mechanical Ventilation (%) | 62.9 | 86.5 | <0.001 |
Continuous values presented as mean (standard deviation) if normally distributed, median (interquartile range) if not normally distributed
The p-value shows the non-parametric Kolmogorov-Smirnov test with the null hypothesis that the two groups come from the same distribution.
Variables in final model
The genetic algorithm was run 500 times and the most frequently selected variables identified by the genetic algorithm were selected for inclusion in the final model (see Table 2). The model dimensionality was set by the GA as explained in the Supplemental Digital Content 1.
Table 2. Description of the variables included in the final multivariate model.
Variables are described and odds ratios are indicated in the column corresponding to the time window at which the variable was considered. Statistically significant coefficients are shown in bolda. A star in the last column indicates when a variable was considered at two different time windows.
| odds ratios (p-value) | |||||
|---|---|---|---|---|---|
| Time window | Admission | Before | During | After | Delta |
| Variables description | |||||
| Age (yr) | 1.289 | ||||
| Urine Output (mL) | 0.790 | ||||
| Shock Index (bpm/mmHg) | 1.215 | ||||
| SOFA score (−) | 1.224 | 1.094 | * | ||
| Van Walraven (−) | 1.168 | ||||
| BUN (mg/dL) | 1.158 | ||||
| Bilirubin (mg/dL) | 1.139 | ||||
| SAPS-I (−) | 1.183 | ||||
| Chloride (mEq/L) | 1.121 | ||||
| INR (−) | 1.077 | 1.127 | * | ||
| BUN/Creatinine (−) | 1.010 | ||||
| Glasgow Coma Scale (−) | 0.868 | 0.969 | |||
| Creatinine (mg/dL) | 1.093 | ||||
| Lowest breathing rate (rpm) | 1.089 | ||||
| Lowest temperature (°C) | 0.958 | 0.915 | * | ||
| Heart Rate standard deviation (bpm) | 0.927 | ||||
| Lowest diastolic blood pressure (mmHg) | 0.925 | ||||
| Alveolar-arterial (A-a) gradient (mmHg) | 1.080 | ||||
| Hypotensive Episode length (hrs) | 1.060 | ||||
| Oxygen Saturationb (SpO2, %) | 1.063 | ||||
| SpO2 Standard Deviation | 1.053 | 1.038 | * | ||
| APS score (−) | 1.059 | ||||
| Higest Lactate (mmol/L) | 1.042 | ||||
| Arterial Partial Oxygen Pressure (PaO2, mmHg) | 1.035 | ||||
| PaO2-FiO2 ratio (−) | 0.968 | ||||
p-values are computed by assuming a chi-square distribution for the ratio of βs over their estimated standard error.
This variable was transformed as follows: log(101-SpO2)
Analysis of model performance by discrimination, calibration, and risk reclassification indices
Our final model had good discrimination with an AUC of 82.0% as well as good calibration with a Hosmer-Lemeshow C statistic of 10.4 (p=0.064). The performance of our model was compared to multiple other models for mortality prediction in Table 3. When using the AUC as a performance metric, our model had the best performance with a statistically significant (p<0.001) improvement of 12.4 percentage points in AUC over APACHE IV, which had an AUC of 69.6%. The NRI based on continuous measures was 0.19 (p<0.001), indicating that on average, 19% of subjects had their hospital mortality predictions from APACHE IV accurately reclassified with our model designed with a genetic algorithm. Similarly, the IDI was 0.09 (p<0.001) indicating that an aggregate measure of sensitivity and specificity was superior for our model when compared to APACHE IV.
Table 3.
Comparing performance of our model (Dynamic Information) with other severity of illness scoring systems on n=613 patients in the test set. Predictions from other models made using either data from admission or with data from the day following the offset of hypotensive episode for models not specifically designed on admission data. P-values for AUC is taken from a 1000 bootstrap of the difference. P-values for NRI and IDI are testing the null hypothesis that there is no difference compared to APACHE-IV for the reclassification indices
| Models | Area Under the ROC Curve (p-value) | Hosmer-Lemeshow C statistic (p-value) | Net Reclassificati on Index (p-value) | Integrated Discrimination Improvement (p-value) |
|---|---|---|---|---|
| CSSS (admission) | 56.0 (0.001) | >1000 (<.001) | −0.23 (<.001) | −0.11 (<.001) |
| SAPS-I (admission) | 53.6 (<.001) | 51.95 (<.001) | −0.21 (<.001) | −0.11 (<.001) |
| Van Walraven | 61.6 (0.008) | 13.45 (0.030) | −0.17 (0.002) | −0.07 (0.005) |
| SOFA (admission) | 62.3 (0.018) | 8.18 (0.095) | −0.06 (0.165) | −0.04 (0.077) |
| APS (admission) | 67.3 (0.106) | 15.75 (0.015) | −0.05 (0.153) | −0.02 (0.106) |
| APACHE-III | 68.7 (0.240) | N.Aa | −0.05 (0.067) | −0.01 (0.208) |
| SOFA (post) | 69.2 (0.406) | 14.06 (0.026) | −0.01 (0.395) | 0.00 (0.453) |
| APACHE-IV | 69.6 (N.A.b) | 42.46c (<.001) | N.A.b | N.A.b |
| APS (post) | 71.2 (0.288) | 13.94 (0.027) | 0.02 (0.323) | 0.01 (0.290) |
| Dynamic Information | 82.0 (<.001) | 10.43 (0.064) | 0.19 (<.001) | 0.09 (<.001) |
Coefficients for calibration of APACHE-III in septic shock population were not found
APACHE-IV served as the comparison model for the calculation of NRI and IDI
APACHE-IV was not be recalibrated since it was only extracted on the test set
Discussion
In this study, we took a novel approach to the development of a hospital mortality prediction algorithm by focusing on dynamic variables surrounding a hypotensive event in patients with sepsis and hypotension. Additionally, we used a combined heuristic and algorithm-driven approach to variable selection. When compared to mortality predictions from APACHE IV, our model had a significantly higher AUC and superior risk reclassification. Direct comparison of our results against APACHE-IV is however not straightforward. First, in terms of discriminative power, APACHE-IV was designed for benchmarking and does not use values recorded after the first day of admission that potentially contains discriminative information, whereas our approach does. Second, in terms of calibration, APACHE-IV does not benefit from a re-calibration on our data since chronic health conditions and admission were only extracted for patients in our validation set. Third, without comparing the performance of our model against APACHE IV in an external cohort, we cannot accurately say that our model outperforms APACHE IV under all circumstances, since the ability of a model to discriminate and calibrate decreases when applied to new populations (42). Thus it is not entirely unexpected that our GA based model outperforms APACHE IV when evaluated using our test set, since our training set was drawn from the same population as the test set. However, the robust performance of our model in predicting hospital mortality is notable, and this new approach to predictive modeling in sepsis using dynamic information in conjunction with a heuristic search algorithm such as the GA is promising.
We believe that focusing on dynamic variables surrounding a hypotensive event allows us to capture the individual variation in the response to both a physiologic insult as well as the response to treatment. Current prognostic scoring systems often predict similar outcomes for patients with the same comorbidities, severity of physiologic injury, and degree of organ dysfunction. In clinical practice, there is often wide inter-individual variability in outcome even when subjects fall within the same risk strata according to these scoring systems. This may be because an important predictor of outcome, the individual’s physiologic reserve (43), has not been captured in these scoring systems. Physiologic reserve may account for the difference in clinical outcome that two patients with identical mortality risks (as traditionally defined by age, severity of illness and co-morbidities) and treatment may have. Bion places a large emphasis on the importance of cellular processes in response to stress and oxygen delivery as the major determinant of this physiologic reserve, which is thought to vary between patients because of genetic differences (44).
Prior studies have attempted to measure aspects of the physiologic reserve. For example, Vallet et al demonstrated that in a uniform population of patients with sepsis and normal lactate levels, survivors have an increase in oxygen delivery in response to dobutamine (45); this finding was subsequently validated by Rhodes et al (46). Identification of subjects with relative adrenal insufficiency with the corticotropin stimulation test may capture another aspect of the physiologic reserve (47). The physiologic reserve is likely to be dependent on the complex interplay between an individual’s genetic background (48) and the physiologic insult. We suspect that after controlling for comorbidities, severity of insult and treatment, the dynamic variables surrounding a hypotensive event allow us to determine the contribution of an individual’s physiologic reserve to prognosis, thus allowing better individual (as opposed to group) predictions of hospital mortality in patients with septic shock.
Dynamic information was included in the model in two ways: inclusion of the “delta” variables (the difference between value after the hypotensive episode and before it) for chloride, GCS, creatinine and PaO2; and the selection of a variable at two different time windows as for SOFA, INR, temperature and SpO2 standard deviation, which altogether accounted for nearly half the variables in the model (46.7%). Variables after the hypotensive episode, while closer in time to the hypotensive episode and therefore believed to have a greater predictive power, only summed up to a third of the selected features. Finally, variables before the hypotensive episode (including at admission) represented half the model’s features.
Interestingly, while the genetic algorithm selected previously known predictors of mortality such as age, urine output, shock index, SOFA score and comorbid conditions as measured by the Van Walraven score (21), we also identified the change in serum chloride levels spanning the 24 hour interval before and after the hypotensive event as a significant predictor of hospital mortality. While this finding is interesting, at this point the association of changes in chloride in response to hypotension and sepsis remain speculative and are currently being investigated within our research group.
Strengths of our study include the novel focus on the dynamic events surrounding a hypotensive event in patients with sepsis, in order to capture the inter-individual variability in the response to septic shock and treatments; this may address why prior prediction rules have been useful at the group level but performed poorly when applied clinically to individual patients. Modeling patient-specific physiologic responses to a specific dose of treatment, e.g. blood pressure rise in response to a certain volume of crystalloids, urine output after a certain dose of diuretic, or level of sedation after a certain dose of benzodiazepine, has the potential to personalize treatment guidelines to a degree never achieved before.
Furthermore, a data-driven approach using a genetic algorithm, which is not dependent on prior known biology, allowed us to select the best predictors for inclusion in our model. The adequate use of a cross-validation technique within the fitness function, in addition to an early-termination criterion during the process of feature selection, also prevented overfitting of our model on the available data, which showed good generalization properties on the test set. Finally, this study also demonstrates the significant potential of electronic health records to contribute to scientific research (49, 50).
There are several limitations to this study. Given that this is a retrospective cohort study, and one that involves a single center, further validation of this prediction algorithm either through a prospective study, or in an independent patient population, is required. Furthermore, calculation of mortality using this prediction algorithm may be burdensome for the busy clinician. However, with the increased use of paperless records and digitalization of ICU data, such algorithms can be embedded in the electronic medical record and automatically calculated to provide real-time mortality predictions with immediate application at the bedside. Ultimately, outcome prediction algorithms can be best fine-tuned using local or regional databases that reflect the patient population and physician practices at each center. Finally, the variables selected for inclusion in our model depended on what was available in MIMIC II. While MIMIC II is a highly granular database, in this version some important predictive variables such as the presence or absence of certain co-morbidities and the likely source of infection (pulmonary vs. intra-abdominal vs. bloodstream) are currently not easily obtained, although future versions of the MIMIC database will be more comprehensive. It is possible that with even higher-dimensional data, the variables ultimately selected for inclusion in our predictive model would be different. Thus the strength of our model may lie in the approach, and not specifically in the exact variables chosen for the final model.
In summary, we have demonstrated that dynamic variables measured at the time of hypotension, and in response to fluid and vasopressor treatment, can strongly predict hospital mortality from septic shock. Additionally, we showed that use of a sophisticated algorithm combined with a data-driven approach to predictor selection is a viable approach to outcomes modeling in patients with sepsis and hypotension. We also identified the additional interesting association between dynamic change in chloride during hypotension and hospital mortality, which may deserve further investigation. While further studies in additional ICU populations are needed to validate this approach and these findings, this study is the first to demonstrate that such an approach has the potential to provide better predictions for hospital mortality, highlighting the role that clinical data mining will increasingly play in both knowledge generation and the way we practice medicine.
Supplementary Material
This document describes the algorithm used to select features for prediction of mortality during the rst hypotensive episode requiring medical intervention in a population of patients with sepsis and severe sepsis. Results are compared with state-of-the-art feature selection techniques and shown equivalent performance. The potential of the Genetic Algorithm as an optimization technique is briefly discussed. The code, on which this research is based, is freely available on Google Code.
Acknowledgments
This work was supported by the Oxford RCUK Centre for Doctoral Training in Healthcare Innovation funded by the RCUK Digital Economy Program to LM.
The National Institute of Health (NIH), and its National Institute of Biomedical Imaging and Bioengineering (NIBIB) under Grant 2R01 EB001659 funded the MIMIC II database.
Footnotes
The authors have not disclosed any potential conflicts of interest
Address for reprints: Louis Mayaud, Institute of Biomedical Engineering (IBME), Department of Engineering Science, University of Oxford, Old Road Campus Research Building (ORCRB), Off Roosevelt Drive, OX3 7DQ, Oxford United Kingdom
References
- 1.Zimmerman JE, Kramer AA, McNair DS, et al. Acute Physiology and Chronic Health Evaluation (APACHE) IV: hospital mortality assessment for today’s critically ill patients. Crit Care Med. 2006;34(5):1297–1310. doi: 10.1097/01.CCM.0000215112.84523.F0. [DOI] [PubMed] [Google Scholar]
- 2.Moreno RP, Metnitz PG, Almeida E, et al. SAPS 3--From evaluation of the patient to evaluation of the intensive care unit. Part 2: Development of a prognostic model for hospital mortality at ICU admission. Intensive Care Med. 2005;31(10):1345–1355. doi: 10.1007/s00134-005-2763-5. [DOI] [PMC free article] [PubMed] [Google Scholar]
- 3.Higgins TL, Teres D, Copes WS, et al. Assessing contemporary intensive care unit outcome: an updated Mortality Probability Admission Model (MPM0-III) Crit Care Med. 2007;35(3):827–835. doi: 10.1097/01.CCM.0000257337.63529.9F. [DOI] [PubMed] [Google Scholar]
- 4.Vincent JL, Moreno R. Clinical review: scoring systems in the critically ill. Crit Care. 2010;14(2):207. doi: 10.1186/cc8204. [DOI] [PMC free article] [PubMed] [Google Scholar]
- 5.Tuman KJ, McCarthy RJ, March RJ, et al. Morbidity and duration of ICU stay after cardiac surgery. A model for preoperative risk assessment. Chest. 1992;102(1):36–44. doi: 10.1378/chest.102.1.36. [DOI] [PubMed] [Google Scholar]
- 6.Cohen J, Guyatt G, Bernard GR, et al. New strategies for clinical trials in patients with sepsis and septic shock. Crit Care Med. 2001;29(4):880–886. doi: 10.1097/00003246-200104000-00039. [DOI] [PubMed] [Google Scholar]
- 7.Zauner CA, Apsner RC, Kranz A, et al. Outcome prediction for patients with cirrhosis of the liver in a medical ICU: a comparison of the APACHE scores and liver-specific scoringsystems. Intensive Care Med. 1996;22(6):559–563. doi: 10.1007/BF01708096. [DOI] [PubMed] [Google Scholar]
- 8.Afessa B, Keegan MT, Hubmayr RD, et al. Evaluating the performance of an institution using an intensive care unit benchmark. Mayo Clin Proc. 2005;80(2):174–180. doi: 10.4065/80.2.174. [DOI] [PubMed] [Google Scholar]
- 9.Hug CW, Clifford GD, Reisner AT. Clinician blood pressure documentation of stable intensive care patients: an intelligent archiving agent has a higher association with future hypotension. Crit Care Med. 2011;39(5):1006–1014. doi: 10.1097/CCM.0b013e31820eab8e. [DOI] [PMC free article] [PubMed] [Google Scholar]
- 10.Rivers E, Nguyen B, Havstad S, et al. Early goal-directed therapy in the treatment of severe sepsis and septic shock. N Engl J Med. 2001;345(19):1368–1377. doi: 10.1056/NEJMoa010307. [DOI] [PubMed] [Google Scholar]
- 11.Knaus WA, Wagner DP, Draper EA, et al. The Apache-Iii Prognostic System - Risk Prediction of Hospital Mortality for Critically Ill Hospitalized Adults. Chest. 1991;100(6):1619–1636. doi: 10.1378/chest.100.6.1619. [DOI] [PubMed] [Google Scholar]
- 12.Sirio CA, Bastos PG, Knaus WA, et al. Apache-Ii Scores in the Prediction of Multiple Organ Failure Syndrome. Archives of Surgery. 1991;126(4):528–528. doi: 10.1001/archsurg.1991.01410280132022. [DOI] [PubMed] [Google Scholar]
- 13.Pearson TA, Manolio TA. How to interpret a genome-wide association study. JAMA. 2008;299(11):1335–1344. doi: 10.1001/jama.299.11.1335. [DOI] [PubMed] [Google Scholar]
- 14.Saeed M, Villarroel M, Reisner AT, et al. Multiparameter Intelligent Monitoring in Intensive Care II: a public-access intensive care unit database. Crit Care Med. 2011;39(5):952–960. doi: 10.1097/CCM.0b013e31820a92c6. [DOI] [PMC free article] [PubMed] [Google Scholar]
- 15.Goldberg D. Genetic Algorithms in Search, Optimization, and Machine Learning. 1. Boston, MA: Addison-Wesley Longman Publishing Co., Inc; 1989. [Google Scholar]
- 16.Goldberger AL, Amaral LA, Glass L, et al. PhysioBank, PhysioToolkit, and PhysioNet: components of a new research resource for complex physiologic signals. Circulation. 2000;101(23):E215–220. doi: 10.1161/01.cir.101.23.e215. [DOI] [PubMed] [Google Scholar]
- 17.Angus DC, Linde-Zwirble WT, Lidicker J, et al. Epidemiology of severe sepsis in the United States: Analysis of incidence, outcome, and associated costs of care. Critical Care Medicine. 2001;29(7):1303–1310. doi: 10.1097/00003246-200107000-00002. [DOI] [PubMed] [Google Scholar]
- 18.Balmes J, Becklake M, Blanc P, et al. American Thoracic Society Statement: Occupational contribution to the burden of airway disease. Am J Respir Crit Care Med. 2003 doi: 10.1164/rccm.167.5.787. [DOI] [PubMed] [Google Scholar]
- 19.Agusti A, Calverley PMA, Celli B, et al. Characterisation of COPD heterogeneity in the ECLIPSE cohort. Respir Res. 2010;11:122. doi: 10.1186/1465-9921-11-122. [DOI] [PMC free article] [PubMed] [Google Scholar]
- 20.Elixhauser A, Steiner C, Harris DR, et al. Comorbidity measures for use with administrative data. Med Care. 1998;36(1):8–27. doi: 10.1097/00005650-199801000-00004. [DOI] [PubMed] [Google Scholar]
- 21.van Walraven C, Austin PC, Jennings A, et al. A modification of the Elixhauser comorbidity measures into a point system for hospital death using administrative data. Med Care. 2009;47(6):626–633. doi: 10.1097/MLR.0b013e31819432e5. [DOI] [PubMed] [Google Scholar]
- 22.Keller AS, Kirkland LL, Rajasekaran SY, et al. Unplanned Transfers to the Intensive Care Unit: The Role of the Shock Index. Journal of Hospital Medicine. 2010;5(8):460–465. doi: 10.1002/jhm.779. [DOI] [PubMed] [Google Scholar]
- 23.Rady MY, Nightingale P, Little RA, et al. Shock Index - a Reevaluation in Acute Circulatory Failure. Resuscitation. 1992;23(3):227–234. doi: 10.1016/0300-9572(92)90006-x. [DOI] [PubMed] [Google Scholar]
- 24.Bishop C. Neural networks and their applications. Review of Scientific Instruments. 1994;65(6):1803–1832. [Google Scholar]
- 25.Houck C, Joines J, Kay M. A genetic algorithm for function optimization: A Matlab implementation. NCSU-IE TR. 1995;95(09) [Google Scholar]
- 26.Muhlenbein H. Evolution in time and space - the parallel genetic algorithm. In: Rawlins G, editor. Foundations of genetic algorithms. 1. San Mateo, CA: Morgan Kaufmann; 1991. pp. 316–337. [Google Scholar]
- 27.Yang J, Honavar V. Feature subset selection using a genetic algorithm. Intelligent Systems and Their Applications, IEEE. 1998;13(2):44–49. [Google Scholar]
- 28.Zwickl D. PhD dissertation. The University of Texas; Austin: 2006. Genetic algorithm approaches for the phylogenetic analysis of large biological sequence datasets under the maximum likelihood criterion. [Google Scholar]
- 29.Dumouchel W, O’Brien F. Integrating a robust option into a multiple regression computing environment. In: Buja A, Tukey P, editors. Computing and graphics in statistics. New York: Springer-Verlag; 1992. pp. 41–48. [Google Scholar]
- 30.Holland P, Welsch R. Robust regression using iteratively reweighted least-squares. Commun Statist Theory Methods. 1977;9:813–827. [Google Scholar]
- 31.Kauczor H-U, Hast J, Heussel CP, et al. CT attenuation of paired HRCT scans obtained at full inspiratory/expiratory position: comparison with pulmonary function tests. Eur Radiol. 2002;12(11):2757–2763. doi: 10.1007/s00330-002-1514-z. [DOI] [PubMed] [Google Scholar]
- 32.Hanley JA, McNeil BJ. The meaning and use of the area under a receiver operating characteristic (ROC) curve. Radiology. 1982;143(1):29–36. doi: 10.1148/radiology.143.1.7063747. [DOI] [PubMed] [Google Scholar]
- 33.Hosmer D, Lemeshow S. Applied Logistic Regression. 2. New York: Wiley; 2000. [Google Scholar]
- 34.Kramer AA, Zimmerman JE. Assessing the calibration of mortality benchmarks in critical care: The Hosmer-Lemeshow test revisited. Critical Care Medicine. 2007;35(9):2052–2056. doi: 10.1097/01.CCM.0000275267.64078.B0. [DOI] [PubMed] [Google Scholar]
- 35.Hanley JA, McNeil BJ. A method of comparing the areas under receiver operating characteristic curves derived from the same cases. Radiology. 1983;148(3):839–843. doi: 10.1148/radiology.148.3.6878708. [DOI] [PubMed] [Google Scholar]
- 36.Pencina MJ, D’Agostino RB, Sr, D’Agostino RB, Jr, et al. Evaluating the added predictive ability of a new marker: from area under the ROC curve to reclassification and beyond. Stat Med. 2008;27(2):157–172. doi: 10.1002/sim.2929. discussion 207–112. [DOI] [PubMed] [Google Scholar]
- 37.Manthey CL, Perera PY, Henricson BE, et al. Endotoxin-induced early gene expression in C3H/HeJ (Lpsd) macrophages. J Immunol. 1994;153(6):2653–2663. [PubMed] [Google Scholar]
- 38.Pencina MJ, D’Agostino RB, Sr, Steyerberg EW. Extensions of net reclassification improvement calculations to measure usefulness of new biomarkers. Stat Med. 2011;30(1):11–21. doi: 10.1002/sim.4085. [DOI] [PMC free article] [PubMed] [Google Scholar]
- 39.Charlson ME, Charlson RE, Peterson JC, et al. The Charlson comorbidity index is adapted to predict costs of chronic disease in primary care patients. Journal of Clinical Epidemiology. 2008;61(12):1234–1240. doi: 10.1016/j.jclinepi.2008.01.006. [DOI] [PubMed] [Google Scholar]
- 40.Charlson ME, Pompei P, Ales K, et al. Development and Validation of a New Method of Classifying Co-Morbidity in Longitudinal-Studies. Clinical Research. 1986;34(2):A360–A360. [Google Scholar]
- 41.Baumgartner JD, Bula C, Vaney C, et al. A Novel Score for Predicting the Mortality of Septic Shock Patients. Critical Care Medicine. 1992;20(7):953–960. doi: 10.1097/00003246-199207000-00010. [DOI] [PubMed] [Google Scholar]
- 42.Altman DG, Vergouwe Y, Royston P, et al. Prognosis and prognostic research: validating a prognostic model. BMJ. 2009;338:b605. doi: 10.1136/bmj.b605. [DOI] [PubMed] [Google Scholar]
- 43.Bion JF. Susceptibility to critical illness: reserve, response and therapy. Intensive Care Med. 2000;26 (Suppl 1):S57–63. doi: 10.1007/s001340051120. [DOI] [PubMed] [Google Scholar]
- 44.Bion JF. Susceptibility to critical illness: reserve, response and therapy. Intensive Care Medicine. 2000;26:S57–S63. doi: 10.1007/s001340051120. [DOI] [PubMed] [Google Scholar]
- 45.Vallet B, Chopin C, Curtis SE, et al. Prognostic value of the dobutamine test in patients with sepsis syndrome and normal lactate values: a prospective, multicenter study. Crit Care Med. 1993;21(12):1868–1875. doi: 10.1097/00003246-199312000-00014. [DOI] [PubMed] [Google Scholar]
- 46.Rhodes A, Lamb FJ, Malagon I, et al. A prospective study of the use of a dobutamine stress test to identify outcome in patients with sepsis, severe sepsis, or septic shock. Crit Care Med. 1999;27(11):2361–2366. doi: 10.1097/00003246-199911000-00007. [DOI] [PubMed] [Google Scholar]
- 47.Annane D, Sebille V, Charpentier C, et al. Effect of treatment with low doses of hydrocortisone and fludrocortisone on mortality in patients with septic shock. JAMA. 2002;288(7):862–871. doi: 10.1001/jama.288.7.862. [DOI] [PubMed] [Google Scholar]
- 48.Holmes CL, Russell JA, Walley KR. Genetic polymorphisms in sepsis and septic shock: role in prognosis and potential for therapy. Chest. 2003;124(3):1103–1115. doi: 10.1378/chest.124.3.1103. [DOI] [PubMed] [Google Scholar]
- 49.Pearson JF, Brownstein CA, Brownstein JS. Potential for electronic health records and online social networking to redefine medical research. Clin Chem. 2011;57(2):196–204. doi: 10.1373/clinchem.2010.148668. [DOI] [PMC free article] [PubMed] [Google Scholar]
- 50.Lee RK, Ladapo Joseph A, Scott Daniel J, Celi Leo A. Interrogating a clinical database to study treatment of hypotension in the critically hill. BMJ Open. 2012;2:e000916. doi: 10.1136/bmjopen-2012-000916. [DOI] [PMC free article] [PubMed] [Google Scholar]
Associated Data
This section collects any data citations, data availability statements, or supplementary materials included in this article.
Supplementary Materials
This document describes the algorithm used to select features for prediction of mortality during the rst hypotensive episode requiring medical intervention in a population of patients with sepsis and severe sepsis. Results are compared with state-of-the-art feature selection techniques and shown equivalent performance. The potential of the Genetic Algorithm as an optimization technique is briefly discussed. The code, on which this research is based, is freely available on Google Code.