

Abstract
Understanding how a magnetic field affects the interaction of magnetic nanoparticles (MNPs) with cells is fundamental to any potential downstream applications of MNPs as gene and drug delivery vehicles. Here, we present a quantitative analysis of how a pulsed magnetic field influences the manner in which MNPs interact with, and penetrate across a cell monolayer. Relative to a constant magnetic field, the rate of MNP uptake and transport across cell monolayers was enhanced by a pulsed magnetic field. MNP transport across cells was significantly inhibited at low temperature under both constant and pulsed magnetic field conditions, consistent with an active mechanism (i.e. endocytosis) mediating MNP transport. Microscopic observations and biochemical analysis indicated that, in a constant magnetic field, transport of MNPs across the cells was inhibited due to the formation of large (>2 μm) magnetically-induced MNP aggregates, which exceeded the size of endocytic vesicles. Thus, a pulsed magnetic field enhances the cellular uptake and transport of MNPs across cell barriers relative to a constant magnetic field by promoting accumulation while minimizing magnetically-induced MNP aggregates at the cell surface.
Keywords: Magnetic field, Superparamagnetic iron oxide nanoparticles, Magnetic targeting, Drug delivery, Bioimaging, Magnetically-guided therapy, Cell-based assays
Interest in magnetic nanoparticles (MNPs) has been considerably raised by their numerous biomedical applications, including cell labeling,1 in vitro cell separation,2,3 drug/gene delivery,4,5 and contrast agents in magnetic resonance imaging (MRI).6,7 Magnetic guiding of MNPs, for example, could be very useful in tissue engineering by facilitating delivery of attached cargoes in a precise, spatially controlled manner. These applications are enabled by the unique physicochemical properties of MNPs, including intrinsic magnetic susceptibility,8,9 small particle sizes,10,11 and multifunctional surface chemistry.12,13 MNPs having an iron oxide core (magnetite (Fe3O4) or maghemite (Fe2O3)) and exhibiting superparamagnetic behavior, often referred to as superparamagnetic iron oxide nanoparticles (SPION) or magnetic iron oxide nanoparticles (MION), have attracted attention due to their relatively low toxicity profile. Their superparamagnetic property insures particle stability under storage and use, while their responsiveness to applied magnetic fields can be exploited for magnetically-guided particle targeting14 or imaging.15
The cellular targeting or transcellular transport of MNPs under the influence of a magnetic force can be differentially enhanced through various pathways.16,17 Previously, we observed that magnetic fields can promote apical-to-basolateral transport of heparin-coated MNPs across epithelial cell monolayers, but only at low particle concentrations.18 Interestingly, transport of MNPs was inhibited at higher particle concentrations. This may be due to the increased tendency of MNPs to form aggregates in suspension at higher concentrations.19 Nanoparticles comprised of bare iron oxide cores are especially susceptible to aggregate formation by van der Waals attraction forces.20 These attractive forces are often overcome through modification of the surface chemistry of MNPs.20–24 Surface modification can improve the stability of MNPs as drug carriers in physiological media,18,25 increase drug/gene targeting efficiency in vivo26 and facilitate the targeting of MNPs to tumor sites.27,28
For individual particles, size,10,11,29 surface chemistry,12,13 and surface charge16 are key factors that affect particle interactions with cells. Nevertheless, even surface-modified MNPs may agglomerate and form large clusters under the influence of a magnetic field due to the induced, magnetic dipole-dipole attractions.30,31 Effects of magnetic fields on the aggregation state of MNPs in the human body are largely unknown. However, animal studies indicate that magnetically-induced MNP aggregates can affect the performance of MNPs in drug targeting and delivery applications.32 Furthermore, magnetically-induced MNP aggregates can clog blood vessels and accumulate in off-target sites.33,34 Because of these known complications, understanding how an applied magnetic field affects the aggregation state of MNPs upon interaction with cells could be important and relevant for optimizing the behavior of MNPs as MRI contrast agents, and as magnetically-guided drug or gene delivery vehicles.
Here, we studied the effects of MNP aggregate formation on targeting and transport across a cell barrier. Using a controlled in vitro assay system to enable quantitative measurement of particle transport kinetics (Figure 1), we assessed the differential effects of a pulsed magnetic field and constant magnetic field on the transport of particles across the cell monolayer, their intracellular uptake and retention on the cell surface. In our experimental set up, MNPs were added in suspension to the apical (donor) compartment on top of a confluent epithelial cell monolayer differentiated on a porous membrane support. A magnetic field was applied from the opposite side of the membrane, and was either kept constant or pulsed on and off. Transport experiments were performed under different temperature conditions to determine the influence of active cellular processes on particle targeting, uptake and transport. Finally, effects of spatiotemporal changes of the external magnetic field on the particle transport kinetics were investigated by transmission electron microscopy and confocal microscopy, and related to bulk quantitative measurements of particle mass distribution.
Figure 1.
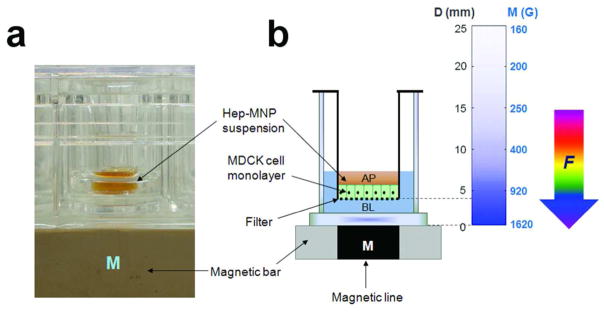
MNP transport experiments were carried out using Transwell™ insert. (a) Experimental set up with the transport system using Transwell™ insert. Supported MDCK (Madin-Darby Canine Kidney) II cell monolayers were grown on porous polyester membrane and used for apical (AP)-to-basolateral (BL) transport studies with 24-well plate placed on a magnetic bar, Heparin-coated MNPs (Hep-MNPs) suspensions were loaded in the apical side. The transport of MNPs across cells was monitored by collecting samples from the basolateral side. (b) Schematic representation of the transport system with the magnetic flux density map. Dimensions of the experimental setting are depicted in mm units. Vertical color gradient bar represents the magnetic flux density (M: Gauss; G) as a function of the distance from the surface of magnet (D: millimeter; mm).
RESULTS
Enhanced Cellular Uptake and Penetration under a Pulsed Magnetic Field
Visual inspection after transport studies under the constant magnetic field indicated a greater accumulation of microscopically-visible MNP aggregates on the cell monolayers with increasing concentrations of MNP in the donor compartment (Figure S2). Under constant magnetic field conditions, the area of the cell surface visibly covered by MNP aggregates at high MNP concentration (0.412 mg Fe/ml) was 34 % (± 2.99), 3-fold larger than those at lower concentration (0.258 mg Fe/ml) (11 % (± 5.00)) (Unpaired t-test, P-value = 0.0022). Thus, we hypothesized that the decrease in the rate of particle transport under constant magnetic field conditions at higher initial MNP concentration might be due to the increased retention of large, magnetically-induced MNP aggregates at the cell surface. To test this possibility, we decided to determine whether a pulsed magnetic field could be used to promote transport across a cell barrier relative to a constant magnetic field condition by minimizing the formation of large magnetized aggregates while pulling the MNPs toward the cell surface and across the cells. To test this, the transport of particles across MDCK cell monolayers was assessed under pulsed magnetic field, constant magnetic field or no magnetic field conditions (Figure 2). Under pulsed magnetic field conditions, at high MNP concentrations (0.412 and 0.659 mg Fe/ml), the rate of particle transport across cells increased 8.5- and 13.6-fold compared to the rate of transport under no magnetic field conditions, respectively (Figure 2a). Compared with constant magnetic field conditions, a 2.5-fold greater rate of particle transport across cells was observed under pulsed magnetic field conditions, at MNP concentration of 0.412 mg Fe/ml (Figure 2a). This enhancement in particle transport rate was even greater (4-fold) at the highest MNP concentration tested (0.659 mg Fe/ml; Figure 2a). A comparison of the mass of MNPs internalized by cells under various magnetic field conditions (Figure 2b) revealed the apparent intracellular mass was 1.5- to 1.8-fold higher under pulsed magnetic field than under constant magnetic field conditions, indicating that pulsing the magnet promoted both intracellular uptake and transport of MNPs.
Figure 2.

Mass transport of MNPs across MDCK cell monolayers was differentially affected by increasing MNP concentrations (0.412 or 0.659 mg Fe/ml) under various magnetic field conditions (NMF corresponds to “no magnetic field”; CMF means “constant magnetic field”; and, PMF is “pulsed magnetic field”; N = 3). (a) Mass transport rates of MNPs and (b) apparent intracellular masses of MNPs per cell, after a 90 min transport experiment, for different initial MNP concentrations (C0: 0.412 or 0.659 mg Fe/ml) under various magnetic field conditions (NMF, CMF, or PMF; 37°C). (c) The rates of mass transport of MNPs across cells at 4°C, at 0.412 or 0.659 mg Fe/ml under different magnetic field conditions (NMF, CMF, or PMF). (d) Ratio of intracellular masses of MNPs divided by the baseline, intracellular mass measured under NMF condition at 37°C, as calculated after 90 min transport experiments under various experimental conditions (4°C vs. 37°C; CMF vs. PMF). For statistical analysis, one-way ANOVA test was followed by Tukey’s multiple comparison tests (α = 0.05) to determine significant differences between the means.
Lowering Temperature Inhibited MNP Transport under a Magnetic Field
The rate of MNP transport across the cell monolayers and the intracellular accumulation of MNPs in the presence of a magnetic field were significantly lower at 4°C relative to the corresponding rates measured in transport experiments done at 37°C (Figure 2c). Especially, the intracellular uptake of MNPs was reduced to the point that intracellular MNP mass at 4°C under pulsed or constant magnetic field conditions was similar to the intracellular accumulation of MNPs measured in no magnetic field at 37°C. At 37°C, the intracellular masses of MNPs under pulsed and constant magnetic field conditions were 3.7- to 5.5-fold and 2.5- to 3.1-fold greater, depending on MNP concentration, than that observed under no magnetic field conditions, respectively (Figure 2d). However, when the studies were repeated under 4°C, no significant increase in intracellular mass accumulation was found under pulsed or constant magnetic field relative to no magnetic field conditions (Figure 2d). Therefore, it was realized that lowering the temperature dramatically inhibited both the cellular uptake and transport of MNPs, even in the presence of the external magnetic field.
Decreased MNP Transport were Associated with Increased MNP Accumulations on Cells
Based on mass balance analysis using the equations (1–5) in the Materials and Methods, the transported fraction of MNPs under constant magnetic field condition (α) was decreased from 8 % (± 0.72) to 4 % (± 0.52) with increasing initial MNP concentrations (Figure 3a). However, the fraction of particles retained on the cell surface (δ) exhibited a corresponding increase with increasing starting MNP concentration from 25 % (± 1.42) at 0.412 mg Fe/ml to 36 % (± 6.31) at 0.659 mg Fe/ml (Figure 3b). Under pulsed magnetic field conditions, differently from constant magnetic field conditions, a significantly greater fraction of particles crossed the cell monolayer (α), while a decreased particle masses were retained on the apical surface of the cells (δ). Under a pulsed magnetic field condition, the fraction of intracellular particles (β) remained almost constant, from 1.59 % (± 0.15) at 0.412 mg Fe/ml to 1.62 % (± 0.06) at 0.659 mg Fe/ml, as the initial MNP concentration increased (Figure 3c). The differential effect of the magnet on the transport vs. intracellular uptake of MNPs (α/β) was determined by calculating the ratio of the fraction of MNPs transported across the cells (α) divided by the fraction of particles trapped inside the cells (β). While there was no significant change of α/β under constant magnetic field compared to no magnetic field, notably, α/β increased about 2.5-fold under pulsed magnetic field relative to no magnetic field conditions (Figure 3d). Thus, while transport of MNPs across cellular barriers was enhanced over intracellular uptake under all conditions tested, the transport/uptake ratio was greatest under pulsed magnetic field conditions.
Figure 3.

Mass balance analysis revealed different fractions of MNPs associated with different compartments, after transport experiments across cell monolayers under different magnetic field conditions. Transport experiments were done at 0.412 or 0.659 mg Fe/ml (C0) and data were subjected to mass balance analysis (equations 1–5). (a) Apical-to-basolateral transported fraction of MNPs, α (%); (b) fraction of particles bound to the cell surface, δ (%); (c) fraction of particles inside the cells, β (%). (d) Ratio (α/β) is depicted at 0.412 or 0.659 mg Fe/ml under various magnetic field conditions (NMF, CMF, or PMF). Statistical analysis was performed using one- way ANOVA with Tukey’s multiple comparison tests (α = 0.05) to determine significant differences between the means.
Cell Surface-Associated MNP Aggregates Formed Faster than Uptake under a Constant Magnetic Field
In order to assess whether the large, visible particle aggregates that accumulated on the cell surface under constant magnetic field conditions formed in suspension prior to contacting the cells, we measured the aggregation behavior of MNPs in the absence of the supported cell monolayers, as a function of distance from the magnet. Experiments were performed by subjecting MNP suspension in a transparent glass tube, to the same magnetic field conditions used in our Transwell™ insert set up. A microscope was used to image the formation of MNP aggregates as a function of distance from the magnet over time, under 1000 × magnification. At 0.412 mg Fe/ml (initial donor MNPs concentration), visible particle aggregates were detectable only at < 0.5 mm from the magnet’s surface (Figure S4a). After 30 min under the magnetic field, visible particle aggregates were observed between 1 and 2 mm from the magnet. However, at distances ≥ 3 mm from the magnet, no particle aggregates were visible microscopically, even after 3 h. For statistical analysis, the area of MNP clusters was measured in microscopic images (Figure 4a). Within the closest distance from the magnet (≤ 1 mm), massive aggregation was observed as early as 10 min in a constant magnetic field.
Figure 4.

Visible, magnetically-induced aggregates of MNPs that formed in suspension decreased in size with increasing distance from the magnet. (a) Total sizes (area; μm2) of clusters of particle aggregates measured from the bright field images of particle suspension within 4 mm (0.1, 0.5, 1, 2, and 4 mm) from the magnet are displayed as a function of time (5–180 min) under the magnetic field. (b) MNP concentration changes at each segment in the tube (0.1–0.5, 0.5–2, 2–4, and 4–7 mm from the magnet) are plotted as a function of time (5–180 min) under the external magnetic field (0.412 mg Fe/ml).
Nevertheless, as the distance from the magnet increased, the size of visible particle aggregates precipitously decreased. At distances ≥ 3 mm, there were no microscopically-measurable particle aggregates. To determine the extent to which the magnetic field affected the concentration of MNPs at the level of the Transwell™ insert, we also measured the changes in MNP concentration in suspension over time as a function of distance from the magnet (Figure 4b). MNPs closer to the magnet moved fast toward the magnet leading to an increase in local concentration near the magnet. However, particles > 4 mm distance from the magnet (at the level of Transwell™ insert) moved slowly toward the magnet, leading to a small but insignificant change in MNP concentration at > 4 mm distances from the magnet. Therefore, the results suggested that it was at the level of the cell monolayer where the MNPs were pulled down onto the cell surface by the magnetic force. The microscopically-visible aggregates most likely formed after particles interacted with the surface of the cells. Although it is possible that some magnetically induced aggregates may be formed in suspension, those aggregates would have to be smaller than the resolution limit of the imaging system (< 250 nm).
Magnetically-Induced MNP Aggregates Did Not Affect Cellular Transport/Uptake in the Absence of Magnet
Control experiments were performed to determine whether inducing MNP aggregates before adding them to the cells affected cell barrier penetration, cellular uptake or retention on the cell surface, when the transport experiments were carried out in the absence of a magnetic field. Mass transport rate and apparent intracellular mass of MNPs were measured, and for mass balance analysis, α, β, and δ (%) were calculated. Under these conditions, there were no significant differences in MNP transport, cellular uptake and particle retentions on the cell surface in the absence of a magnetic field, when MNP suspensions were exposed to different magnetic field conditions prior to the transport experiments (Figure S5 and S6). Cell images captured after the transport experiments did not reveal obvious differences in the accumulation of MNPs on the cell surface. These control experiments are consistent with the applied magnetic field mostly affecting the manner in which MNPs interact with the cells and with each other, at the moment they come in contact with the cell surface.
A Pulsed Magnetic Field Enhanced Uptake/Transport and Decreased Cell Surface MNP Aggregates
To further investigate the pathway through which a pulsed magnetic field enhances transport of MNPs across cell monolayers relative to a constant magnetic field, cell monolayers were examined by TEM after 90 min transport experiments, at 37°C. Under constant magnetic field conditions, large numbers of MNP aggregates were visible on the extracellular side of the apical cell surface, at high MNP concentration (0.659 mg Fe/ml). The size of the particle aggregates on the cell surface was often > 2 μm (Figure 5a and zoom-in image). Smaller MNP aggregates were visible inside cells, and were always observed inside the lumen of membrane-bound vesicles (Figure 5c). The intracellular aggregates were much smaller than those present on the extracellular face of the apical membrane (Figure 5b and c). Remarkably, under pulsed magnetic fields, the size of particle aggregates on the extracellular face of the apical membrane was 206 nm ± 125, which was significantly smaller than the size of the aggregates measured under constant magnetic field conditions (551 nm ± 519) (ANOVA, P-value < 0.001) (Figure 5d and zoom-in). Nevertheless, the intracellular MNP aggregates found inside membrane-bound vesicles in constant and pulsed magnetic field conditions were of similar size: 155 nm ± 123 and 140 nm ± 80, respectively (Figure 5c, e and f). In the absence of magnetic field, there were fewer aggregates on the cell surface (Figure 5g, zoom-in, and h) than under the applied magnetic field. In negative control experiments, no particles were observed, as expected (Figure 5i). Thus, while intracellular MNP aggregates were always of size smaller than endosomes under various magnetic field conditions (Figure 5j), the size of MNP aggregates that formed under a constant magnetic field condition was greater than the size of the aggregates that fit in the endosomes, remaining on the extracellular, apical cell surface.
Figure 5.
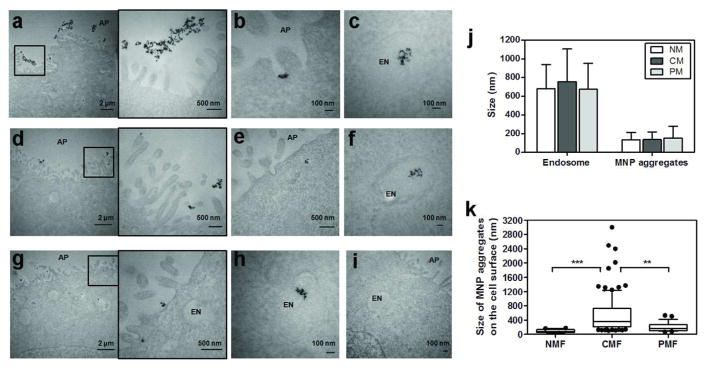
Transmission electron microscopy (TEM) revealed different sizes of MNP aggregates associated with cell monolayers after transport experiments under different magnetic field conditions. “AP” and “EN” indicates apical side and endosome, respectively. Under CMF conditions, (a) large aggregates were visible on the extracellular face of the apical cell membrane (zoom-in image next to the original image); (b) smaller MNP aggregates were sometimes visible in the cell surface invaginations; (c) smaller MNP aggregates were observed inside endosomes. Under PMF conditions, (d) MNP aggregates on extracellular face of the apical cell membrane were smaller in size; (e) some MNPs were also observed in apical membrane invaginations; (f) intracellular MNPs were observed inside endosomes. Under NMF conditions, (g) only small MNP aggregates were visible on the extracellular face of the apical cell surface; (h) some small MNP aggregates were observed inside endosomes. (i) In the absence of MNPs, no MNPs were observed on the cell surface and inside the cells. (j) Sizes of endosome and MNP aggregates inside the endosome measured by Metamorph are depicted for different magnetic field conditions (NMF, CMF, or PMF). (k) Sizes of MNP aggregates retained on the apical cell surface are compared in different magnetic field conditions (NMF, CMF, or PMF). Whisker plots with 10 – 90 % percentiles are depicted with the solid dots as outsiders. For statistical analysis, one-way ANOVA test followed by Tukey’s multiple comparison testing was used (α = 0.05) to determine significant differences between the means.
Large Particle Aggregates Formed at the Basolateral Side under a Constant Magnetic Field
Using optical microscopy, we also examined the transport of MNP suspension at high particle concentration (0.659 mg Fe/ml) across cell monolayers under different magnetic field conditions. Under bright field illumination, there were visible differences in the accumulation of MNPs under various magnetic field conditions (Figure 6a). In the absence of magnetic field, no particle aggregates were detected by confocal epifluorescence microscopy (Figure 6b). Under constant magnetic field conditions, however, large MNP particle aggregates were observed not only on the apical side of the cells, but also at the basolateral side of the cells, clogging the pores of the membrane. In contrast, under pulsed magnetic field conditions, although fluorescence of MNPs was observed in association with the cells, there were no large aggregates present on either the apical or basolateral sides of the cells.
Figure 6.

Transmitted light and confocal epifluorescence microscopy revealed MNP aggregates on cell monolayers and pores of the polyester membrane after 90 min transport studies with MNPs at high MNP concentration (0.659 mg Fe/ml). MNPs showed different aggregation patterns, depending on the magnetic field conditions (NMF, CMF, or PMF). (a) Images of supported cell monolayers captured by Olympus BX-51 upright light microscope under bright field illumination at 1000 × magnifications (scale bar = 10 μm). (b) Images of TRITC-labeled MNPs acquired with a confocal fluorescence microscope, showing the pores of the membrane stained with LysoTracker® Green dyes after 30 min incubation under NMF, CMF, or PMF conditions (scale bar = 10 μm). The top image corresponds to a confocal plane across the PET membrane of the Transwell™ insert, parallel to the plane of the cell monolayer. The bottom image corresponds to an orthogonal yz plane cutting across the cells and the membrane, perpendicularly to the plane of the cell monolayer. Solid bidirectional arrows indicate cytoplasm of the cells (C), pore (P), and basolateral (B) side at each yz plane.
DISCUSSION
Based on this study, a pulsed magnetic field can be used to enhance the transport of MNPs into and across a cellular barrier (Figure 7). In contrast, when the magnetic field is held constant, large magnetized aggregates form at the cell surface, resulting in a greatly decreased fraction of particles being endocytosed by the cells, or actively transported across the cellular barrier. Microscopically-visible MNP aggregates that formed at the cell surface in the presence of a constant magnetic field were too large to be taken up by endocytosis, and they accumulated on the cell surface at a faster rate than they were endocytosed by the cells. Based on the finding that all intracellular MNPs were found inside membrane bound vesicles and that the size of MNP aggregates that can be accommodated by these vesicles is limited to the size of the vesicles, these results suggest that a constant magnetic field is less efficient at promoting MNP transport because large magnetized MNP clusters do not penetrate across the cellular barrier, due to steric constraints inhibiting their uptake. Supporting this notion, we did not observe any MNPs in the intercellular spaces at the level of the cell monolayer. We also observed a dramatic inhibitory effect of lowering temperature on the ability of magnetic fields to promote transport of MNPs across the cell monolayers, consistent with transport of MNPs across the cells occurring via temperature-sensitive endocytic uptake, followed by transcytosis. In control transport experiments carried out in the absence of a magnet, MNP suspensions pre-exposed to a magnetic field exhibited similar transport behaviors as MNP suspensions that had not been pre-exposed to a magnetic field (Figure S5 and S6).
Figure 7.

Descriptive diagram summarizing the different spatiotemporal behaviors of MNPs under various magnetic field conditions (NMF, CMF, or PMF) based on our quantitative and microscopic observations. “N” means cell nuclei. (a) Before the magnetic field is applied, most of MNPs (random assemblies of black dots) are suspended in the apical compartment. (b) Under CMF conditions, the suspended particles are attracted by the magnetic field toward the cell surface, translocated into the cell via endocytosis, and to the basolateral side via transcytosis. At a later time point, accumulations of larger MNPs aggregates on the cell surface sterically inhibit endocytosis of MNPs, and large MNP aggregates form on the basolateral side, clogging the pores on the membrane. (c) Under PMF conditions, translocations of the particles via endocytosis are facilitated by the pulsed magnetic field while the formation of cell surface particle aggregates on the cell surface is minimal. There are no cloggings by MNP aggregates at the basolateral side of the cells. (d) In the absence of magnetic field (NMF), endocytic uptake of MNPs occurs slowly with much fewer MNP aggregates visible on the cell surface or in endocytic vesicles.
Mechanistically, our results point to endocytic uptake as a key factor affecting the interaction between MNPs and cells, even in the presence of an external magnetic field. This is consistent with previous studies.11,35 Inhibition of endocytosis by lowering the temperature reduced cellular uptake and transport of MNPs. Unfortunately, probing the role of endocytosis on the targeting and transport of MNPs is very difficult in vivo, and only a few such studies on middle ear epithelium have been conducted.36,37 Nevertheless, our observations suggest that TEM analyses could be performed to study how a magnetic field facilitates the targeting, transport and cellular uptake of MNPs in vivo. In our experiments, TEM revealed the formation of submicrometer-sized cell surface aggregates that were endocytosed, as well as the formation of large, cell surface MNP aggregates that were not endocytosed. Functional differences in MNP performance could be correlated with the targeting and transport properties of MNPs, as well as size differences in MNP aggregates on the cell surface or basolateral membrane under the different magnetic field applications (constant vs. pulsed magnetic field). Similar TEM observations could be performed in vivo.
For in vitro magnetic labeling or magnetofection applications, the quantitative analysis developed in this study can be used to reveal how the cellular uptake and targeting of particles are affected by the manner in which the external magnetic field is modulated. For in vivo drug targeting and delivery experiments, similar quantitative analysis of MNP aggregation and transport pathways will be essential to guide the future development of magnetic targeting strategies and their downstream application in drug or gene delivery. For clinical MRI, quantitative analyses of magnetic field-induced MNP aggregation could also help improve the performance of MNPs as contrast agents and prevent possible side effects that may result from induced particle aggregates (e.g., vascular thromboembolic events or unwanted accumulation of MNPs in off-target sites).32,34,38 While many physicochemical properties of MNP preparations can influence their propensity to form aggregates,9,13,14 the performance of MNPs as contrast agents for MRI experiments can be affected by their magnetically-induced aggregation state.39 While magnetically-induced MNP aggregates show decreased contrast enhancement in MRI,40 our experiments suggest that pulsed magnetic fields may improve the performance of MNPs in MRI. Related to this, magnetic field strengths in clinical MRI instruments are orders of magnitude greater than those used in our transport experiments.32,41,42 Therefore, field-induced particle aggregates can be expected to form even more readily in clinical MRI applications.43 Consistent with our experiments, continuous exposure to high strength magnetic fields does not necessarily lead to greater tissue targeting, as compared with lower strength magnetic fields.32
Certainly, we expect that further quantitative analysis will be essential to identify MNP formulations with the most suitable physicochemical properties (i.e., particle size, surface modifications, nanomaterial types, batch-to-batch variations) for in vitro and in vivo use and also clinical applications. Although our experiments did not test the performance of different MNP formulations, spatiotemporal variations in the magnetic field are expected to interact differently with MNP preparations possessing different physicochemical properties. Most likely, magnetic field strength, number and frequency of pulses will need to be optimized in a formulation-specific manner, so as to achieve maximal uptake (or transfection efficiency) or optimal MRI contrast effects. Perhaps more importantly, our results clearly indicate importance of exploring the effects of spatiotemporal variations in magnetic fields in the context of in vivo drug/gene delivery or MRI applications. Indeed, the vast majority of in vivo targeting/delivery and MRI experiments involving MNPs have been done in the presence of a constant magnetic field. While all our experiments have been done in vitro, our results suggest that the interaction of a pulsed magnetic field with particle dosing, the distance from the magnet, and overall duration of applying magnetic field may also be exploited to obtain the most effective, selective, and reliable magnetic applications. Previously, sub-maximal magnetic field strengths have been used in vivo to avoid severe particle aggregations that often occurs during magnetic targeting experiments.44 However, a pulsed magnetic field may offer distinct advantages, in terms of its ability to minimize cell surface aggregate formation while maximizing the force driving the cellular uptake and transport of particles.
CONCLUSIONS
To summarize, the retention of MNPs on the cell surface, as well as the cellular uptake and transcellular targeting of MNPs, have been quantitatively analyzed in relation to the initial MNP concentrations and their interaction with a constant vs. pulsed magnetic field. At high particle concentrations, the propensity of forming large particle aggregates after interaction of MNPs with the cell surface was reduced by pulsing on and off the magnetic field. Because of steric hindrance, large particle aggregates cannot be endocytosed, resulting in an increased fraction of MNPs accumulating at the cell surface when the magnetic field is kept constant. By pulsing the magnetic field, the apical to basolateral transport of MNPs across the cell monolayers was maximized, by effectively concentrating MNPs at the cell surface while avoiding the formation of large MNP aggregates. Ultimately, our results suggest that spatiotemporal variations in the magnetic field can be effectively used to optimize in vitro and in vivo magnetically-guided drug or gene targeting strategies and also MRI applications.
MATERIALS AND METHODS
Materials
Chemicals used to prepare the Hep-MNPs or TRITC-labeled MNPs and quantify the iron contents (ferrozine assays) were obtained from the Sigma-Aldrich (St. Louis, MO). Chemicals used to prepare Hank’s Balanced Salt Solution buffer (HBSS; pH 7.4, 10 mM HEPES, 25 mM D-Glucose) were from Fisher Scientific, Inc. (Pittsburgh, PA). Cell culture reagents and DYNAL-MPC-L magnet bar were purchased from Invitrogen, co (Carlsbad, CA). Transwell™ inserts with polyester membrane were purchased from Corning Co (Lowell, MA). UV/VIS plate reader (BioTEK Synergy BioTEK, co.) was used to measure absorbance values of the samples from the transport experiments after ferrozine assays. Phillips CM-100 transmission electron microscope and Zeiss LSM 510-META laser scanning confocal microscope were used for cell examinations after transport experiments.
Preparation of heparin-coated iron oxide nanoparticles (Hep-MNPs)
As previously reported18, a solution containing 0.76 mol/l ferric chloride and 0.4 mol/l of ferrous chloride (molar ratio of ferric (Fe3+) to ferrous (Fe2+) = 2:1) was prepared at pH 1.7 under N2 protection and then, added into 1.5M sodium hydroxide solution under stirring condition. The mixture was gradually heated (1°C/min) to 78°C and held at this temperature for 1 h with N2 protection under stirring. After the supernatant was removed by a permanent magnet, the wet sol treated with 0.01 M HCl was sonicated for 1 h. The colloidal suspension of MNPs was filtered through a 0.45 μm and then a 0.22 μm membrane. Suspension was adjusted to contain 0.7 mg Fe/ml. Two hundred ml of 0.7 mg Fe/ml iron oxide nanoparticles were added to 200 ml of 1 mg/ml glycine with stirring. Next, the suspension was ultrasonicated for 20 min, followed by stirring for 2 h. After free glycine was removed by ultrafiltration, the iron content of the samples was measured by inductively coupled plasma-optical emission spectroscopy (ICP) analysis using a Perkin-Elmer Optima 2000 DV instrument (Perkin-Elmer, Inc., Boston, MA), calibrated with an internal Yttrium reference, and a standard curve of iron samples (GFS Chemicals). The MNP suspension was diluted to a concentration of 0.35 mg Fe/ml. As a final step, 100 ml of 0.35 mg Fe/ml of glycine-MNPs were added to 100 ml of 1 mg/ml heparin solution, under stirring condition and ultrasonication. Heparin-coated MNPs (Hep-MNPs) were obtained after free heparin was removed by ultrafiltration. Superparamagnetic properties of Hep-MNPs were confirmed with a superconducting quantum interference device (SQUID) (Quantum Design Inc., San Diego, CA, USA).18 Physicochemical characterization of MNP preparations was conducted by measuring the size and zeta potential of MNPs in water or in the serum-containing buffer solution using Malvern Zetasizer (Malvern Instruments, Malvern, UK) (Figure S1).
Cell culture
MDCK strain II cells obtained from American Type Culture Collection (ATCC) (Manassas, VA) were cultured in 75 cm2 flasks at 37°C, 5% CO2 containing humidified incubator. MDCK cells were cultured with growth medium consisting of Dulbecco’s Modified Eagle Medium (DMEM; Invitrogen, Carlsbad, CA) with 2 mM L-glutamine, 4500 mg/l of D-glucose, and 110 mg/l of sodium pyruvate, 1×non-essential amino acids (Gibco 11140), 1 % penicillin-Streptomycin (Gibco 10378), and 10 % fetal bovine serum (FBS; Gibco 10082). After reaching 70–80 % confluency, MDCK cells were detached from the culture flasks using trypsin, and subcultured at a split ratio of 1:10.
To prepare supported cell monolayers for transport experiments, cells in suspension (100 μl, 4×10⁵ cells/cm2) was added into the apical side of Transwell™ inserts with the polyester (PET) membrane (Area: 0.33 cm2, Pore size: 3 μm) (Corning co., Lowell, MA) in 24-well culture plate containing 600 μl of growth media in the basolateral side. After overnight incubation at 37°C, 5 % CO2 incubator, the confluent MDCK cell monolayers on Transwell™ inserts were rinsed twice with HBSS buffer (pH 7.4) and pre-incubated for 20 min in HBSS with 10% FBS (transport buffer) at 37°C. Transepithelial electrical resistance of the cell monolayer was measured by Millipore Millicell® ERS electrodes. TEER values were calculated after subtracting baseline TEER values measured with membrane inserts without cells. Only inserts with the confluent cells showing TEER values higher than 150 Ω×cm2 were used for transport experiments.
Experimental set up
Transport buffer (600 μl) without MNPs was added into the basolateral (bottom) chamber and MNP suspension (100 μl of MNPs in transport buffer) at different initial concentrations was added to the apical (top) side of the Transwell™ insert. Apical-to-basolateral transport experiments were conducted over 90 min with or without the magnetic bar (DYNAL-MPC-L (Invitrogen, Carlsbad, CA)), applied to the bottom of the plate (Figure 1a). Magnetic flux density along the vertical distance from the surface of magnetic bar was measured by 3-axis Hall Teslameter and depicted with color gradient map by the “TriScatteredInterp” function in MATLAB R2010b (Figure 1b).
Transport measurements and microscopic imaging
During transport experiments, plates were stirred using a VWR rocking platform shakers. Sample solutions (300 μl) were collected from the basolateral chambers at each time point. Fresh 300 μl of transport buffer without the particles was then added back into the basolateral chambers. At the final time point (90 min), the solutions from donor and receiver chambers were collected and both sides of the inserts were twice washed with cold Dulbecco’s phosphate buffered saline (DPBS). For measurements, standard and sample solutions were put into the 96-well plates (Nalge Nunc International, Rochester, NY) for UV/absorbance measurement at 364 nm using a plate reader (Synergy, BioTEK, Co.). Concentration of MNPs in the each well of the 96-well plate was determined with the aid of a standard curve.
To confirm monolayer integrity, TEER was measured after each experiment. Then, cell monolayers were washed with cold DPBS buffer, and the cells were examined using an Olympus BX-51 upright light microscope under bright field illumination. Images of cell monolayers after experiments were acquired with an Olympus DP-70 digital camera. In the brightfield images, the clusters of particle aggregates in five different images at each case were analyzed by the Integrated morphometric analysis (IMA) function of Metamorph (Molecular Devices, Inc) (N = 5). Total clustered area of particle aggregates was normalized by overall cell monolayer and displayed as percentages for the comparisons at different initial MNP concentrations.
Effect of magnetic field variations on Hep-MNP transport
Transport studies under different conditions of the magnetic field were performed at 37 or 4°C. For transport experiments in the presence of a constant magnetic field, the magnetic bar was fixed at the bottom of the plate and transport studies were performed for 90 min. For transport experiments under a pulsed magnetic field, cells were first incubated with MNPs but without the magnet during an initial 5 min period. Samples were taken out from basolateral side, after which the magnetic bar was placed at the bottom of the plate and the MNP suspensions was incubated for an additional 5 min, with shaking. At the end of the 5 min, the magnetic bar was removed and incubation was continued for 5 more minutes, with shaking. In this manner, the magnetic field was pulsed for 8 cycles. Transport samples in the basolateral side were collected at 5, 10, 30, 50 and 70 min. At the final time point (90 min), the total volume was removed from apical and basolateral sides. To measure the intracellular content of MNPs, cells in the inserts were washed with cold DPBS buffer twice and detached from the membranes with trypsin. Trypsinization also removed the MNPs from the cell surface. The isolated cells were counted and after centrifugation at 4,000 rpm, 5 min, the cell pellets were lysed with 1 % Triton X-100 (Sigma-Aldrich, St. Louis, MO) for 30 min on ice. After centrifugation at 12,000 rpm, 5 min, supernatants of the cell lysates were analyzed for iron content.
Quantitative analysis of iron content
Iron content was measured using Ferrozine-based assay. The solution of the Fe oxidizing agent, ferrozine, was prepared by solubilizing 80 mg of Ferrozine, 68 mg of Nepcuproine, 9.635 g of Ammonium acetate (final concentration: 5 M in solution), 8.806 g of Ascorbic acid (2 M in solution) in 25 ml Milli-Q water (Bedford, MA) while stirring. For measurements, samples collected from transport studies were diluted in HBSS buffer. Diluted sample solution (83.3 μl) was mixed with 16.7 μl of 6 N HCl (final concentration of HCl in 100 μl solution is 1 N) in 1.5 ml microcentrifuge tubes. To release Fe from MNPs into solution, a potassium permanganate (KMnO4) solution in HCl was prepared by mixing 3.55 ml of 0.2 M KMnO4 with 1.5 ml of 2 M HCl. The sample solution (100 μl) was mixed with 100 μl of the KMnO4/HCl solution and then heated in a 60°C water bath for 2 h. Next, 30 μl of ferrozine solution was added to the samples and vortexed. The solution was cooled down to room temperature (RT) and then, 200 μl samples were transferred to a 96-well plate. Absorbance values were measured at 550 nm with UV/VIS plate reader (BioTEK Synergy BioTEK, co.). Iron standards were also prepared using the same procedure and subject to ICP. A standard curve was generated by ICP analysis and ferrozine assay using the Fe standard solutions in the range of Fe content (0–90 Fe nmoles).
Quantitative analysis of mass balance
For quantitative analysis of mass balance, transported fraction of MNPs (α, %), entrapped fraction of particles inside the cells (β, %), retained fraction of particles at apical suspension (γ, %), and retained fraction of particles at cell surface (δ, %) were calculated relative to the initial masses of MNPs (Map_initial) added to the cells at the start of each transport experiment, using equations (1–5).
| (1) |
| (2) |
| (3) |
| (4) |
| (5) |
In these equations, Mbl_final or Map_final refer to the mass of MNPs in basolateral (target) side or apical side at 90 min. IM_final refers to the measured intracellular mass of MNPs from the Triton-X treated cells following removal of extracellular, cell-surface-associated MNPs by trypsin digestion. The masses of particles retained on the cell surface (Mcellsurface) were calculated by equation (5), corresponding to any residual particle masses that cannot be accounted for the masses in the intracellular, basolateral, or apical suspensions at 90 min and the masses in the solutions used to rinse the apical cell surface and basolateral side (M_rinsed). The ratio α/β was calculated from the fraction of targeted nanoparticles into the basolateral side over time (90 min) (α) normalized by the entrapped fraction of MNPs in the cells (β) at each case.
Transmission electron microscopy
(TEM). Under different magnetic field conditions (no magnetic field, constant or pulsed magnetic field), transport experiments in MDCK cell monolayers with MNPs at high particle concentration (0.659 mg Fe/ml) were performed at 37°C and then cells were prepared for TEM imagings. Cell monolayers on the inserts were washed twice with HBSS containing 10 % FBS, and then washed twice with Sorensen’s buffer. The washed cells on inserts were fixed for 30 min with 2.5 % glutaraldehyde in 0.1 M Sorensen’s buffer (pH 7.4), followed by rinsing with 0.1 M Sorensen’s buffer. Then, samples were incubated with 1 % osmium tetroxide in 0.1 M Sorensen’s buffer and rinsed twice with water. Next, samples were dehydrated for 5 min each in 50, 70, 90, and 100 % ethanol, infiltrated in Epon and polymerized at 60°C for 24 h. Embedded samples were sectioned with an ultramicrotome, and images were captured using a Phillips CM-100 transmission electron microscope at magnifications from 3,400 to 180,000 ×. Images of MNP aggregates on the apical cell surface and cytosol were displayed with the scale bars. For the quantitative analyses of the TEM images, the diameter of the major axis in the elliptical circle of the endosome and the size of MNP aggregates were measured by Metamorph from at least 10 images under different magnetic field conditions. The sizes of endosome and MNP aggregates inside the endosome were measured by Metamorph from at least 10 different TEM images at each case of the applied magnetic field condition. In the case of endosome, the diameter in major axis of endosome (assumed as an elliptical circle) were measured as the sizes of endosomes. The distance between the both ends of the aggregates was measured as the size of MNP aggregates.
Confocal microscopy
To examine the MNPs transported through the cells and pores in the membrane, Z-stack images were acquired using a Zeiss LSM 510-META laser scanning confocal microscope. For this purpose, Hep-MNPs labeled with TRITC were prepared. Rhodamine isothiocyanate (TRITC, Sigma-Aldrich) 1 mg dissolved in 200 μl of DMSO was slowly added to 5 mg Fe (200 μl of 25 mg Fe/ml stock solution) of Hep-MNPs. After incubation for 3 hours at 25°C, the reaction mixture was dialyzed (Sigma, MWCO: 12 kDa) against 10% DMF solution for overnight with change of the dialyzing solution at every 6 to 8 h. Next, the reaction mixture was dialyzed against Milli-Q water. After transport studies with TRITC-labeled Hep-MNPs for 90 min with the applied magnetic field or without the applied magnetic field, the cells in the inserts were incubated with LysoTracker® Green DND-26 (Molecular Probes, Invitrogen) for 30 min and then, placed on the Lab-Tek® I-chamber slide for live cell imaging. Particles were visualized in confocal scanning through Z-axis with Helium Neon 1 laser (543 nm).
Quantitative microscopic image analysis of magnet-induced MNP aggregates in suspension
Ten μl of MNP suspension in HBSS with 10 % FBS was placed on a slide and a No. 1 coverslip was placed on the drop of MNP suspension. The magnet was placed at the edge of the slide glass and the particle aggregation of MNPs in the presence of magnetic field was measured over time (0–3 h) at varying distances from the magnet (0.1–10 mm) using an Olympus BX-51 upright light microscope at 1000 × magnification. Using bright field optics, images were captured with an Olympus DP-70 high resolution digital camera at each time point (0, 5, 10, 30 min, and every 30 min until 3h). After background subtraction and thresholding, the images were analyzed with Metamorph software (Molecular Devices, Inc) using the IMA function to measure the area of clusters (particle aggregates). Total sizes (area; μm2) of clusters of particle aggregates in the brightfield images of particle suspension within 2 mm (0.1, 0.5, 1, and 2 mm) from the magnet were measured by Metamorph for different initial MNP concentrations (0.258 or 0.412 mg Fe/ml).
Quantitative analysis of magnet-induced changes in MNP concentration in suspension
Over time, magnet-induced changes in MNP concentration were measured as a function of distance from the magnet, using a 1 mm diameter glass tube was filled with MNP suspension (0.258 or 0.412 mg Fe/ml) up to 20 mm along the tube. The magnetic bar was placed at the edge of the tube, horizontally, so the particles in suspension were pulled towards the magnet. Movement of MNPs toward the magnet to the distance from the magnet was examined using an UVP transilluminator (Upland, CA). Images of the tube aligned with the magnetic bar on the brightfield illuminator were captured using a Sony DSC-W70 digital camera (0–3 h). Intensity of the solution in the tube was measured using the Line scan function in Metamorph from three different images. In the equation (6), I0 or IT indicates intensity of the solution in the tube at zero or each time point.
| (6) |
Based on the optical density (OD), the mass of MNPs at each point along the tube was calculated with a standard curve generated with the same set up, using MNP suspensions of known dilutions. Concentrations of MNPs at each segment in the tube (0.1–0.5, 0.5–2, 2–4, and 4–7 mm from the magnet) were calculated by dividing the integrated mass of MNPs over a length of the tube by the calculated volume of that segment of the tube, assuming a cylinder. Concentrations of MNPs (mg Fe/ml) moving toward the magnet across the tube were tracked with the time under the external magnetic field.
Statistical analysis
GraphPad Prism 5.03 (GraphPad Software; LaJolla, CA) was used for data analyses. Unpaired Student’s t-test was used with a significance level, 0.05. As a post test of one-way analysis of variance (one way-ANOVA), Tukey’s multiple comparison test was performed with a significance level, α = 0.05.
Supplementary Material
Acknowledgments
This work was made possible through grants from: NIH (R01GM078200 to G. R. Rosania and R01CA114612 to V. C. Yang); NSF (EPS-1158862 Subagreement 34-21530-200-76190 to A. E. David); World Class University (WCU) project of the MEST and NRF of South Korea (R31-2008-000-10103-01 to V. C. Yang); Warner Lambert/Parke Davis Fellowship (to K. A. Min); and a Rackham Pre-doctoral Fellowship of the University of Michigan (to K. A. Min). Authors thank A. Talattof for technical supports, D. Sorenson (Microscopy and Image Analysis Laboratory, University of Michigan) for TEM analysis, and C. J. Galban (Department of Radiology, Center for Molecular Imaging, Medical School, University of Michigan) for helpful advice. V. C. Yang is also a Participating Faculty in the Department of Molecular Medicine and Biopharmaceutical Sciences, College of Medicine & College of Pharmacy, Seoul National University, South Korea.
ABBREVIATIONS
- MNPs
Magnetic nanoparticles
- SPION
Superparamagnetic iron oxide nanoparticles
- MION
Magnetic iron oxide nanoparticles
- Hep-MNPs
Heparin-coated MNPs
- NMF
no magnetic field
- CMF
constant magnetic field
- PMF
pulsed magnetic field
- MDCK
Madin-Darby canine kidney cells
- DMEM
Dulbecco’s Modified Eagle Medium
- FBS
Fetal bovine serum
- TEM
Transmission electron microscopy
- TRITC
Rhodamine isothiocyanate
Footnotes
Author Contributions
The manuscript was written through contributions of all authors. All authors have given approval to the final version of the manuscript.
Supporting Information Available: Additional experimental methods and results (figures). This material is available free of charge via the Internet at http://pubs.acs.org.
REFERENCES AND NOTES
- 1.Ferrari M. Cancer Nanotechnology: Opportunities and Challenges. Nat Rev Cancer. 2005;5:161–171. doi: 10.1038/nrc1566. [DOI] [PubMed] [Google Scholar]
- 2.Medarova Z, Pham W, Farrar C, Petkova V, Moore A. In Vivo Imaging of siRNA Delivery and Silencing in Tumors. Nat Med. 2007;13:372–377. doi: 10.1038/nm1486. [DOI] [PubMed] [Google Scholar]
- 3.Liong M, Lu J, Kovochich M, Xia T, Ruehm SG, Nel AE, Tamanoi F, Zink JI. Multifunctional Inorganic Nanoparticles for Imaging, Targeting, and Drug Delivery. ACS Nano. 2008;2:889–896. doi: 10.1021/nn800072t. [DOI] [PMC free article] [PubMed] [Google Scholar]
- 4.Cheng J, Teply BA, Jeong SY, Yim CH, Ho D, Sherifi I, Jon S, Farokhzad OC, Khademhosseini A, Langer RS. Magnetically Responsive Polymeric Microparticles for Oral Delivery of Protein Drugs. Pharm Res. 2006;23:557–564. doi: 10.1007/s11095-005-9444-5. [DOI] [PubMed] [Google Scholar]
- 5.Dobson J. Gene Therapy Progress and Prospects: Magnetic Nanoparticle-Based Gene Delivery. Gene Ther. 2006;13:283–287. doi: 10.1038/sj.gt.3302720. [DOI] [PubMed] [Google Scholar]
- 6.Bulte JWM. Magnetic Nanoparticles as Markers for Cellular MR Imaging. J Magn Magn Mater. 2005;289:423–427. [Google Scholar]
- 7.Peng XH, Qian XM, Mao H, Wang AY, Chen Z, Nie SM, Shin DM. Targeted Magnetic Iron Oxide Nanoparticles for Tumor Imaging and Therapy. Int J Nanomed. 2008;3:311–321. doi: 10.2147/ijn.s2824. [DOI] [PMC free article] [PubMed] [Google Scholar]
- 8.Lu AH, Salabas EL, Schuth F. Magnetic Nanoparticles: Synthesis, Protection, Functionalization, and Application. Angew Chem Int Ed Engl. 2007;46:1222–1244. doi: 10.1002/anie.200602866. [DOI] [PubMed] [Google Scholar]
- 9.Chatterjee J, Haik Y, Chen CJ. Size Dependent Magnetic Properties of Iron Oxide Nanoparticles. J Magn Magn Mater. 2003;257:113–118. [Google Scholar]
- 10.Muller K, Skepper JN, Posfai M, Trivedi R, Howarth S, Corot C, Lancelot E, Thompson PW, Brown AP, Gillard JH. Effect of Ultrasmall Superparamagnetic Iron Oxide Nanoparticles (Ferumoxtran-10) on Human Monocyie-Macrophages In Vitro. Biomaterials. 2007;28:1629–1642. doi: 10.1016/j.biomaterials.2006.12.003. [DOI] [PubMed] [Google Scholar]
- 11.Chithrani BD, Ghazani AA, Chan WCW. Determining the Size and Shape Dependence of Gold Nanoparticle Uptake into Mammalian Cells. Nano Lett. 2006;6:662–668. doi: 10.1021/nl052396o. [DOI] [PubMed] [Google Scholar]
- 12.Eberbeck D, Kettering M, Bergemann C, Zirpel P, Hilger I, Trahms L. Quantification of the Aggregation of Magnetic Nanoparticles with Different Polymeric Coatings in Cell Culture Medium. J Phys D Appl Phys. 2010;43 [Google Scholar]
- 13.Yuan JJ, Armes SP, Takabayashi Y, Prassides K, Leite CAP, Galembeck F, Lewis AL. Synthesis of Biocompatible Poly[2-(Methacryloyloxy)Ethyl Phosphorylcholine]-Coated Magnetite Nanoparticles. Langmuir. 2006;22:10989–10993. doi: 10.1021/la061834j. [DOI] [PubMed] [Google Scholar]
- 14.Sonvico F, Mornet S, Vasseur S, Dubernet C, Jaillard D, Degrouard J, Hoebeke J, Duguet E, Colombo P, Couvreur P. Folate-Conjugated Iron Oxide Nanoparticles for Solid Tumor Targeting as Potential Specific Magnetic Hyperthermia Mediators: Synthesis, Physicochemical Characterization, and In Vitro Experiments. Bioconjugate Chem. 2005;16:1181–1188. doi: 10.1021/bc050050z. [DOI] [PubMed] [Google Scholar]
- 15.Janib SM, Moses AS, MacKay JA. Imaging and Drug Delivery Using Theranostic Nanoparticles. Adv Drug Deliv Rev. 2010;62:1052–1063. doi: 10.1016/j.addr.2010.08.004. [DOI] [PMC free article] [PubMed] [Google Scholar]
- 16.Win KY, Feng SS. Effects of Particle Size and Surface Coating on Cellular Uptake of Polymeric Nanoparticles for Oral Delivery of Anticancer Drugs. Biomaterials. 2005;26:2713–2722. doi: 10.1016/j.biomaterials.2004.07.050. [DOI] [PubMed] [Google Scholar]
- 17.Yamamoto H, Kuno Y, Sugimoto S, Takeuchi H, Kawashima Y. Surface-Modified PLGA Nanosphere with Chitosan Improved Pulmonary Delivery of Calcitonin by Mucoadhesion and Opening of the Intercellular Tight Junctions. J Control Rel. 2005;102:373–381. doi: 10.1016/j.jconrel.2004.10.010. [DOI] [PubMed] [Google Scholar]
- 18.Min KA, Yu F, Yang VC, Zhang X, Rosania GR. Transcellular Transport of Heparin-Coated Magnetic Iron Oxide Nanoparticles (Hep-MION) under the Influence of an Applied Magnetic Field. Pharmaceutics. 2010;2:119–135. doi: 10.3390/pharmaceutics2020119. [DOI] [PMC free article] [PubMed] [Google Scholar]
- 19.Koch AM, Reynolds F, Merkle HR, Weissleder R, Josephson L. Transport of Surface-Modified Nanoparticles through Cell Monolayers. Chembiochem. 2005;6:337–345. doi: 10.1002/cbic.200400174. [DOI] [PubMed] [Google Scholar]
- 20.Petri-Fink A, Steitz B, Finka A, Salaklang J, Hofmann H. Effect of Cell Media on Polymer Coated Superparamagnetic Iron Oxide Nanoparticles (SPIONs): Colloidal Stability, Cytotoxicity, and Cellular Uptake Studies. Eur J Pharm Biopharm. 2008;68:129–137. doi: 10.1016/j.ejpb.2007.02.024. [DOI] [PubMed] [Google Scholar]
- 21.Kim DK, Mikhaylova M, Zhang Y, Muhammed M. Protective Coating of Superparamagnetic Iron Oxide Nanoparticles. Chem Mater. 2003;15:1617–1627. [Google Scholar]
- 22.Zhang L, Yu FQ, Cole AJ, Chertok B, David AE, Wang JK, Yang VC. Gum Arabic-Coated Magnetic Nanoparticles for Potential Application in Simultaneous Magnetic Targeting and Tumor Imaging. AAPS J. 2009;11:693–699. doi: 10.1208/s12248-009-9151-y. [DOI] [PMC free article] [PubMed] [Google Scholar]
- 23.Thunemann AF, Schutt D, Kaufner L, Pison U, Mohwald H. Maghemite Nanoparticles Protectively Coated with Poly(Ethylene Imine) and Poly(Ethylene Oxide)-Block-Poly(Glutamic Acid) Langmuir. 2006;22:2351–2357. doi: 10.1021/la052990d. [DOI] [PubMed] [Google Scholar]
- 24.Dias AMGC, Hussain A, Marcos AS, Roque ACA. A Biotechnological Perspective on the Application of Iron Oxide Magnetic Colloids Modified with Polysaccharides. Biotechnol Adv. 2011;29:142–155. doi: 10.1016/j.biotechadv.2010.10.003. [DOI] [PubMed] [Google Scholar]
- 25.Wu W, He Q, Jiang C. Magnetic Iron Oxide Nanoparticles: Synthesis and Surface Functionalization Strategies. Nanoscale Res Lett. 2008;3:397–415. doi: 10.1007/s11671-008-9174-9. [DOI] [PMC free article] [PubMed] [Google Scholar]
- 26.Cole AJ, David AE, Wang J, Galban CJ, Yang VC. Magnetic Brain Tumor Targeting and Biodistribution of Long-Circulating PEG-Modified, Cross-Linked Starch-Coated Iron Oxide Nanoparticles. Biomaterials. 2011;32:6291–6301. doi: 10.1016/j.biomaterials.2011.05.024. [DOI] [PMC free article] [PubMed] [Google Scholar]
- 27.Chertok B, David AE, Moffat BA, Yang VC. Substantiating In Vivo Magnetic Brain Tumor Targeting of Cationic Iron Oxide Nanocarriers via Adsorptive Surface Masking. Biomaterials. 2009;30:6780–6787. doi: 10.1016/j.biomaterials.2009.08.040. [DOI] [PMC free article] [PubMed] [Google Scholar]
- 28.Cole AJ, Yang VC, David AE. Cancer Theranostics: The Rise of Targeted Magnetic Nanoparticles. Trends Biotechnol. 2011;29:323–332. doi: 10.1016/j.tibtech.2011.03.001. [DOI] [PMC free article] [PubMed] [Google Scholar]
- 29.Huang J, Bu L, Xie J, Chen K, Cheng Z, Li X, Chen X. Effects of Nanoparticle Size on Cellular Uptake and Liver MRI with Polyvinylpyrrolidone-Coated Iron Oxide Nanoparticles. ACS Nano. 2010;4:7151–7160. doi: 10.1021/nn101643u. [DOI] [PMC free article] [PubMed] [Google Scholar]
- 30.Socoliuc V, Taculescu A, Podaru C, Dobra A, Daia C, Marinica O, Turcu R, Vekas L. Clustering in Water Based Magnetic Nanofluids: Investigations by Light Scattering Methods. AIP Conf Proc. 2010;1311:89–95. [Google Scholar]
- 31.Espurz A, Alameda JM, Espurznieto A. Magnetically Induced Dielectric Anisotropy in Concentrated Ferrofluids. J Phys D Appl Phys. 1989;22:1174–1178. [Google Scholar]
- 32.Chertok B, David AE, Yang VC. Brain Tumor Targeting of Magnetic Nanoparticles for Potential Drug Delivery: Effect of Administration Route and Magnetic Field Topography. J Control Rel. 2011;155:393–399. doi: 10.1016/j.jconrel.2011.06.033. [DOI] [PMC free article] [PubMed] [Google Scholar]
- 33.Driscoll CF, Morris RM, Senyei AE, Widder KJ, Heller GS. Magnetic Targeting of Microspheres in Blood Flow. Microvasc Res. 1984;27:353–369. doi: 10.1016/0026-2862(84)90065-7. [DOI] [PubMed] [Google Scholar]
- 34.Duran JD, Arias JL, Gallardo V, Delgado AV. Magnetic Colloids as Drug Vehicles. J Pharm Sci. 2008;97:2948–2983. doi: 10.1002/jps.21249. [DOI] [PubMed] [Google Scholar]
- 35.Kim JS, Yoon TJ, Yu KN, Noh MS, Woo M, Kim BG, Lee KH, Sohn BH, Park SB, Lee JK, et al. Cellular Uptake of Magnetic Nanoparticle is Mediated through Energy-Dependent Endocytosis in A549 Cells. J Vet Sci. 2006;7:321–326. doi: 10.4142/jvs.2006.7.4.321. [DOI] [PMC free article] [PubMed] [Google Scholar]
- 36.Mondalek F, Zhang Y, Kropp B, Kopke R, Ge X, Jackson R, Dormer K. The Permeability of SPION over an Artificial Three-Layer Membrane is Enhanced by External Magnetic Field. J Nanobiotechnology. 2006;4:1–9. doi: 10.1186/1477-3155-4-4. [DOI] [PMC free article] [PubMed] [Google Scholar]
- 37.Dormer K, Seeney C, Lewelling K, Lian G, Gibson D, Johnson M. Epithelial Internalization of Superparamagnetic Nanoparticles and Response to External Magnetic Field. Biomaterials. 2005;26:2061–2072. doi: 10.1016/j.biomaterials.2004.06.040. [DOI] [PubMed] [Google Scholar]
- 38.Arruebo M, Fernández-Pacheco R, Ibarra MR, Santamaría J. Magnetic Nanoparticles for Drug Delivery. Nano Today. 2007;2:22–32. [Google Scholar]
- 39.Tromsdorf UI, Bigall NC, Kaul MG, Bruns OT, Nikolic MS, Mollwitz B, Sperling RA, Reimer R, Hohenberg H, Parak WJ, et al. Size and Surface Effects on the MRI Relaxivity of Manganese Ferrite Nanoparticle Contrast Agents. Nano Lett. 2007;7:2422–2427. doi: 10.1021/nl071099b. [DOI] [PubMed] [Google Scholar]
- 40.Muller RN, Gillis P, Moiny F, Roch A. Transverse Relaxivity of Particulate MRI Contrast Media: From Theories to Experiments. Magn Reson Med. 1991;22:178–182. doi: 10.1002/mrm.1910220203. [DOI] [PubMed] [Google Scholar]
- 41.Hartwig V, Giovannetti G, Vanello N, Lombardi M, Landini L, Simi S. Biological Effects and Safety in Magnetic Resonance Imaging: A Review. Int J Environ Res Public Health. 2009;6:1778–1798. doi: 10.3390/ijerph6061778. [DOI] [PMC free article] [PubMed] [Google Scholar]
- 42.Riches SF, Collins DJ, Scuffham JW, Leach MO. Eu Directive 2004/40: Field Measurements of a 1.5 T Clinical MR Scanner. Br J Radiol. 2007;80:483–487. doi: 10.1259/bjr/69843752. [DOI] [PubMed] [Google Scholar]
- 43.David AE, Cole AJ, Chertok B, Park YS, Yang VC. A Combined Theoretical and In Vitro Modeling Approach for Predicting the Magnetic Capture and Retention of Magnetic Nanoparticles In Vivo. J Control Rel. 2011;152:67–75. doi: 10.1016/j.jconrel.2011.01.033. [DOI] [PMC free article] [PubMed] [Google Scholar]
- 44.Gao X, Wang Y, Chen K, Grady BP, Dormer KJ, Kopke RD. Magnetic Assisted Transport of PLGA Nanoparticles through a Human Round Window Membrane Model. J Nanotechnol Eng Med. 2010;1:031010:1–6. [Google Scholar]
Associated Data
This section collects any data citations, data availability statements, or supplementary materials included in this article.