

Abstract
Objective
With the increasing rates of obesity, many people diet in attempts to lose weight. Since weight loss is seldom maintained in a single effort, weight cycling is a common occurrence. Unfortunately, reports from clinical studies that have attempted to determine the effect of weight cycling on mortality are in disagreement, and to date, no controlled animal study has been performed to assess the impact of weight cycling on longevity. Therefore, our objective was to determine whether weight cycling altered lifespan in mice that experienced repeated weight gain and weight loss throughout their lives.
Methods
Male C57BL/6J mice were placed on one of three lifelong diets: a low fat (LF) diet, a high fat (HF) diet, or a cycled diet in which the mice alternated between 4 weeks on the LF diet and 4 weeks on the HF diet. Body weight, body composition, several blood parameters and lifespan were assessed.
Results
Cycling between the HF and LF diet resulted in large fluctuations in body weight and fat mass. These gains and losses corresponded to significant increases and decreases, respectively, in leptin, resistin, GIP, IGF-1, glucose, insulin, and glucose tolerance. Surprisingly, weight cycled mice had no significant difference in lifespan (801±45 days) as compared to LF fed controls (828±74 days), despite being overweight and eating a HF diet for half of their lives. In contrast, the HF fed group experienced a significant decrease in lifespan (544±73days) compared to LF fed controls and cycled mice.
Conclusions
This is the first controlled mouse study to demonstrate the effect of lifelong weight cycling on longevity. The act of repeatedly gaining and losing weight, in itself, did not decrease lifespan and was more beneficial than remaining obese.
Keywords: weight cycling, weight fluctuation, yo-yo dieting, weight loss, mortality, longevity
Introduction
The obesity epidemic has prompted more and more individuals to seek methods to lose weight. However, attempts to lose weight are often not successful and result in episodes of weight loss followed by weight regain, a phenomenon often referred to as weight cycling.1 Although varying definitions make it challenging to determine the proportion of adults affected, weight cycling is considered to be common in countries battling the obesity epidemic.2–5 In fact, a recent report among U.S. adults suggests that only one in six overweight or obese individuals who achieve a 10% weight reduction are able to maintain that weight loss over a one year period.6 Despite the common prevalence of weight cycling, the physiological and psychological ramifications are poorly understood, and some have even suggested that it may be more deleterious than remaining obese.7–9
Data regarding the impact of weight cycling on morbidity and mortality are conflicting. Most short term studies show improvements in weight-related comorbidities with weight loss such as blood pressure, triglycerides, HDL cholesterol, blood glucose, insulin sensitivity and HbA1C.10, 11 Since weight regain is common, controversy arises over whether these acute improvements result in long-term gains in health and in reducing mortality. Unfortunately, studies specifically addressing mortality and weight cycling are not in agreement.3, 4, 8, 9, 12–20 For example, some studies report weight loss and weight cycling to be a major contributor to all-cause mortality,8, 9, 17–20 while others show weight cycling, especially when weight loss events are intentional, is not predictive of all-cause mortality and may reduce mortality risk.3, 4, 12–16 The discrepancies in the reported findings are likely multifaceted. Inconsistencies in recruited populations, methodology, inclusion/exclusion criteria for pre-existing disease and lifestyle, cycle length or number, and differentiation between intentional versus unintentional weight loss likely contribute to the disparate findings. Regardless, the public health implications of the safety and long-term consequences of weight cycling are enormous given the current obesity epidemic. More controlled studies are clearly needed to provide the public with appropriate recommendations for altering weight.
Weight cycling in humans is a complex behavior making it difficult to simulate in animal models. Despite this barrier, there is an urgent need to establish an animal-based system that allows one to conduct well-controlled studies to determine the effect of weight cycling on tissue physiology and longevity. The use of an animal system would allow for the precise control of factors such as amplitude, length, and frequency of cycling over a relatively long period of time. Several studies using rodents have assessed the impact of weight cycling regimens on specific health parameters, such as body composition, metabolic rate, cancer rate, insulin resistance, and hormonal fluctuations.21–25 However, to date, no study has evaluated the ultimate gauge of health, lifespan. For lifespan studies, mice are commonly used because they are relatively short-lived mammals and they display physiological, functional and pathological changes with age comparable to those seen in humans. Further, the C57BL/6J strain is commonly used in studies impacting weight, as C57BL/6J males are prone to becoming obese and hyperglycemic when fed a high fat diet, similar to what is seen in humans.26–28 Therefore, the purpose of the study was to determine the impact of weight cycling on lifespan using male C57BL/6J mice.
Materials and Methods
Experimental animals and dietary manipulation
Twenty eight male C57BL/6J mice were purchased from Jackson Laboratories (Bar Harbor, ME, USA) at 3 weeks of age and allowed to acclimate at the Ohio University animal facility for 1 week prior to the start of the study. The mice were divided into 3 groups at 4 weeks of age and placed on one of three diets for the duration of their lifespans. The first group (n=10) was placed on a high-fat (HF) diet (D12492; Research Diets, New Brunswick, NJ, USA; 60% of energy was from fat, 20% from carbohydrates, and 20% from protein). The second group (n=9) was placed on standard laboratory rodent chow (ProLab RMH 3000), which is lower in fat (LF) at 14% of energy from fat, 60% from carbohydrates, and 26% from protein. The third group (n=9) was continuously cycled between the HF diet and the LF diet to promote lifelong fluctuations in body weight (cycled). Each full “diet cycle” was 8 weeks in duration and consisted of 2 phases: 4 weeks on a HF diet followed by 4 weeks on a LF diet. Mice were given free access to food and water throughout the study. The cages were kept in a temperature- and humidity-controlled room and exposed to a 14 h light/10 h dark cycle. Mice were housed 9–10 per cage in large 45 cm × 24 cm microisolator cages. No running wheels were present in the cages. The microbial status of the room was specific pathogen free as determined by quarterly serology and semi-annual parasitology reports from sentinel animals placed in used bedding. All procedures were approved by the Ohio University Institutional Animal Care and Use Committee and fully complied with all federal, state and local policies.
Body weight, food consumption and longevity
Body weight and food consumption measurements started the first week of the study (4 weeks of age) and continued weekly for the entire lifespan of each mouse. Food consumption was determined for each of the 3 diet groups by weighing the total amount of food given at the start of each week and then subtracting by the amount of food remaining at the end of the week. The average food consumed per mouse was then obtained by dividing the number of mice remaining alive per group for the given week. Analysis of lifespan was carried out by recording the age of spontaneous death for each mouse. All mice had no noticeable health issues except for normal declines in health (i.e. decreased mobility, weight loss) at advanced ages, and there were no accidental deaths due to procedures employed.
Body composition measurements
Body composition was measured over three separate time periods: 15 to 23 weeks of age (cycle 2), 47 to 55 weeks of age (cycle 6), and 79 to 87 weeks of age (cycle 10). During these three time periods, body composition was measured weekly using a Bruker Minispec NMR to determine the amount of fat, lean, and fluid mass of the animal (The Woodlands, TX, USA), as previously described.28–30
Fasting blood glucose measurements and plasma collection
Fasting blood glucose was determined and fasting plasma samples were collected at 51 weeks of age, which for the cycled mice corresponded to the last day of the HF portion of cycle 6. Blood collection was performed by cutting ~1 mm from the tip of the tail and collecting 200 μl of blood into heparinized capillary tubes. The first drop of blood was used to measure glucose using OneTouch Ultra test strips and glucometers (Lifescan Inc. Milpitas, CA, USA). Blood collection occurred between 09:00am and 11:00am following a 12 h fast. Plasma was obtained by centrifugation at 4° C for 10 min at 7 000 rpm and was stored at −80° C until further analysis. For the diet cycled mice, in order to obtain blood at the end of a LF phase, an additional blood collection was performed 4 weeks later (55 weeks of age or end of the LF phase of cycle 6).
Intraperitoneal glucose tolerance tests
Glucose tolerance tests were performed at 67 weeks of age for all mice (end of the HF phase of cycle 8 for cycled mice). Glucose tolerance tests were performed again on cycled mice 4 weeks later (end of the LF phase of cycle 8) to obtain a reading at the end of a LF phase. Mice were fasted for 12 h prior to the measurements. Each mouse received an intraperitoneal injection of a 10% glucose solution at 0.01 ml/g body weight. Blood glucose measurements were performed using OneTouch Ultra test strips and glucometers (Lifescan Inc. Milpitas, CA, USA) before the glucose injection and at 30, 60, 120, 180 and 240 min after the injection.
Plasma measurements
Fasting plasma insulin, c-peptide, leptin, resistin, GIP, IL-6, TNF-α and MCP-1 were measured using a Milliplex Analyzer and a Mouse Metabolic Panel (Cat.# MMHMAG-44K) (Millipore, Billerica, MA USA) according to manufacturer’s instructions. Fasting plasma IGF-1 levels (total IGF-1) were measured using IGF-1 (mouse, rat) ELISA kits (Cat.# 22-IG1MS-E01) (ALPCO, Salem, NH USA) according to manufacturer’s instructions.
Statistical analysis
Data are presented as mean ± SEM. Statistics were performed using SPSS version 14.0 (Chicago, IL, USA). Comparisons for all plasma measurements and glucose tolerance tests (area under the curve) were made using univariate ANOVA. For within- and between-group comparison of longitudinal data, repeated-measures ANOVA was used with Bonferroni post hoc test. Survival analysis was performed using Kaplan-Meier analysis with log rank Mantel-Cox for pairwise comparisons. Differences were considered significant at p<0.05.
Results
Body weight
Average lifelong body weights of mice on the LF, HF and cycled diets were 32.1g ± 0.2, 50.3g ± 0.2, and 42.9g ± 0.4, respectively. Body weights for each group of mice over lifespan are shown in Figure 1. A significant difference was found in body weight as determined by a one–way repeated measures ANOVA (F(2,14) = 40.6, p < 1×10⁻⁶) with post-hoc tests showing significant differences among all treatment groups. As expected, mice fed a HF diet weighed significantly more than the low fat or cycled mice. Cycled mice had dramatic fluctuations in body weight that continued for more than 2 years. Shortly after 2 years, body weight fluctuations in the cycled mice were attenuated as the number of mice remaining in the study declined. For cycled mice through 2 years of life, the average weight change per cycle was 9.7 ± 0.3 grams, which equates to 22.6% of total body weight gained or lost every 4 weeks due to diet cycling. The average weight gain through 2 years of life was slightly higher (10.0 ± 0.6 g) compared to average weight loss (9.4 ± 0.5 g).
Figure 1. Lifelong body weights.

Mouse weights were collected weekly starting at 4 weeks of age and continued for the entire life of each mouse. LF fed mice are represented by black circles, HF fed mice are represented by white boxes and cycled mice are represented by grey triangles. Data are expressed as mean ± SEM. Cycles 2, 6 and 10 are indicated with brackets. A detailed analysis of body composition was determined during these 3 cycles as shown in figure 2.
Body composition
In order to determine the effects of diet on lean and fat mass over time, body composition was measured during 3 stages of life: 15–23 weeks of age (cycle 2), 47–55 weeks of age (cycle 6) and 79–87 weeks of age (cycle 10) (figure 2). A significant difference was found in body weight (F(2,16) = 39.3, p < 1×10⁻⁶) and fat mass (F(2,16) = 41.2, p < 1×10⁻⁶) among all three diet groups. Lean mass showed a slight but significant difference over time for mice on the HF diet (F(2,16) = 7.7, p < 0.005). Post-hoc tests showed significant differences between the HF group versus either the LF group or cycled groups, but no difference between the lean mass of LF and cycled groups. LF fed control mice had an average percent body fat of 12.6±0.7%, while HF fed mice averaged 39.3±0.9% and cycled mice averaged 29.0±1.5%.
Figure 2. Body composition.

Body composition was measured weekly over three time periods; 15–23 weeks of age (cycle 2, left column), 47–55 weeks of age (cycle 6, center column) and 79–87 weeks of age (right column). (A) Body mass, (B) fat mass, and (C) lean mass was determined for all three diet groups; HF fed (white squares), LF fed (black circles) and cycled (grey triangles) were determined. Repeated measures ANOVAs were performed to determine effect of diet over time. Data are expressed as mean ± SEM.
Glucose metabolism
A significant difference was found in fasting blood glucose (F(3,30) = 9.3, p < 0.0005), glucose tolerance (F(3,30) = 9.8, p < 0.0005), as well as fasting plasma insulin (F(3,30) = 11.5, p < 0.00005) and C-peptide (F(3,30) = 9.9, p < 0.0005) (figure 3a). Fasting blood glucose was significantly elevated in mice on the HF diet and in cycled mice during the HF phase of the cycle as compared to LF fed controls and the cycled mice during the LF phase of the cycle. Intraperitoneal glucose tolerance tests (figure 3b and c) showed similar results; that is, glucose tolerance was significantly elevated in mice on the HF diet and in cycled mice during the HF phase of the cycle. Fasting plasma insulin (figure 3d) and C-peptide (figure 3d) levels were elevated with HF feeding and during the HF phase in cycled mice compared to LF fed controls; however, the difference between the cycled-LF phase and cycled-HF phase was not significant.
Figure 3. Glucose metabolism.

Glucose metabolism in mice on a LF diet (black bars), HF diet (white bars), and in cycled mice during a LF phase (dark grey bars) or during a HF phase (light grey bars). (A) Fasting blood glucose, (B) intraperitoneal glucose tolerance tests (IPGTT), (C) IPGTT area under the curve, (D) fasting plasma insulin (E), and fasting plasma C-peptide are shown. Data are expressed as mean ± SEM. Means shown with a common superscript letter are not significantly different, p>0.05.
Plasma hormones and cytokines
Levels of select hormones and inflammatory cytokines were determined (table 1). A significant difference was found in IGF-1 levels (F(3,30) = 24.1, p < 4×10⁻⁸) with IGF-1 being elevated on the HF diet compared to LF controls. Cycled mice had elevated levels of IGF-1 during the HF phase of the cycle, which were similar to that of the non-cycled HF fed controls. During the LF phase, levels of IGF-1 normalized and were similar to non-cycled LF fed controls. A significant difference was also found in leptin (F(3,30) = 12.4, p < 0.00005), resistin (F(3,30) = 10.8, p < 0.0001), and GIP (F(3,30) = 15.7, p < 0.0001) (table 1). All three hormones were elevated on the HF diet compared to LF controls. Similar to markers of glucose metabolism and IGF-1, cycled mice had elevated levels of leptin, resistin and GIP only during the HF phase of the cycle, while levels of all three hormones normalized during the LF phase. Regarding inflammatory cytokines, a significant difference was seen in IL-6 (F(3,30) = 10.2, p < 0.00009). Unlike the pattern seen with the previous blood parameters, IL-6 was significantly decreased in cycled mice regardless of HF or LF phase. No differences were seen for MCP-1 (F(3,30) = 1.7, p = 0.18) or TNF-α (F(3,30) = 1.4, p = 0.26).
Table 1.
Fasting plasma measurements.
| LF | HF | Cycled-LF | Cycled-HF | |
|---|---|---|---|---|
| Growth Factors | ||||
| IGF-1 (ng/ml) | 473 ± 10.1a | 680 ± 10.1b | 530 ± 10.1a | 640 ± 10.1b |
| Adipokines | ||||
| Leptin (ng/ml) | 6.05 ± 1.36a | 45.7 ± 10.9b,c | 23.3 ± 4.51a,b | 54.0 ± 6.93c |
| Resistin (ng/ml) | 12.4 ± 1.98a | 32.3 ± 4.19b | 13.1 ± 1.79a | 33.1 ± 5.13b |
| Incretins | ||||
| GIP (pg/ml) | 66.2 ± 10.1a | 225 ± 23.1b | 79.6 ± 14.0a | 169 ± 24.4b |
| Cytokines | ||||
| IL-6 (pg/ml) | 128 ± 26.3a | 184 ± 42.1a | 32.8 ± 7.84b | 38.4 ± 7.87b |
| TNF-a (pg/ml) | 145 ± 132a | 368 ± 239a | 396 ± 182a | 15.4 ± 1.62a |
| MCP-1 (pg/ml) | 196 ± 134a | 526 ± 291a | 467 ± 191a | 42.9 ± 8.73a |
Data are expressed as mean ± SEM.
Means shown with a common superscript letter are not significantly different, p>0.05.
Food consumption
As expected, LF fed control mice consumed the least amount of calories (9.7 ± 0.1 kcals/mouse/day), and the HF fed mice consumed the most (15.0 ± 0.2 kcals/mouse/day) (Figure 4). The cycled mice consumed an intermediate level of 11.3 ± 0.5 kcals/mouse/day. For cycled mice, switching between the HF and LF diets produced large increases and decreases in food consumption that are clearly seen in the pattern of calories consumed (figure 4c). Even though the cycled and LF groups of mice were fed identical diets during the LF phase of the cycle, the cycled mice consistently consumed ~24% fewer calories (7.4 ± 0.2 kcals/mouse/day) than the non-cycled LF control mice. During the HF phase, the cycled mice consumed nearly the same amount (14.9 ± 0.3 kcals/mouse/day) as the non-cycled HF fed controls.
Figure 4. Weekly food consumption.

Average group food consumption is shown from 8–104 weeks of age for (a) mice on the LF diet, (b) mice on HF diet, and (c) mice that were cycled. For cycled mice (c), cycles 1–12 are represented with divisions between the 8 week cycles being indicated by vertical dashed lines. For comparison to body composition data shown in Figure 2, cycles 2, 6 and 10 are indicated by shading. For 4c, LF feeding is indicated with a black circle and HF feeding is indicated with a white box.
Longevity
The lifespan for each mouse was recorded in days and used for Kaplan-Meier survival analysis (figure 5a). HF feeding resulted in a significant decrease in lifespan compared to both LF fed mice (χ2=8.23, p=0.004) and cycled mice (χ2=4.46, p=0.04). Cycled mice had a similar lifespan to mice fed a LF diet (χ2=1.09, p=0.30). Mean lifespans are shown in figure 5b. Mice fed the LF diet, HF diet and cycled diet had mean lifespans of 828 ± 74 days, 544 ± 73 days, and 801 ± 45 days, respectively. Compared to LF fed controls, HF feeding significantly reduced mean lifespan by 34%. In contrast, cycling the diet reduced mean lifespan by only 3% as compared to the LF control mice, a value that did not reach statistical significance.
Figure 5. Effect of diet cycling on longevity.
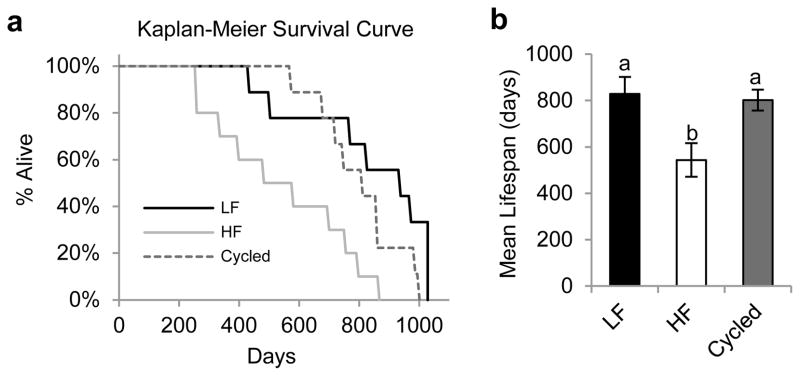
(a) Kaplan-Meier survival curves LF (solid black line), HF (solid grey line) and cycled (dashed line) mouse groups. (b) Mean lifespans of LF fed mice (black bar), HF fed mice (white bar), and cycled mice (grey bar). Data are expressed as mean ± SEM. Means shown with a common superscript letter are not significantly different, p>0.05.
Discussion
In this report, we show that weight cycled mice had a lifespan that was comparable to LF fed controls and far exceeded that of the obese HF controls. The fluctuations in weight for cycled mice were mirrored by alterations in adiposity, an observation that is supported by comparable changes in adipokine profiles. That is, periods of weight gain were due to increases in fat mass when cycled mice were HF fed, and periods of weight loss were due to decreases in fat mass when LF fed. As might be expected, glucose metabolism followed adiposity, with glucose intolerance in HF fed mice and cycled mice during a HF phase only. Likewise, IGF-1 levels were increased in HF fed mice and in cycled mice during the HF phase of the diet, but normalized during the LF phase in cycled mice. Overall, cycled mice showed a marked and repeated flux in both weight and, with the exception of IL-6, the measured physiological parameters that typically accompany an obese state. IL-6 levels were decreased during both phases in the cycled mice compared to non-cycled controls.
Over 50 years ago 31 and repeatedly since then,32 a variety of HF diets have been shown to decrease lifespan in C57BL/6J mice to varying degrees. Thus, our finding that the HF diet reduced lifespan as compared to LF fed controls is expected. However, cycled mice, which spent half of their lives on the HF diet, did not experience any decline in lifespan. This suggests that the deleterious effects of HF diet exposure and resulting increase in adiposity can be mitigated if the diet is routinely reversed. This finding is novel and may relate to the HF feeding being continually counterbalanced by the reduction in caloric intake below that of LF fed controls. That is, even though the cycled mice were given ad libitum access to the normal diet during the LF phase, they consistently consumed fewer calories than the non-cycled LF fed controls.
The difference in lifespan may be partially attributed to alterations in specific endocrine or cytokine factors. For example, levels of IGF-1 are thought to play an important role in aging.33–36 In mice, GH receptor gene disruption (GHR−/−) results in decreased IGF-1, dwarfism, extreme insulin sensitivity and increased lifespan despite increased adiposity.37 In humans, this association is more controversial as the potential benefits of decreased GH/IGF-1 signaling may be counterbalanced by increased risks of obesity and cardiovascular disease.38 Studies in older humans have also shown that genotype combinations resulting in decreased IGF-1 are enriched in Italian centenarians 34, and decreased IGF-1 receptor activity has been found to occur in Ashkenazi Jewish centenarians and their offspring.39 In the current study, IGF-1 was increased in the shorter-lived HF fed mice compared to LF fed controls. In cycled mice, IGF-1 was similarly elevated during the HF phase and normalized during the LF phase of the diet cycle; thus, on average, cycled mice had only acute increases in IGF-1 and were exposed to lower levels of IGF-1 over their lifespan than HF controls. Thus, perhaps the acute elevation in IGF-1 levels, as experienced by cycled mice, is less deleterious than the chronic elevation observed in HF fed mice. Furthermore, since IGF-1 is implicated in development of certain types of cancer 40, 41, it is tempting to speculate that the periodic decreases in IGF-1 resulting from periodic decreases in caloric intake during the LF phase may decrease cancer prevalence in the cycled mice compared to HF fed mice. Future studies analyzing pathology in cycled mice would be of great interest.
The findings with IL-6 are also of interest. IL-6 is an indicator of inflammation, playing a major role in response to environmental stress.42 IL-6 has been implicated in the pathogenesis of many age related diseases and has been shown to be a predictor of all-cause mortality.42, 43 Likewise, low circulating levels of IL-6 are associated with decreased mortality and increased longevity.43–45 In this regard, the low levels of IL-6 seen in cycled mice at one year of age may be indicative of their propensity for increased longevity. Surprisingly, IL-6 was significantly decreased in cycled mice during both the LF and HF phases even when compared to LF fed controls. Since the focus of the current study is longevity, no mice were sacrificed for analysis of immune cells, which may have provided a more detailed analysis of the cause of altered IL-6 levels. In mice, ex vivo analysis of basal IL-6 secretion from peritoneal leukocytes have shown major increases and decreases with advancing age (peaking at 69 weeks).46 TNF-α and MCP-1 also exhibit a peak albeit at slightly older ages (peaking at 92 weeks of age). If HF fed mice were indeed aging faster than the LF fed controls in our study, and with the knowledge that cytokines alter with respect to age, then single time point comparisons are difficult to interpret.
It is tempting to speculate that the cycled mice may have a hormetic advantage. Theories of hormesis suggest that cellular responses to mild, repeated stress can improve aging by stimulating maintenance and repair processes.47 In our study, the repeated HF exposure followed by decreased food consumption below that of LF controls could result in an adaptive response of cells to the mild repeated stress of alternating diets. The two opposing diets may balance repair/protective processes with damaging processes making the animal more equipped overall to deal with a variety of environmental stressors. If true, it would be interesting to determine how long the mice could remain on the HF diet within a diet cycle before the “mild” stress of the HF feeding became too harmful to be rescued by the LF diet. The possibility of a hormetic advantage becomes even more suggestive when we consider that the cycled mice spent half of their lives on the HF diet, weighed significantly more than LF fed mice with more than triple the body fat, yet had a similar lifespan. It would be of interest in future studies to use calculated mean caloric intakes of mice exposed to the 8 week diet cycles and feed a control group the same amount of calories in a non-cycled manner. This would allow one to better determine if cycling itself has a beneficial effect on lifespan independent of the overall caloric intake.
In this study, cycled mice exhibited major fluctuations in not only body weight but also body composition. While this is the first rodent study to evaluate the role of weight cycling on lifespan, other studies have assessed the impact of weight cycling on body composition in humans and rodents with similar findings.21–25 In humans, the data are somewhat controversial because the weight loss may be associated with underlying comorbidities, inherent difficulties in assessing weight cycles and body composition, and heterogeneity of the population. However, there is evidence that weight cyclers experience a redistribution of fat deposition, with several papers reporting a preferential loss of subcutaneous adipose tissue as compared to other adipose tissue depots.48, 49 Because the main objective of this study was to assess lifespan, we were unable to assess the impact of our weight cycling strategy on individual fat depots, yet this would be of interest to do in future studies as growing evidence suggest that the loss of specific depots may be more beneficial than others50.
While the results of this study are novel as it represents the first animal study to evaluate weight cycling on lifespan, there are several limitations that should be noted. For example, this study was done in a single sex using a single strain of mice; thus, this study does not reveal female response to weight cycling and lacked the genetic heterogeneity common in comparable human studies. Furthermore, other variables important for health and lifespan, such as the influence of exercise and the exposure of pathogens common to humans, are not assessed in the current study. While the goal of the current study is focused on characterizing longevity, future studies will need to address the mechanisms underlying the ability of diet cycled mice to maintain normal lifespan. These future studies should focus on evaluating growth factor levels, inflammatory status, hormetic advantage, resistance to cancer development, and overall metabolic status in cycled mice relative to controls.
In conclusion, this is the first study to assess the effect of lifelong weight cycling on longevity. Notably, weight cycling, while causing major fluctuations in many weight related parameters, did not decrease lifespan as compared to mice maintained on a LF diet and significantly improved lifespan compared to HF fed mice, suggesting that weight cycling is more beneficial than remaining obese in male C57BL/6J mice.
Acknowledgments
This work was supported in part by the State of Ohio’s Eminent Scholar Program that includes a gift from Milton and Lawrence Goll, by NIH grants AG031736 and DK083729, by the AMVETS, by the Gates Millennium Scholarship program, and by the Diabetes Research Initiative at Ohio University.
Footnotes
Conflict of interest
The authors declare no conflict of interest.
References
- 1.Weight cycling. National Task Force on the Prevention and Treatment of Obesity. JAMA. 1994;272(15):1196–202. [PubMed] [Google Scholar]
- 2.French SA, Jeffery RW, Folsom AR, Williamson DF, Byers T. Weight variability in a population-based sample of older women: reliability and intercorrelation of measures. International journal of obesity and related metabolic disorders: journal of the International Association for the Study of Obesity. 1995;19(1):22–9. [PubMed] [Google Scholar]
- 3.Field AE, Malspeis S, Willett WC. Weight cycling and mortality among middle-aged or older women. Arch Intern Med. 2009;169(9):881–6. doi: 10.1001/archinternmed.2009.67. [DOI] [PMC free article] [PubMed] [Google Scholar]
- 4.Stevens VL, Jacobs EJ, Sun J, Patel AV, McCullough ML, Teras LR, et al. Weight Cycling and Mortality in a Large Prospective US Study. Am J Epidemiol. 2012 doi: 10.1093/aje/kwr378. [DOI] [PubMed] [Google Scholar]
- 5.Stevens VL, Jacobs EJ, Sun J, McCullough ML, Patel AV, Gaudet MM, et al. Weight Cycling and Risk of Endometrial Cancer. Cancer epidemiology, biomarkers & prevention: a publication of the American Association for Cancer Research, cosponsored by the American Society of Preventive Oncology. 2012 doi: 10.1158/1055-9965.EPI-12-0038. [DOI] [PubMed] [Google Scholar]
- 6.Kraschnewski JL, Boan J, Esposito J, Sherwood NE, Lehman EB, Kephart DK, et al. Long-term weight loss maintenance in the United States. International journal of obesity. 2010;34(11):1644–54. doi: 10.1038/ijo.2010.94. [DOI] [PMC free article] [PubMed] [Google Scholar]
- 7.Yang D, Fontaine KR, Wang C, Allison DB. Weight loss causes increased mortality: cons. Obes Rev. 2003;4(1):9–16. doi: 10.1046/j.1467-789x.2003.00092.x. [DOI] [PubMed] [Google Scholar]
- 8.Diaz VA, Mainous AG, 3rd, Everett CJ. The association between weight fluctuation and mortality: results from a population-based cohort study. J Community Health. 2005;30(3):153–65. doi: 10.1007/s10900-004-1955-1. [DOI] [PubMed] [Google Scholar]
- 9.Rzehak P, Meisinger C, Woelke G, Brasche S, Strube G, Heinrich J. Weight change, weight cycling and mortality in the ERFORT Male Cohort Study. Eur J Epidemiol. 2007;22(10):665–73. doi: 10.1007/s10654-007-9167-5. [DOI] [PubMed] [Google Scholar]
- 10.Pi-Sunyer X, Blackburn G, Brancati FL, Bray GA, Bright R, Clark JM, et al. Reduction in weight and cardiovascular disease risk factors in individuals with type 2 diabetes: one-year results of the look AHEAD trial. Diabetes Care. 2007;30(6):1374–83. doi: 10.2337/dc07-0048. [DOI] [PMC free article] [PubMed] [Google Scholar]
- 11.Villareal DT, Miller BV, 3rd, Banks M, Fontana L, Sinacore DR, Klein S. Effect of lifestyle intervention on metabolic coronary heart disease risk factors in obese older adults. Am J Clin Nutr. 2006;84(6):1317–23. doi: 10.1093/ajcn/84.6.1317. [DOI] [PubMed] [Google Scholar]
- 12.Lissner L, Andres R, Muller DC, Shimokata H. Body weight variability in men: metabolic rate, health and longevity. International journal of obesity. 1990;14(4):373–83. [PubMed] [Google Scholar]
- 13.Dyer AR, Stamler J, Greenland P. Associations of weight change and weight variability with cardiovascular and all-cause mortality in the Chicago Western Electric Company Study. American journal of epidemiology. 2000;152(4):324–33. doi: 10.1093/aje/152.4.324. [DOI] [PubMed] [Google Scholar]
- 14.Wannamethee SG, Shaper AG, Walker M. Weight change, weight fluctuation, and mortality. Archives of internal medicine. 2002;162(22):2575–80. doi: 10.1001/archinte.162.22.2575. [DOI] [PubMed] [Google Scholar]
- 15.Gregg EW, Gerzoff RB, Thompson TJ, Williamson DF. Intentional weight loss and death in overweight and obese U.S. adults 35 years of age and older. Ann Intern Med. 2003;138(5):383–9. doi: 10.7326/0003-4819-138-5-200303040-00007. [DOI] [PubMed] [Google Scholar]
- 16.Shea MK, Houston DK, Nicklas BJ, Messier SP, Davis CC, Miller ME, et al. The effect of randomization to weight loss on total mortality in older overweight and obese adults: the ADAPT Study. J Gerontol A Biol Sci Med Sci. 2010;65(5):519–25. doi: 10.1093/gerona/glp217. [DOI] [PMC free article] [PubMed] [Google Scholar]
- 17.Lissner L, Odell PM, D’Agostino RB, Stokes J, 3rd, Kreger BE, Belanger AJ, et al. Variability of body weight and health outcomes in the Framingham population. N Engl J Med. 1991;324(26):1839–44. doi: 10.1056/NEJM199106273242602. [DOI] [PubMed] [Google Scholar]
- 18.Blair SN, Shaten J, Brownell K, Collins G, Lissner L. Body weight change, all-cause mortality, and cause-specific mortality in the Multiple Risk Factor Intervention Trial. Ann Intern Med. 1993;119(7 Pt 2):749–57. doi: 10.7326/0003-4819-119-7_part_2-199310011-00024. [DOI] [PubMed] [Google Scholar]
- 19.Folsom AR, French SA, Zheng W, Baxter JE, Jeffery RW. Weight variability and mortality: the Iowa Women’s Health Study. International journal of obesity and related metabolic disorders: journal of the International Association for the Study of Obesity. 1996;20(8):704–9. [PubMed] [Google Scholar]
- 20.Mikkelsen KL, Heitmann BL, Keiding N, Sorensen TI. Independent effects of stable and changing body weight on total mortality. Epidemiology. 1999;10(6):671–8. [PubMed] [Google Scholar]
- 21.Simpson JA, Wainwright PE, Hoffman-Goetz L, Levesque S. Effects of different weight loss treatments on weight cycling and metabolic measures in male mice. Physiol Behav. 1994;56(1):197–201. doi: 10.1016/0031-9384(94)90280-1. [DOI] [PubMed] [Google Scholar]
- 22.Jen KL, Lu H, Savona L, Watkins A, Shaw M. Long-term weight cycling reduces body weight and fat free mass, but not fat mass in female Wistar rats. International journal of obesity and related metabolic disorders: journal of the International Association for the Study of Obesity. 1995;19(10):699–708. [PubMed] [Google Scholar]
- 23.Lauer JB, Reed GW, Hill JO. Effects of weight cycling induced by diet cycling in rats differing in susceptibility to dietary obesity. Obesity research. 1999;7(2):215–22. doi: 10.1002/j.1550-8528.1999.tb00704.x. [DOI] [PubMed] [Google Scholar]
- 24.Pellizzon MA, Buison AM, Jen KL. Short-term weight cycling in aging female rats increases rate of weight gain but not body fat content. International journal of obesity and related metabolic disorders: journal of the International Association for the Study of Obesity. 2000;24(2):236–45. doi: 10.1038/sj.ijo.0801120. [DOI] [PubMed] [Google Scholar]
- 25.Li X, Cope MB, Johnson MS, Smith DL, Jr, Nagy TR. Mild calorie restriction induces fat accumulation in female C57BL/6J mice. Obesity (Silver Spring) 2010;18(3):456–62. doi: 10.1038/oby.2009.312. [DOI] [PMC free article] [PubMed] [Google Scholar]
- 26.Surwit RS, Kuhn CM, Cochrane C, McCubbin JA, Feinglos MN. Diet-induced type II diabetes in C57BL/6J mice. Diabetes. 1988;37(9):1163–7. doi: 10.2337/diab.37.9.1163. [DOI] [PubMed] [Google Scholar]
- 27.List EO, Berryman DE, Palmer AJ, Qiu L, Sankaran S, Kohn DT, et al. Analysis of mouse skin reveals proteins that are altered in a diet-induced diabetic state: a new method for detection of type 2 diabetes. Proteomics. 2007;7(7):1140–9. doi: 10.1002/pmic.200600641. [DOI] [PubMed] [Google Scholar]
- 28.List EO, Palmer AJ, Berryman DE, Bower B, Kelder B, Kopchick JJ. Growth hormone improves body composition, fasting blood glucose, glucose tolerance and liver triacylglycerol in a mouse model of diet-induced obesity and type 2 diabetes. Diabetologia. 2009;52(8):1647–55. doi: 10.1007/s00125-009-1402-z. [DOI] [PubMed] [Google Scholar]
- 29.Berryman DE, List EO, Palmer AJ, Chung MY, Wright-Piekarski J, Lubbers E, et al. Two-year body composition analyses of long-lived GHR null mice. J Gerontol A Biol Sci Med Sci. 2010;65(1):31–40. doi: 10.1093/gerona/glp175. [DOI] [PMC free article] [PubMed] [Google Scholar]
- 30.Palmer AJ, Chung MY, List EO, Walker J, Okada S, Kopchick JJ, et al. Age-related changes in body composition of bovine growth hormone transgenic mice. Endocrinology. 2009;150(3):1353–60. doi: 10.1210/en.2008-1199. [DOI] [PMC free article] [PubMed] [Google Scholar]
- 31.Silberberg M, Silberberg R. Factors modifying the lifespan of mice. Am J Physiol. 1954;177(1):23–6. doi: 10.1152/ajplegacy.1954.177.1.23. [DOI] [PubMed] [Google Scholar]
- 32.Keipert S, Voigt A, Klaus S. Dietary effects on body composition, glucose metabolism, and longevity are modulated by skeletal muscle mitochondrial uncoupling in mice. Aging Cell. 2011;10(1):122–36. doi: 10.1111/j.1474-9726.2010.00648.x. [DOI] [PMC free article] [PubMed] [Google Scholar]
- 33.Berryman DE, Christiansen JS, Johannsson G, Thorner MO, Kopchick JJ. Role of the GH/IGF-1 axis in lifespan and healthspan: lessons from animal models. Growth hormone & IGF research: official journal of the Growth Hormone Research Society and the International IGF Research Society. 2008;18(6):455–71. doi: 10.1016/j.ghir.2008.05.005. [DOI] [PMC free article] [PubMed] [Google Scholar]
- 34.Bonafe M, Barbieri M, Marchegiani F, Olivieri F, Ragno E, Giampieri C, et al. Polymorphic variants of insulin-like growth factor I (IGF-I) receptor and phosphoinositide 3-kinase genes affect IGF-I plasma levels and human longevity: cues for an evolutionarily conserved mechanism of life span control. The Journal of clinical endocrinology and metabolism. 2003;88(7):3299–304. doi: 10.1210/jc.2002-021810. [DOI] [PubMed] [Google Scholar]
- 35.van Heemst D, Beekman M, Mooijaart SP, Heijmans BT, Brandt BW, Zwaan BJ, et al. Reduced insulin/IGF-1 signalling and human longevity. Aging Cell. 2005;4(2):79–85. doi: 10.1111/j.1474-9728.2005.00148.x. [DOI] [PubMed] [Google Scholar]
- 36.Euser SM, van Heemst D, van Vliet P, Breteler MM, Westendorp RG. Insulin/Insulin-like growth factor-1 signaling and cognitive function in humans. The journals of gerontology Series A, Biological sciences and medical sciences. 2008;63(9):907–10. doi: 10.1093/gerona/63.9.907. [DOI] [PubMed] [Google Scholar]
- 37.List EO, Sackmann-Sala L, Berryman DE, Funk K, Kelder B, Gosney ES, et al. Endocrine parameters and phenotypes of the growth hormone receptor gene disrupted (GHR−/−) mouse. Endocrine reviews. 2011;32(3):356–86. doi: 10.1210/er.2010-0009. [DOI] [PMC free article] [PubMed] [Google Scholar]
- 38.van Heemst D. Insulin, IGF-1 and longevity. Aging Dis. 2010;1(2):147–57. [PMC free article] [PubMed] [Google Scholar]
- 39.Suh Y, Atzmon G, Cho MO, Hwang D, Liu B, Leahy DJ, et al. Functionally significant insulin-like growth factor I receptor mutations in centenarians. Proceedings of the National Academy of Sciences of the United States of America. 2008;105(9):3438–42. doi: 10.1073/pnas.0705467105. [DOI] [PMC free article] [PubMed] [Google Scholar]
- 40.LeRoith D, Roberts CT., Jr The insulin-like growth factor system and cancer. Cancer letters. 2003;195(2):127–37. doi: 10.1016/s0304-3835(03)00159-9. [DOI] [PubMed] [Google Scholar]
- 41.Doyle SL, Donohoe CL, Finn SP, Howard JM, Lithander FE, Reynolds JV, et al. IGF-1 and its receptor in esophageal cancer: association with adenocarcinoma and visceral obesity. Am J Gastroenterol. 2012;107(2):196–204. doi: 10.1038/ajg.2011.417. [DOI] [PubMed] [Google Scholar]
- 42.Giovannini S, Onder G, Liperoti R, Russo A, Carter C, Capoluongo E, et al. Interleukin-6, C-reactive protein, and tumor necrosis factor-alpha as predictors of mortality in frail, community-living elderly individuals. J Am Geriatr Soc. 2011;59(9):1679–85. doi: 10.1111/j.1532-5415.2011.03570.x. [DOI] [PMC free article] [PubMed] [Google Scholar]
- 43.Walston JD, Matteini AM, Nievergelt C, Lange LA, Fallin DM, Barzilai N, et al. Inflammation and stress-related candidate genes, plasma interleukin-6 levels, and longevity in older adults. Exp Gerontol. 2009;44(5):350–5. doi: 10.1016/j.exger.2009.02.004. [DOI] [PMC free article] [PubMed] [Google Scholar]
- 44.Caruso C, Lio D, Cavallone L, Franceschi C. Aging, longevity, inflammation, and cancer. Ann N Y Acad Sci. 2004;1028:1–13. doi: 10.1196/annals.1322.001. [DOI] [PubMed] [Google Scholar]
- 45.Wassel CL, Barrett-Connor E, Laughlin GA. Association of circulating C-reactive protein and interleukin-6 with longevity into the 80s and 90s: The Rancho Bernardo Study. The Journal of clinical endocrinology and metabolism. 2010;95(10):4748–55. doi: 10.1210/jc.2010-0473. [DOI] [PMC free article] [PubMed] [Google Scholar]
- 46.Arranz L, Lord JM, De la Fuente M. Preserved ex vivo inflammatory status and cytokine responses in naturally long-lived mice. Age. 2010;32(4):451–66. doi: 10.1007/s11357-010-9151-y. [DOI] [PMC free article] [PubMed] [Google Scholar]
- 47.Rattan SI. Hormesis in aging. Ageing Res Rev. 2008;7(1):63–78. doi: 10.1016/j.arr.2007.03.002. [DOI] [PubMed] [Google Scholar]
- 48.Rodin J, Radke-Sharpe N, Rebuffe-Scrive M, Greenwood MR. Weight cycling and fat distribution. Int J Obes. 1990;14(4):303–10. [PubMed] [Google Scholar]
- 49.Wallner SJ, Luschnigg N, Schnedl WJ, Lahousen T, Sudi K, Crailsheim K, et al. Body fat distribution of overweight females with a history of weight cycling. Int J Obes Relat Metab Disord. 2004;28(9):1143–8. doi: 10.1038/sj.ijo.0802736. [DOI] [PubMed] [Google Scholar]
- 50.Tran TT, Yamamoto Y, Gesta S, Kahn CR. Beneficial effects of subcutaneous fat transplantation on metabolism. Cell metabolism. 2008;7(5):410–20. doi: 10.1016/j.cmet.2008.04.004. [DOI] [PMC free article] [PubMed] [Google Scholar]