

Abstract
Little is known of the genetic basis of migration despite the ecological benefits migratory species provide to their communities and their rapid global decline due to anthropogenic disturbances in recent years. Using next generation sequencing of restriction-site associated DNA (RAD) tags we genotyped thousands of SNPs in two wild populations of migratory steelhead and resident rainbow trout (Oncorhynchus mykiss) from the Pacific Northwest of the United States. One population maintains a connection to the sea, whereas the other population has been sequestered from its access to the ocean for more than fifty years by a hydropower dam. Here we performed a genome-wide association study (GWAS) to identify 504 RAD SNP markers from several genetic regions that were associated with the propensity to migrate both within and between the populations. Our results corroborate those in previous quantitative trait loci (QTL) studies and provide evidence for additional loci associated with this complex migratory life history. Our results suggest a complex multi-genic basis with several loci of small effect distributed throughout the genome contributing to migration in this species. We also determined that despite being sequestered for decades, the landlocked population continues to harbor genetic variation associated with a migratory life history and ATPase activity. Furthermore we demonstrate the utility of genotyping-by-sequencing and how RAD-tag SNP data can be readily compared between studies to investigate migration within this species.
Keywords: RAD, GWAS, smoltification, migration, rainbow trout
Introduction
Migration is a complex suite of physiological, morphological, and behavioral traits that act in concert with environmental cues to move animals over great distances (Dingle 2006; Dingle & Drake 2007). Migratory species throughout the globe provide tremendous ecological benefits and services by shuttling resources from nutrient rich to nutrient poor habitats. Many of the migratory species throughout the globe have either disappeared or their populations are in steep decline, largely due to human activities (Wilcove & Wikelski 2008). Despite the benefits migratory species provide to ecological and economic systems, and given their rapid global decline, we know relatively little of the genetic basis of this complex life history in any species (Dingle 2006; Liedvogel et al. 2011).
In large part the lack of knowledge can be attributed to difficulties in designing robust genetic experiments in migratory species. Difficulties can stem from a lack of genetic resources, as many of these species are not model organisms, or difficulty in quantifying the migratory life history trait and behavior (Liedvogel et al. 2011). However, as many migratory species face similar physiological and environmental challenges in carrying out their life history it is purported that several of the associated traits have arisen through convergent evolutionary mechanisms (Dingle 2006). Therefore understanding the genetic basis of migration in one species could provide insight into the genetic basis of migration in other taxa (Dingle 2006) and ultimately assist in the protection and management of such species globally.
Current high throughput genotyping methods, such as restriction-site associated DNA (RAD) tag sequencing using next-generation sequencing (NGS) platforms (Miller et al. 2007; Baird et al. 2008), allow for the interrogation of hundreds to thousands of SNPs randomly distributed throughout the genome at a relatively low cost (Davey et al. 2011). These and other NGS approaches make genetic and genomic tools available to non-model studies and can aid researchers in revealing the genomic regions and candidate genes contributing to trait variation in the wild (Hohenlohe et al. 2010). These methods include the construction of high density genetic linkage maps (Slate et al. 2009; Amores et al. 2011), population genomics (Luikart et al. 2003; Storz 2005; Hohenlohe et al. 2010), and association and quantitative trait loci (QTL) mapping (Johnston et al. 2011; Miller et al. 2012).
Perhaps one of the greatest examples of migration can be seen within the salmonid family of fishes (salmon, trout, and charr). Individuals among these species migrate from freshwater habitats to the ocean where they experience growth and reach sexual maturity before returning to freshwater to spawn in what is termed an “anadromous” life history. Migratory salmonid populations provide a great economic and cultural benefit to humans (Quinn 2005), and by transferring resources from the nutrient rich ocean back to their nutrient poor natal freshwater rivers and streams they provide tremendous ecological services as well (Quinn 2005; Wilcove & Wikelski 2008). However, throughout their range they suffer from overexploitation (Wespestad & Maguire 2011) with some populations extirpated and many others listed under the Endangered Species Act as being threatened or endangered for extinction (Gustafson et al. 2007).
Among salmonids are species that consist entirely of anadromous life history types, species that remain entirely “resident” in natal freshwater habitats, and species that exhibit both anadromous and resident life history tactics in sympatry (Quinn & Myers 2004). All salmonid fishes hatch and rear in freshwater and after a period of juvenile growth those that will make the journey to sea undergo a complex transformation called smoltification. Smoltification prepares anadromous juveniles physiologically, morphologically, and behaviorally for their entry into saline habitats, and is triggered by environmental cues including changes in photoperiod, water temperature, and discharge (Zaugg & McLain 1972; Hoar 1976; Wedemeyer et al. 1980; Quinn 2005). After a period of growth and maturation at sea, anadromous salmonids return to their natal freshwater habitats to spawn. Alternatively, resident salmonids remain in freshwater, and reach sexual maturity without a marine migration.
Juvenile fishes that undergo smoltification are called “smolts” and can be qualitatively and quantitatively differentiated from their resident or pre-smolt conspecifics allowing for the relative determination of an individual’s life history (McLeese et al. 1994; Beeman et al. 1995; Haner et al. 1995; Ando et al. 2005). During smoltification, juveniles morph to a more slender and fusiform body shape (Hoar 1976; Beeman et al. 1995) and experience a drastic shift in body coloration, morphing from a colorful banded body pattern to a bright reflective silver scheme with dark blue-green backs characteristic of other fishes that dwell in pelagic marine environments (Haner et al. 1995; Quinn 2005). Additionally, as smolts begin to change they experience an increase in Na+,K+-ATPase activity level, allowing them to effectively osmoregulate once they reach the saline environment of the ocean (Zaugg & McLain 1972; Schrock et al. 1994). The culmination of the smoltification process is a behavioral change, wherein smolts shift from holding in their natal freshwater habitats to actively migrating downstream to the ocean (Hoar 1958; Groot 1972; Quinn 2005).
Rainbow trout (Oncorhynchus mykiss) are a salmonid species which exhibit tremendous life history variation, including variation in the propensity to migrate. Throughout their range rainbow trout populations exhibit either a wholly freshwater resident tactic in which the fish are called rainbow trout, an anadromous form called “steelhead”, or populations with both rainbow and steelhead trout living in sympatry (Zimmerman & Reeves 2000; Behnke 2002; McMillan et al. 2007). Additionally rainbow and steelhead trout can give rise to one another in wild and experimental populations (Zimmerman & Reeves 2000; Thrower et al. 2004). It has been shown that migration is in part directed by an underlying heritable genetic component (Johnsson et al. 1994; Thrower et al. 2004) in addition to environmental (Zaugg & Wagner 1973) and landscape factors (Narum et al. 2008). Previous studies investigating the genetic basis of anadromy in rainbow and steelhead trout have identified several candidate markers (Martinez et al. 2011; Narum et al. 2011; Limborg et al. 2012) or quantitative trait loci (QTL) (Nichols et al. 2008; Hecht et al. 2012) associated with the variable life history. Some of the QTL regions that have been discovered are shared among studies, whereas others are unique to the mapping populations used, suggesting the potential for independent parallel mechanisms of migration arising within this species (Hecht et al. 2012).
Here we utilized RAD-tag sequencing to genotype thousands of polymorphic SNP loci throughout the genome in two wild populations of rainbow and steelhead trout. We tested the hypothesis that conserved genetic loci are associated with the propensity to migrate across geographic regions. Additionally we investigated whether a population that has been sequestered for more than fifty years following an anthropogenic barrier to migration still contains genetic variation for the trait. We tested these hypotheses using a genome-wide association study (GWAS) approach. Moreover, in the absence of a reference genome in any salmonid species, we used RAD-tag based SNP linkage maps from previous studies (Hecht et al. 2012; Miller et al. 2012), to map SNPs to regions of the genome.
Materials and Methods
Genetic Samples
In order to detect loci associated with the propensity to migrate, two populations of O. mykiss were sampled from the Pacific Northwest of the United States, each known to currently or historically harbor steelhead and rainbow trout living in sympatry. One sample population was collected from the upper Yakima River in the state of Washington, U.S.A. which drains into the Columbia River and maintains its migratory connection to the Pacific Ocean through fish passages in downstream dams. The other sample is from Upper Mann Creek, a tributary of the Snake River in Idaho, USA which before the completion of the Brownlee Dam in 1958 had migratory access to the Pacific Ocean but has since been sequestered upstream of the dam (Holecek et al. 2012) (Fig. 1).
Fig. 1.

Map showing the states of Idaho, Oregon, and Washington. Highlighted are the sampling locations where rainbow and steelhead trout were collected. Locations include the Teanaway River complex (North Fork, Middle Fork and main stem Teanaway) in Washington and Upper Mann Creek in Idaho.
Tissue samples were collected from juvenile Yakima River fish in the spring of 2008 from the North and Middle forks as well as the main stem of the Teanaway River (Fig. 1). Fish from these sites in the Yakima River were collected with standard electrofishing procedures. Both putative migratory smolts and non-migratory residents were collected and marked using passive integrated transponder (PIT) tags and released after a fin clip was collected. These same river reaches were surveyed during the summer and fall of the same year and following years with the same methods. If a PIT tagged fish that was recaptured displayed signs of spawning activity by exuding gametes, it was classified as a non-migratory resident fish having reached sexual maturity in its natal freshwater habitat (Quinn 2005) and assigned a value of “1” for the binary migratory life history trait SMOLT. If a PIT tag was detected at a downstream receiver array in the Yakima River or one of four downstream Columbia River dams the fish was classified as a migratory steelhead smolt, having out-migrated from its natal stream, a behavior characteristic of smolting salmonids (Groot 1972), and was assigned a value of “2” for the migratory trait SMOLT. Only PIT tagged fish that could be assigned as residents or smolts based on the above criteria were used for further analyses from this collection with individuals meeting these criteria numbering 132 in total.
Upper Mann Creek fish were subsampled from a previous study (Holecek et al. 2012). Briefly, scale tissue samples were collected in the spring of 2009, between March 18th and June 3rd, the period at which steelhead smolts in this population would be expected to out-migrate to the ocean (Holecek et al. 2012). Fish were collected in a rotary screw trap and euthanized with a lethal dose (150 mg/L) of tricaine methanesulfonate (MS-222). At this time fish were measured for fork length (mm), and scale tissue samples were taken for both the estimation of age and for the extraction of DNA for genetic analysis. Individuals were categorized as putative residents or smolts based on overall body coloration and morphology following the methods of Negus (2003). Putative residents were those that had retained parr marks and had dark and/or colorful bodies and were assigned a value of “1” for the migratory trait SMOLT. Putative smolts had a predominantly silver body color and lacked distinguished parr marks (Holecek et al. 2012) and were assigned a value of “2” for the migratory trait SMOLT. Silvering of juvenile salmonids is tightly linked to the smoltification process, and is a key determinant of migratory propensity (Haner et al. 1995; Ando et al. 2005). At the time of sampling a segment of the first gill arch was also collected in order to measure gill Na+,K+-ATPase activity (μmol Pi · h−1 · mg protein−1) as further described in Holecek et al. (2012). Increased gill Na+,K+-ATPase activity is expected to be higher in smolting salmonids compared to pre-smolt or non-migratory resident fish and is thus a quantitative measure of the seawater readiness of an individual (Zaugg & McLain 1972; Folmar & Dickhoff 1980). In total 57 fish as described above from Upper Mann Creek were selected for this study.
DNA was extracted from dried fin or scale tissue samples using a DNeasy Blood and Tissue Kit with additional RNase A treatment (Qiagen, Valencia, CA, U.S.A.) following the manufacturer’s recommended protocols. Extracted genomic DNA (gDNA) was quantified using Quantit PicoGreen dsDNA Assay Kits (Invitrogen, Grand Island, NY, U.S.A.) and a Victor2 microplate fluorometer (Perkin Elmer, Waltham, MA, U.S.A.).
Molecular Biology
Restriction-site associated DNA (RAD) (Miller et al. 2007) libraries prepared for Illumina sequencing were produced using a protocol modified from one previously published (Miller et al. 2012) to allow for the use of 150 ng of total gDNA, which was necessary when working with scale tissue samples that yielded low quantities of gDNA. Rather than only pooling a portion of the SbfI digested and P1 RAD barcode adapted gDNA into a library, we pooled the entire sample for each individual. Here we pooled 36 to 39 uniquely barcoded individuals per library, in a total of five libraries to sequence 189 individuals. With each barcode sequence containing six bases that differed from any other barcode within the same library by at least two bases. The remainder of the library preparation follows the methods outlined in Miller et al. (2012). Prior to sequencing, RAD libraries were quantified using real time PCR and an Illumina Library Quantification Kit following the manufacturer’s instructions (Kapa Biosystems Inc, Woburn, MA, U.S.A.) on an ABI 7900HT Sequence Detection System (Life Technologies, Grand Island, NY, U.S.A.). Libraries were sequenced on an Illumina HiSeq2000 sequencer (Illumina Inc., San Diego, CA, U.S.A.) at a single read length of 100 bp.
Among migratory salmonid fishes, females have a higher tendency to undergo the smoltification process and migrate to sea than males (Dellefors & Faremo 1988; Jonsson et al. 1998). Sex was therefore scored, so that it could be used as a covariate in GWAS models to account for the effect of sex on the migratory life history trait SMOLT or ATPase activity. Males were scored as a “1” and females were scored as a “2”. Individuals that could not be definitively sexed based on the expression of gametes at the time of collection were sexed using a rainbow trout genetic sex marker, OmyY1, described elsewhere (Brunelli et al. 2008). This marker has been shown to be between 94–98% accurate at calling the actual sex of Columbia and Snake River rainbow trout (Brunelli et al. 2008) and is thus an acceptable proxy for phenotypic sex. For a small number of individuals with limited DNA for which we could neither determine the sex phenotypically or using the genetic marker OmyY1, sex was imputed based on the average sex of the life history trait SMOLT from which it was assigned. In this manner the individual for whom sex was imputed is non-informative for the covariate, but still informative in GWAS models for its life history classification and/or for its ATPase activity.
Bioinformatics and Genotyping
Genotyping and SNP discovery was performed using Perl scripts and a bioinformatic pipeline provided and detailed in Miller et al. (2012) which incorporates the alignment tool Novoalign (Novocraft, Selangor, Malaysia). Briefly, 100 bp reads were trimmed from the 3′ end to 71bp to remove the portion of the read that is most prone to sequencing error and to reduce the probability of observing multiple SNPs in a single read which can increase the number of false SNPs discovered. Trimmed reads were filtered using quality scores to eliminate poor quality reads and those that contained one or more ambiguous base calls. From the 5′ end of the read the six base barcode sequence and partial SbfI site (TGCAGG) sequence were also removed after reads had been separated based on their unique barcode sequence.
SNPs were discovered using filtered sequences from ten individuals who had an overall quality filtered sequence depth greater than three million reads. Selecting ten individuals allowed for the discovery of alleles with a frequency of 0.05 or greater, which was our target minor allele frequency (MAF) cut-off. Three million randomly selected reads were collected from each of the ten selected fish to assure that each individual was contributing an equal proportion of the overall variation in sequence. Six of the ten individuals were from the Upper Yakima population, with three being smolts, and three being residents. One smolt and resident pair were taken from each of the three sampling locations (North Fork Teanaway, Middle Fork Teanaway, and main stem Teanaway) in the Upper Yakima. Reads from these six individuals were concatenated into a single FASTA file representing the Upper Yakima population. Four fish were taken from Upper Mann Creek, with two being putative smolts, and the other two being putative resident fish. These four individuals were also combined into a single FASTA file to represent the Upper Mann Creek population. Reads within these two population level FASTA files were collapsed such that each unique sequence is represented only once in the file and each header line contains the population name, a unique identification number for the sequence, and the total number of read occurrences among all the individuals in the file for that particular sequence. These two population level FASTA files were then combined to yield a single global FASTA file containing all the unique sequences from each population. The sequences from this concatenated global FASTA file containing all possible sequence variants from ten individuals were then used to make the SNP index, or a catalogue of all unique RAD tag sequences as described further in Miller et al. (2012) using the alignment program Novoalign (Novocraft, Selangor, Malaysia). The resulting alignment produces an exhaustive list of the sequences most similar to one another both within (internal alignments) and between (external alignments) each population. The alignments were used to identify sequences containing a single SNP using the following criteria: 1) a unique sequence had to occur more than six times, 2) a sequence had to have at least one external alignment, to verify that the sequence occurred in both populations, 3) No more than one SNP locus per RAD tag sequence and 4) no more than two alleles per SNP locus were allowed in order to limit false SNPs (i.e., sequencing errors and duplicated loci). Once an index of loci was generated, each of 189 individuals was aligned against the index according to methods described in Miller et al. (2012) to count each allele sequence within an individual. Genotypes for each SNP locus were only scored if the sum of both alleles’ read counts were equal to or greater than five. If the sum of the read counts was less than five, the genotype was scored as missing. Heterozygous genotypes were assigned if the ratio of reads between allele 1 and allele 2 (A1/A2) was between (10/1) to (1/10) at a locus. If the ratio was greater than (10/1) the genotype was scored as being homozygous for the A1 allele. If the ratio was below (1/10) the genotype was scored as being homozygous for the A2 allele. Additionally if only one of the two alleles was present and this allele had a read depth equal to or greater than five, the individual was scored as a homozygote for that allele. The bioinformatic pipeline is described further and commands and parameters used to execute the scripts are contained in Supplementary File S1.
The common ancestor of salmonid fishes experienced a whole-genome duplication event. As a result of this duplication, modern species experience residual tetrasomic inheritance at some loci (Sanchez et al. 2009). These duplicated loci can manifest themselves as false-positive SNPs, or paralogous sequence variants (PSVs) (Miller et al. 2012). In order to detect false-positive SNPs, we aligned RAD-tag sequences from four unique doubled haploid (DH) clonal lines of rainbow trout, which are homozygous at all loci. If one of the DH lines was heterozygous at a locus, we removed the locus from further analysis as being a putative PSV. The DH lines included Clearwater (CL), Oregon State University (OSU), Swanson (SW), and Whale Rock Reservoir (WR) lines and are further detailed elsewhere (Young et al. 1996; Nichols et al. 2007; Miller et al. 2012). The RAD-tag sequences for the DH lines were generated from previous studies and can be downloaded online from the NCBI Sequence Read Archive under project accession SRP008051 (Miller et al. 2012) and SRA052219 (Hecht et al. 2012).
Polymorphic SbfI RAD-tag loci from this study were aligned against those discovered in two RAD-tag based rainbow trout linkage maps (Hecht et al. 2012; Miller et al. 2012) to assist in the placement of our loci into one of the 29 rainbow trout linkage groups. Miller et al. (2012), identified 40,641 monomorphic and polymorphic RAD-tag sites, and named them R00001 to R40641. Additionally Hecht et al. (2012) have identified 4,980 unique polymorphic RAD-tag SNPs which were added to the 40,641 loci from Miller et al. (2012) and named R40642-R45621. We aligned our polymorphic RAD-tag loci against this composite database of 45,621 RAD loci to identify exact sequence matches, so that homologous SNPs could be identified between studies and our unique loci could be named following the nomenclature set forth in Miller et al. (2012). Having the ability to assign even a proportion of the SNPs to a linkage group in the absence of a completed salmonid genome assembly, would allow for a comparison to other studies which have identified regions of the genome under selection (Martinez et al. 2011), or QTL for smoltification related traits (Nichols et al. 2008; Hecht et al. 2012).
GWAS for the propensity to migrate and ATPase activity
Sex was tested for its effect on the migratory life history classification and ATPase activity using an analysis of variance (ANOVA) in the statistical computing environment R (http://www.R-project.org/) and implementing the ‘aov’ package. A significant sex effect would qualify its use as a cofactor in statistical models described below. In order to test for genome-wide associations between RAD-tag SNP genotypes and the propensity to migrate, we employ a unified mixed linear model (MLM) approach, also known as a “Q-K” model, which simultaneously accounts for both population structure (Q) and cryptic familial relatedness (K) among individuals (Balding 2006; Yu et al. 2006). It is known that both population structure and familial relatedness can cause spurious genotype-phenotype associations, and should be accounted for in tests of genetic association (Balding 2006). Population structure was estimated using the program Structure version 2.3.3 (Pritchard et al. 2000) and a subset of 1,000 RAD-tag SNPs. This subset of markers had 100% genotyping success, a global MAF ≥ 0.1, and no loci deviated from Hardy Weinberg Equilibrium (HWE) expectations in each of the sampling populations based on a Bonferroni adjusted p-value (Rice 1989). Structure was run to determine the most likely number of distinct populations (k) from 10 iterations for each potential k-value from 1 to 10 using a burn-in period of 10,000 followed by 100,000 MCMC repetitions. Once a single k value was determined based on criteria set forth by Evanno et al. (2005), three additional iterations (for a total of four) using this value of k were run, and the average coefficient of ancestry for each individual across the k clusters and four runs was calculated by the program CLUMPP version 1.1.2 (Jakobsson & Rosenberg 2007) and results were visualized with the program DISTRUCT version 1.1 (Rosenberg 2004). Coefficients of ancestry (Q) were then used as cofactors in tests of association to account for underlying population structure. Familial relatedness was estimated by calculating a kinship matrix using the complete set of RAD-tag SNPs across all fish used for GWAS. The R package GAPIT (Lipka et al. 2012) was used to generate the matrix using the EMMA algorithm (Kang et al. 2008).
Association tests were implemented with the compressed mixed linear model (MLM) approach (Yu et al. 2006; Zhang et al. 2010) and a general linear model (GLM) executed in the software program TASSEL version 3.0.121 (Bradbury et al. 2007), which employs the EMMA (Kang et al. 2008) and P3D (Zhang et al. 2010) algorithms to speed computation. Association tests were run with the following approaches: A) a global approach where 1) a GLM model for all individuals was run using only sex (if a significant contributor to the variation) and population structure (k − 1 coefficients of ancestry (Q)) as cofactors for SNP effects; and 2) a MLM where sex (if a significant contributor to the variation), population structure (k − 1 coefficients of ancestry (Q)) and a genetic covariance matrix (kinship matrix, (K)) were used as cofactors for SNP effects; or B) a population level approach where each sampling population (Yakima River or Upper Mann Creek) was run in a separate analysis using the GLM or MLM as outlined above. Significant associations were determined using a B-Y FDR p-value adjusted for multiple testing (Benjamini & Yekutieli 2001) at the α = 0.05 level. This multiple test correction has been shown to be less conservative than a Bonferroni adjustment (Narum 2006), however, with a phenotype as complex as the propensity to migrate it was more appropriate to identify plausible associations than to hold the analysis so stringent that only the largest effects can be detected. ATPase activity was tested using a GLM and MLM as outlined above for the Upper Mann Creek population only, as these were the only individuals analyzed for this trait.
Prior to analyses, SNP markers were filtered for minor allele frequencies (MAF) of ≥ 0.05, and a minimum genotyping success of 80%. Markers were also tested for deviations from HWE expectations for each sampling population individually to curtail Wahlund effects. Significance for HWE deviations was determined at the α = 0.05 level adjusted for multiple testing using a Bonferroni correction (Rice 1989) as opposed to the B-Y FDR correction used in association tests, which in this instance would be more stringent. This approach balances Type I and II errors in corrections for multiple tests (Narum 2006). Loci that deviated significantly from HWE expectations were discounted in association tests to avoid false positive results. Within the individual sampling location analyses (i.e. Yakima only or Upper Mann Creek only), markers were only pruned if they did not meet filtering criteria when measured within the population under scrutiny. In an effort to annotate the RAD-tag sequences of all of the loci found to be significant in all of the GWAS models outlined above, we performed a BLAST against the NCBI RefSeq collection using the blastn feature of the program Blast2GO (http://www.blast2go.com). In total, 67 bases of the 100bp RAD-tag sequence were blasted, which included the complete 8 base SbfI site (CCTGCAGG) on the 5′ end of the sequence.
Results
Genetic Samples
A total of 132 fish collected from multiple sites of the upper Yakima River basin, were sequenced at RAD-tag sites. However, five of these produced low yield RAD-tag sequence data, and were pruned from all analyses, leaving 127 fish from the upper Yakima River basin. Of those remaining 127 fish, 98 were classified as non-migratory resident rainbow trout exuding gametes at the time of collection and 29 were classified as migratory steelhead smolts having been surveyed by PIT tag at downstream dams. Of the non-migratory resident fish which could be definitively sexed based on the expression of gametes, 12 were female and 86 were male. The immature migratory smolts were sexed using the genetic sex marker OmyY1 (Brunelli et al. 2008). Using this marker we concluded that 14 of the smolts were female, 8 were male, and 7 were unknown (Table 1). It is known within salmonids that there is a sex bias amongst resident and migrant populations, where more females have a tendency to smolt and out migrate to sea, whereas more males reach sexual maturity within their freshwater habitat (Dellefors & Faremo 1988; Jonsson et al. 1998). In this light it is not unexpected for us to see differences in numbers of each sex within our sample.
Table 1.
Summary of fish samples used in association analyses (excluding pruned samples) collected from the Yakima River and Upper Mann Creek including SMOLT (putative life history classification of resident or smolt), Sex (F = female, M = male, UNK = unknown), ATPase activity measured (yes or no), and total count in each category
| Population | SMOLT | Sex | ATPase | Count |
|---|---|---|---|---|
| Yakima | Resident | F | no | 12 |
| M | no | 86 | ||
| UNK | - | - | ||
| Smolt | F | no | 14 | |
| M | no | 8 | ||
| UNK | no | 7 | ||
| Upper Mann Creek | Resident | F | yes | 16 |
| M | yes | 10 | ||
| UNK | yes | 1 | ||
| Smolt | F | yes | 21 | |
| M | yes | 4 | ||
| UNK | yes | 3 |
A total of 57 fish were sequenced from the Upper Mann Creek sample, with two fish removed from all downstream analyses due to low yield sequence data. Of the remaining 55 fish, 27 were categorized as putative non-migratory residents with an average fork length of 118 mm (range 69–186 mm), and an average scale age of 1.7 years (range 1–3 years). Twenty-eight fish were categorized as putative migratory smolts with an average fork length of 161 mm (range 130–240 mm) and an average scale age of 2.4 years (range 2–4 years). All of the fish collected from Upper Mann Creek, except for two mature resident males, were sexed using the genetic sex marker OmyY1 (Brunelli et al. 2008). Based on these results, 16 of the resident fish were designated females, 10 as males and 1 was unknown. Of the smolts, 21 were called as females, 4 as males, and 3 were unknown (Table 1). When combining results from both the Yakima River and the Upper Mann Creek collections, the majority of smolts were female, and therefore unknown smolts (n=10) were assigned the sex of female. The majority of resident fish were male, so unknown resident fish (n=1) were assigned the sex of male.
Sex was tested for its effects on both the migratory life history trait and ATPase activity in an ANOVA model. Sex was determined to contribute significantly to the overall migratory life history classification (F = 72.216, P < 0.0001), and was used as a cofactor in GWAS models for this trait. For ATPase activity there was no significant effect of sex detected (F = 0.997, P = 0.322) and sex consequently was excluded as a cofactor in these models. When partitioning ATPase activity by life history classification, differences were significant (t = −2.07, df = 53, P = 0.04) between the mean activity levels for smolts (mean = 2.745, std. dev = 1.218, n = 28) and residents (mean = 2.199, std. dev = 0.634, n = 27).
Molecular Biology
Five RAD-tag libraries were prepared for 100bp single read sequencing. The average number of raw sequence reads across these five libraries was 184,231,878 (range = 165,592,275 – 204,779,007) with an average number of quality filtered reads per library of 125,033,942 (range = 107,332,212 – 137,514,197) (Supplementary Fig. S1). The average number of quality filtered reads per individual was 2,935,039 (range = 1,007,399 – 6,052,847) when not considering pruned individuals as discussed above (Supplementary Fig. S2). All raw Illumina sequence data was submitted to the NCBI SRA database under project accession SRA055295.
In total 12,073 polymorphic RAD-tag loci were detected between the 10 individuals and two populations used in the alignment index. Of those loci, 8,219 aligned perfectly to loci previously discovered (Hecht et al. 2012; Miller et al. 2012) and were named accordingly (Supplementary Table S1). Additionally 3,854 unique loci were discovered here, and named R45622 – R49475. Of the 12,073 loci in this study, 877 (~8%) were found to be heterozygous in at least one of the four DH fish controls. While it is possible that some of the loci in these DH individuals were heterozygous not because they were truly PSVs, but could instead be the result of residual parental nuclear DNA, barcode jumping, or sequencing error (Miller et al. 2012) we opted here to err on the side of caution and remove all of these loci from further analyses leaving us with 11,196 loci. Of the 11,196 loci remaining, 1,592 (14%) had been previously mapped to a rainbow trout linkage group, with 1,448 mapped to one of 29 linkage groups in Miller et al. (2012), and 181 mapped in Hecht et al. (2012), including 37 loci common to both linkage maps.
Population Structure
Coefficients of ancestry (Q) were estimated in order to account for underlying population structure in our sample using the programs STRUCTURE and CLUMPP and visualized using DISTRUCT. The results of this analysis provided support for k = 4 clusters. The Yakima River basin sample was clustered into two groups, with the main stem Teanaway sample clustering into a single cluster, and the North and Middle Fork Teanaway samples clustering into another with some evidence of admixture between them (Fig. 2 and Supplementary Table S2). This result may represent clustering based on a landscape feature between the main stem Teanaway and the smaller tributaries, which has previously been shown in other populations of this species (Narum et al. 2008). The Upper Mann Creek sample also clustered into two groups with evidence of admixture between them as well (Fig. 2 and Supplementary Table S2). It has been shown that the Upper Mann Creek population is a pure redband trout stock, native to the upper Columbia and Snake River systems (Kozfkay et al. 2011), so multiple small drainages which feed into Upper Mann Creek are likely to be the source of this structure. Additionally, clustering in neither population was found to be associated with the life history classification.
Fig. 2.
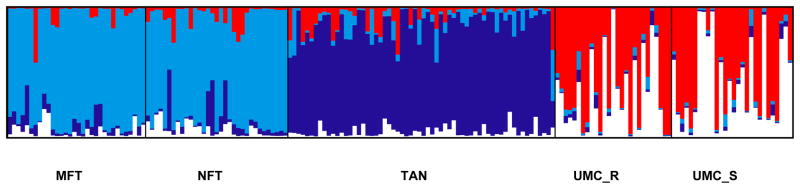
Population structure estimated for k = 4 clusters in 1,000 SNPs from 182 individuals. Groups are partitioned based on sampling site for the Yakima River collection (MFT = Middle Fork Teanaway River, NFT = North Fork Teanaway R., TAN = main stem Teanaway R.), and life history classification for the Upper Mann Creek population (UMC_R = residents, UMC_S = smolts).
Global SMOLT GWAS
For global analyses, 517 loci were found to deviate from HWE expectations in the Yakima River sampling population, while in Upper Mann Creek 240 loci deviated at the same significance level (Supplementary Table S3), with 82 markers failing HWE expectations in both populations. While some loci may have deviated from HWE due to Wahlund effects, we conservatively discounted all SNPs with HWE deviations since they could be PSVs or sequencing errors.
Additional filtering steps pruned 3,526 markers that had a global MAF < 0.05 and 1,976 markers with a genotyping success of < 80% across the sample. After filtering, the global SNP dataset consisted of 5,019 polymorphic RAD-tag SNPs for use in the global association tests. The results which follow are represented completely in Supplementary Table S3 and graphically summarized in Fig. 3 and Supplementary Fig. S3.
Fig. 3.

Selection of rainbow trout linkage groups adapted from Miller et al. (2012). Significant loci detected from eight individual association tests, where each test is represented by a different colored pill and placed to the right of the linkage group.
The Global GLM identified 58 significant loci (range P = 2.63E−6 – 5.34E−3), 12 of which are mapped to 10 different linkage groups in the RAD linkage maps (Table 2). These 58 loci had a mean MAF of 0.2 (range 0.05 – 0.48) and mean genotyping success of 94.4% (range 81.3–100%). The global MLM identified 219 significant loci (range P = 6.69E−8 – 5.44E−3), 49 of which are mapped to 19 different linkage groups from the RAD linkage maps (Table 2). These 219 significant markers had a mean MAF of 0.22 (range 0.05 – 0.5) and mean genotyping success of 94.8% (range 80.2–100%). Additionally 10 of the 58 significant loci identified in the GLM overlapped with those identified in the MLM (Fig. 4).
Table 2.
Number of mapped loci for each linkage group detected as significant in SMOLT and ATPase activity GWAS models. Linkage group assignment based on linkage maps of Hecht et al. (2012) and Miller et al. (2012)
| Linkage group | SMOLT Global | SMOLT Yakima | SMOLT UMC | SMOLT Total Associations | SMOLT Unique Associations | ATPase UMC | ATPase Total Associations | ATPase Unique Associations | ||||
|---|---|---|---|---|---|---|---|---|---|---|---|---|
| GLM | MLM | GLM | MLM | GLM | MLM | GLM | MLM | |||||
| OmySex | 2 | 2 | 2 | |||||||||
| Omy1 | 1 | 1 | 1 | 2 | 1 | 6 | 5 | |||||
| Omy2 | 2 | 4 | 2 | 1 | 9 | 6 | ||||||
| Omy3 | 4 | 1 | 1 | 6 | 5 | |||||||
| Omy4 | 2 | 1 | 3 | 3 | ||||||||
| Omy5 | 1 | 1 | 2 | 2 | ||||||||
| Omy6 | 1 | 2 | 3 | 3 | ||||||||
| Omy7 | 1 | 1 | 2 | 2 | 1 | 1 | 1 | |||||
| Omy8 | 5 | 2 | 7 | 7 | 1 | 1 | 2 | 1 | ||||
| Omy9 | 1 | 1 | 1 | 1 | 1 | 2 | 1 | |||||
| Omy10 | 1 | 2 | 1 | 4 | 2 | |||||||
| Omy11 | 1 | 8 | 3 | 2 | 14 | 10 | ||||||
| Omy12 | 2 | 3 | 2 | 1 | 1 | 9 | 4 | |||||
| Omy13 | 2 | 1 | 1 | 4 | 3 | |||||||
| Omy14 | 1 | 1 | 1 | |||||||||
| Omy15 | 2 | 1 | 1 | 4 | 4 | |||||||
| Omy16 | 1 | 3 | 2 | 6 | 4 | 2 | 2 | 2 | ||||
| Omy17 | 1 | 1 | 2 | 2 | 1 | 1 | 1 | |||||
| Omy18 | 1 | 4 | 1 | 6 | 5 | |||||||
| Omy19 | 1 | 1 | 2 | 1 | ||||||||
| Omy20 | 1 | 1 | 1 | 1 | 4 | 2 | ||||||
| Omy21 | 1 | 1 | 2 | 2 | ||||||||
| Omy22 | 1 | 1 | 2 | 4 | 2 | 1 | 1 | 1 | ||||
| Omy23 | 2 | 2 | 4 | 4 | 1 | 1 | 1 | |||||
| Omy24 | 1 | 1 | 1 | |||||||||
| Omy25 | 1 | 6 | 7 | 6 | 1 | 1 | 1 | |||||
| Omy26 | ||||||||||||
| Omy27 | 1 | 1 | 1 | 2 | 5 | 5 | ||||||
| Omy28 | 1 | 1 | 1 | |||||||||
|
| ||||||||||||
| TOTAL | 12 | 49 | 22 | 11 | 7 | 18 | 119 | 93 | 10 | 3 | 13 | 11 |
Fig. 4.
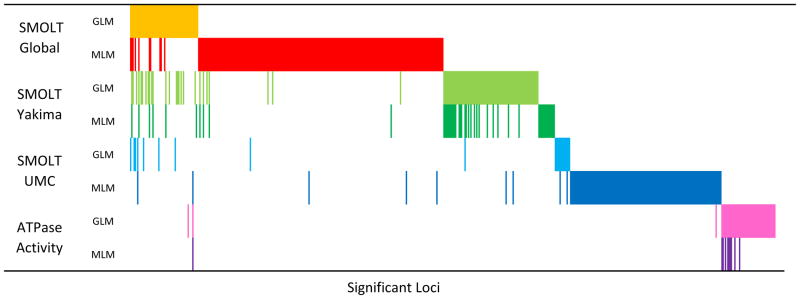
Overlap of significant loci detected in eight different GWAS models. Each row represents a different model, and each column represents one of 550 significant loci detected in at least one model. Data is sorted by marker p-value of model Global_GLM first, then by Global_MLM, then by Yakima_GLM, etc. Colored cells represent a significant association at the column marker for the row model.
Yakima River population SMOLT GWAS
When analyzing the data set within the Yakima River sampling population 6,858 loci were removed for not meeting the filtering criteria, with 517 removed for deviating from HWE expectations, 2,939 removed for having a MAF < 0.05, and 2,201 loci removed for having less than 80% genotyping success, leaving 4,338 loci for analyses. When performing the GLM, 107 SNP markers were found to be significantly associated with the migratory trait (range P = 1.83E−9 – 5.47E−3), including 22 markers which were assigned to 13 different linkage groups in the RAD linkage maps (Table 2). The mean MAF of those significant SNPs was 0.21 (range 0.05 – 0.49) and mean genotyping success was 94.6% (range 80.3–100%). In performing the MLM in the Yakima sample, 50 loci were significantly associated with the migratory trait (range P = 4.28E−7 –5.52E−3). Of those 50 markers, 11 were assigned to eight linkage groups in the RAD linkage maps (Table 2). Thirty-four of these 50 markers also overlapped with the significant markers found in the Yakima only GLM (Fig. 4). The mean MAF of these 50 loci was 0.19 (range 0.05 –0.49) with a mean genotyping success of 95.1% (range 80.3–100%).
Upper Mann Creek SMOLT GWAS
Within the Upper Mann Creek sampling population, 5,157 loci were removed for not meeting the filtering criteria, with 240 removed for deviating from HWE expectations, 3,775 removed for having a MAF < 0.05, and 1,142 removed for having less than 80% genotyping success, leaving 6,039 markers for analyses. When analyzing the migratory trait within this population the GLM identified 22 significant loci (range P = 5.34E−5 – 5.32E−3), seven of which were assigned to six linkage groups in the RAD linkage maps (Table 2). The mean MAF of these 22 loci was 0.22 (range 0.05 – 0.45) with an average genotyping success of 98.4% (range 87.3–100%). The MLM model identified 138 significant loci (range P = 1.4E−5 – 5.37E−3), 18 of which are assigned to 14 linkage groups in the RAD linkage maps (Table 2). Only three of the loci identified in this model were also identified in the GLM (Fig. 4). The mean MAF of the 138 significant loci was 0.22 (range 0.05 – 0.49) with an average genotyping success of 97.4% (range 81.8–100%).
Across all six of the models analyzed for the migratory trait, 504 unique loci have been found to be significantly associated with the propensity to migrate in at least one of the models. Of those 504, 93 have been assigned to 27 of the 29 linkage groups from the RAD linkage maps (Fig. 3 and Supplementary Fig. S3), with only Omy5 and Omy26 not represented among the mapped loci (Table 2). Three loci (R12248, R44513, and R46239) were significantly associated in four of the six models, including both GLM and MLM models from the global analysis and the Yakima population analysis. One of these markers, R12248, has been assigned to linkage group Omy12. Ten loci (R00232, R01282, R15864, R16102, R29254, R32458, R35562, R40048, R47293, and R48642) were significant in three of the six models, with each model represented among these ten except for the MLM in the Upper Mann Creek population, which did not detect any of these loci to be significantly associated with the migratory trait. Four of these ten have been mapped including R29254 to Omy2, R35562 to Omy10, R32458 to Omy11, and R00232 to Omy12. Sixty-one markers were found to be significant in at least two of the six models, with 15 of those markers being mapped in one of the RAD linkage maps. The remaining 430 significant markers were only detected as significant in one of the six models (Supplementary Table S3).
The linkage group with the most significant loci detected across the migratory trait analyses was Omy11, having 14 total instances (Table 2; Fig. 3, and Supplementary Fig. S3). Ten of these 14 instances are unique loci, with three loci being detected in more than one test, including locus R32458, which was detected in three tests overall. The loci detected in the most tests genome-wide included R12248, R44513, and R46239, with R12248 being assigned to linkage group Omy12. Each of these three loci was detected in four of the migratory trait models including both GLM and MLM from the global and Yakima-wise tests (Supplementary Table S3).
Upper Mann Creek ATPase activity GWAS
Association tests for ATPase activity were carried out on the Upper Mann Creek sampling population in the same manner as described above for the migratory trait analysis. Of the 6,039 markers analyzed, 49 were significant (range P = 1.07E−4 – 5.31E−3) in the GLM model, ten of which are assigned to nine linkage groups in the RAD linkage maps (Table 2). The mean MAF of these loci was 0.19 (range 0.05 – 0.46) with an average genotyping success of 97.6% (range 81.8–100%). The MLM model identified ten significant markers (range P = 1.52E−3 – 5.14E−3), three of which were assigned to three linkage groups from the RAD linkage map of Miller et al. (2012) (Table 2). The mean MAF of these ten loci was 0.22 (range 0.07 – 0.40) with an average genotyping success of 99% (range 94.5–100%). All ten of these loci were also significant in the GLM (Fig. 4) with three of them assigned to three different linkage groups in the RAD linkage map of Miller et al. (2012). In total 49 markers were detected for association with ATPase activity, three of which were also detected in at least one of the migratory trait analyses. Of these 49 loci, 10 were assigned to a linkage group in the RAD linkage maps (Fig. 3 and Supplementary Fig. S3).
Comparison across the GWAS models
In total 550 unique loci were detected as being significantly associated with the migratory trait and ATPase activity in all eight of the GWAS models run. When comparing the results from the six SMOLT GWAS models we were interested in whether the same loci or same regions of the genome would be detected across the Yakima and Upper Mann Creek populations. While some associations between these populations are co-localized based on mapped markers including regions on Omy12, 15, 20 and 27, most are not (Figs. 3 and 4, and Supplementary Fig. S3). Additionally very few loci detected in the ATPase analysis overlap or co-localize with loci detected in the SMOLT analyses (Figs. 3 and 4, and Supplementary Fig. S3).
BLAST of significant loci
Performing a BLAST analysis with an eValue detection threshold of 1E−3 of all of the 550 significant loci detected between the eight GWAS analyses identified 280 alignment hits. The mean minimum eValue of these 280 hits was 8.93E−6 (range = 7.35E−26 – 3.81E−4) (Supplementary Table S4). With the relatively short sequence length of the RAD-tag loci, we expect many of these hits with higher eValues to be less than reliable and suggest caution interpreting these results.
Discussion
In this study, we utilized a genotyping-by-sequencing technique to interrogate thousands of RAD-tag SNPs in two wild populations of resident and anadromous rainbow and steelhead trout (O. mykiss) from the Pacific Northwest of the United States to investigate the genetic basis of migration in this species. One of the populations studied maintains its connection to the Pacific Ocean, allowing for the completion of anadromous migrations, while the other population has been restricted from its access to the ocean for more than 50 years but still produces individuals that exhibit juvenile morphological characteristics of smolts (Holecek et al. 2012). Performing GWAS on thousands of RAD-tag based SNPs we detected hundreds of loci significantly associated with the propensity to migrate both in individual population analyses and joint global analyses. Additionally we screened a subset of our sample for associations with ATPase activity and identified several loci associated with this trait.
In the absence of a reference genome sequence we utilized two RAD-tag based genetic linkage maps (Hecht et al. 2012; Miller et al. 2012) to assign 68% of the loci discovered here to loci previously detected. This suggests that RAD-tag based genotyping studies can be compared with a relatively high degree of overlap between studies within this species, making RAD-tag based genotyping approaches suitable to comparative analyses. Additionally 13% (1,603 of 12,073) of the total polymorphic loci detected here had previously been integrated into one of two genetic linkage maps. Using these linkage maps we were able to assign 18% of the significant loci in the migratory life history trait analyses and 20% of the significant loci in the ATPase activity level analyses to linkage groups, which allowed us to compare our GWAS results with previous results from QTL or genome scan studies. Furthermore by combining our data with these previous studies we highlight that in any species where a RAD-tag based linkage map can be produced in either wild (Amores et al. 2011) or experimental (Miller et al. 2012) crosses, a substantial proportion of the RAD-tag markers mapped may be informative in other populations and crosses and thus available for GWAS or population based genome scans.
Results of the migratory life history analysis have identified several genetic regions significantly associated with this trait. Our results in part corroborate previous studies aimed at dissecting and detecting regions of the genome associated with migration related traits in this species, wherein each study using either a genome scan for signatures of selection (Martinez et al. 2011), or QTL mapping (Nichols et al. 2008; Hecht et al. 2012), has identified loci across the genome on several different linkage groups. Indeed, migration is a complex life history trait and we do not expect a single locus to underlie this adaptive tactic. We do however aim to identify genes of large effect both within lineages of rainbow and steelhead trout and among lineages throughout their native range.
Based on the results here and in previous findings there are linkage groups that have been implicated in multiple studies across populations and families in varied geographic regions. For example, a genome scan in a population of rainbow trout that had been transplanted above a barrier waterfall in California, when compared to the source population which retains access to the sea, show signatures of divergent selection at loci that map to linkage group Omy10 among several others (Martinez et al. 2011). This same linkage group harbors several QTL for migration related traits detected in a cross between a historic resident rainbow trout strain from California and a migratory steelhead strain from Idaho, and has been suggested to be a master genetic switch for the migratory life history in this species (Nichols et al. 2008). Here we also detected loci to be associated with the migratory life history classification on this linkage group (Table 2, Fig. 3 and Supplementary Fig. S3), suggesting that there may be a conserved mechanism between these populations of rainbow and steelhead trout in this genomic region.
Two linkage groups in particular stood out in migratory trait analyses in the current study. Linkage group Omy11 contained the highest number of significant associations across all the models based on mapped loci, though no mapped loci were significant in the Upper Mann Creek analysis on this linkage group (Table 2, Fig. 3 and Supplementary Fig. S3). This linkage group is known to harbor several migration related QTL for osmoregulatory ability and body shape morphology (Le Bras et al. 2011; Hecht et al. 2012). Another study (Martinez et al. 2011) has also identified two loci from this group that display evidence of differential selection between above barrier and below barrier populations of rainbow and steelhead trout in California. The other notable linkage group in the present study was Omy12, wherein nine total associations were found between the migratory trait and mapped loci across the GWAS models including the co-localization of significant loci in both the Yakima River and Upper Mann Creek analyses (Table 2, Fig. 3, and Supplementary Fig. S3). Of those associations, one locus was detected in four models, and another was detected in three, providing strong support for these results. Three independent QTL analyses in divergent populations of rainbow and steelhead trout have identified several QTL on this linkage group, including QTL for the binary migratory life history trait, and multiple additional QTL for smoltification related traits (Wringe et al. 2010; Le Bras et al. 2011; Hecht et al. 2012). These results suggest that conserved genetic mechanisms associated with smoltification and migration related traits map to this linkage group.
While our results corroborate with previous studies at some loci, ultimately our findings suggest that the genetic basis to migration in this species is of a complex quantitative nature, resulting from many loci of small effect. These loci are distributed throughout the genome, with significant associations detected on 27 of 29 linkage groups. And while these associations seem randomly distributed genome wide, it is worth noting that most associations on a given linkage group occur within a block of linked or closely linked loci (Fig. 3 and Supplementary Fig. S3). It is therefore possible to localize the significant associations to regions of chromosomes, which will aid in the pursuit of candidate loci underlying this adaptive life history tactic. Unfortunately the short sequence length of these RAD-tag loci hindered efforts to identify candidate genes in our blast analysis. It is hoped that as the rainbow trout (O. mykiss) and Atlantic salmon (Salmo salar) genomes are completed it will be possible to align short RAD-tag sequences against those assemblies to identify larger sequence contigs for blast analyses. These results also highlight the difficulty of investigating the genetic basis of a complex life history trait such as migration.
When comparing the migratory trait GWAS results between the two populations, we were interested in determining whether the same regions are conserved among these relatively closely related trout populations, and whether loci associated with migration persisted within Upper Mann Creek given its 50 years of isolation. Our results indicated that, among the mapped loci, a small proportion were significant in both Yakima and Upper Mann Creek populations. Some overlap was detected on linkage groups Omy1, 12, 15, 20 and 27 (Fig. 3 and Supplementary Fig. S3) providing suggestive evidence of conserved mechanisms; however the data seem to suggest that most associations (e.g. Omy2 and Omy11) occur in one population or the other, but only rarely in both. It should be noted that only ~20% of the significant loci have been assigned to a linkage map, so among the 80% of unassigned loci, it is possible that more loci map to similar regions of the genome.
Significant loci that did not overlap between the two populations (Fig. 4) may indicate that some are false positive results or have minor effect for this trait, but this result may also be due to the two different methods employed in each population to determine the migratory life history. In the Yakima River population, putative smolts were detected based on downstream migratory behavior, whereas in Upper Mann Creek putative smolts were detected based on overall body morphology. Both Nichols et al. (2008) and Hecht et al. (2012) also used skin coloration and morphology to assign individuals to a life history class, and the QTL detected in both of these studies corroborate some of the significant loci detected in the Yakima River and the Upper Mann Creek population analyses here, suggesting that at least some of the same variation in the migratory life history is captured in each method. It is also possible that these two populations in the Columbia River basin persist under diverse selection pressures, and thus different genetic mechanisms determine the overall life history in each population.
Overall, there are several loci associated with the propensity to migrate in the Upper Mann Creek population suggesting that despite the 50 years of sequestration, there is still genetic variability that contributes to this life history tactic. Other studies have also documented retention of migratory ability in populations sequestered by anthropogenic barriers to migration (Holecek et al. 2012; Thrower et al. 2008) or years of freshwater domestication (Pascual et al. 2001). It should be recognized however that the propensity to migrate and ability to complete an anadromous migration may involve different complex traits. So while this particular population appeared to harbor variation for the propensity to migrate, further research is needed to determine the ultimate effects of sequestration on this population’s ability to not only produce smolts, but to produce smolts that will successfully return as spawning adults. Additionally we have identified several associations with ATPase activity in this population, which suggests that variation in this trait also persists, despite a potentially strong selection pressure against it in a sequestered freshwater environment, where increased osmoregulatory ability may have little benefit to an individual and may even yield a cost (Aykanat et al. 2011).
Here we have demonstrated the utility of RAD-tag based genotyping methods by performing GWAS in wild populations of rainbow and steelhead trout, to identify hundreds of loci associated with the propensity to migrate. Many of those loci align perfectly with loci detected in linkage mapping studies, which allowed the relative assignment of several loci to genetic linkage groups. Moreover we have added to a growing knowledge base on the genetic architecture of migration in rainbow and steelhead trout and determined that there is evidence to suggest that divergent quantitative genetic mechanisms between populations may contribute to shaping this trait, with some parallel genetic mechanisms between populations. This has tremendous implications in migratory fish conservation and management, wherein locally adapted populations should be treated as individual units of conservation. These findings could transcend across migratory species globally, where populations and species adapt to dramatic shifts in their environment to survive migration, such that selection has delicately shaped this life history.
Supplementary Material
Fig. S1: Total raw, quality filtered, and quality filtered and barcode stripped reads from five RAD tag sequencing libraries
Fig. S2: Histogram of total quality filtered reads for each of 182 fish samples sequenced excluding seven samples with low yield sequence which were pruned before analyses
Fig. S3: Rainbow trout RAD-tag genetic linkage map adapted from Miller et al. (2012). Significant loci detected from eight individual association tests with each test represented by a different colored pill placed to the right of the linkage group. Only those significant RAD-tag loci (n = 88) that aligned perfectly to Miller et al. (2012) and that were mapped are represented here.
Table S1: Polymorphic RAD-tag loci detected in this study named after the marker nomenclature of Miller et al. (2012). Markers R00012-R40630 aligned perfectly to RAD-tag sequences in Miller et al. (2012), R40643-45607 aligned perfectly to sequences from Hecht et al. (2012), and R45622-49475 are polymorphic loci that did not align to either. Sequence includes the eight base sbfI recognition site (CCTGCAGG) on 5′ end and 59 bp of trimmed sequence. Chromosome assignment and position of RAD loci are reported for both Miller et al. (2012) and Hecht et al. (2012).
Table S2: Complete dataset used for GWAS, including life history classification SMOLT (1 = smolt, 2 = resident), ATPase (ATPase activity (μmoles/Pi/hr/mg Protein)), Sex (1 = male, 2 = female), coefficients of ancestry as inferred by the programs STRUCTURE and CLUMPP (Q1–Q4), and the 11,196 markers R00012 - R49475. Missing data is represented by “N” in all fields.
Table S3: Results of the eight GWAS analyses run, including linkage group assignment and genetic position in the two linkage maps (Miller_LGr, Miller_cM; Miller et al. (2012), Hecht_LG, Hecht_cM (Hecht et al. (2012)), HWE P-values in Yakima (Yak) and Upper Mann Creek (UMC), genotyping success (%Miss), and minor allele frequency (MAF). P-values for each significant loci based on a B-Y FDR adjusted α = 0.05 level for each GWAS model run are also shown. Colored cells are for ease of viewing and correlate across figures and tables to identify each model. Sums are presented for the total number of SMOLT and/or ATPase GWAS models each locus was detected as being significant in, with a grand total sum across all models presented for each locus.
Table S4: Blast2Go results for all 550 RAD-tag sequences detected for having a significant association with either the migratory life history trait or ATPase activity. RAD locus linkage assignment and position is given for both RAD linkage maps in Miller et al. (2012) and Hecht et al. (2012)
File S1: Overview of the steps and commands used in this study for the bioinformatic pipeline of Miller et al. (2012).
Acknowledgments
The authors would like to acknowledge Scott Blankenship and Cherril Bowman, of the Washington Department of Fish and Wildlife for providing Yakima River fish samples, and Dennis Scarnecchia for involvement in the collection of data for the Upper Mann Creek samples. We acknowledge laboratory assistance of Megan Moore and Travis Jacobson in the extraction of tissue and preparation of RAD-tag sequencing libraries. We thank Andrew Matala for assistance in generating figure 1. We also thank Frank Thrower, Matt Hale, Mike Miller, and Krista Nichols for allowing the use of reference data and doubled haploid RAD-tag sequence. The authors also acknowledge Alex Lipka, Garrett McKinney, Mike Miller and Rob Lyon for helpful discussions regarding GWAS analysis, bioinformatics, and computational support. Computational resources for this project were provided by the Institute for Bioinformatics and Evolutionary Studies (IBEST) at the University of Idaho and supported by grants from the National Center for Research Resources (5P20RR016448-10) and the National Institute of General Medical Sciences (8 P20 GM103397-10) from the National Institutes of Health. Funding for this project was provided by the Bonneville Power Administration grant 200900500.
Footnotes
Data Accessibility
A) Illumina SR 100bp RAD-tag Sequences have been submitted to the NCBI SRA database under project accession ID: SRA055295
B) RAD-tag SNP loci and allele sequences are available as online supporting information (Supplementary Table S1)
C) A complete dataset including genotypes and phenotypes is available as online supporting information (Supplementary Table S2)
References
- Amores A, Catchen J, Ferrara A, Fontenot Q, Postlethwait JH. Genome evolution and meiotic maps by massively parallel DNA sequencing: spotted gar, an outgroup for the teleost genome duplication. Genetics. 2011;188:799–808. doi: 10.1534/genetics.111.127324. [DOI] [PMC free article] [PubMed] [Google Scholar]
- Ando D, Kitamura T, Mizuno S. Quantitative analysis of body silvering during smoltification in masu salmon using chromameter. North American Journal of Aquaculture. 2005;67:160–166. [Google Scholar]
- Aykanat T, Thrower FP, Heath DD. Rapid evolution of osmoregulatory function by modification of gene transcription in steelhead trout. Genetica. 2011;139:233–242. doi: 10.1007/s10709-010-9540-2. [DOI] [PubMed] [Google Scholar]
- Baird NA, Etter PD, Atwood TS, et al. Rapid SNP discovery and genetic mapping using sequenced RAD markers. PLoS One. 2008;3:e3376. doi: 10.1371/journal.pone.0003376. [DOI] [PMC free article] [PubMed] [Google Scholar]
- Balding DJ. A tutorial on statistical methods for population association studies. Nature Reviews Genetics. 2006;7:781–791. doi: 10.1038/nrg1916. [DOI] [PubMed] [Google Scholar]
- Beeman JW, Rondorf DW, Tilson ME, Venditti DA. A Nonlethal Measure of Smelt Status of Juvenile Steelhead Based on Body Morphology. Transactions of the American Fisheries Society. 1995;124:764–769. [Google Scholar]
- Behnke RJ. Trout and Salmon of North America. The Free Press; New York, NY: 2002. [Google Scholar]
- Benjamini Y, Yekutieli D. The control of the false discovery rate in multiple testing under dependency. Annals of Statistics. 2001;29:1165–1188. [Google Scholar]
- Bradbury PJ, Zhang Z, Kroon DE, et al. TASSEL: software for association mapping of complex traits in diverse samples. Bioinformatics. 2007;23:2633–2635. doi: 10.1093/bioinformatics/btm308. [DOI] [PubMed] [Google Scholar]
- Brunelli JP, Wertzler KJ, Sundin K, Thorgaard GH. Y-specific sequences and polymorphisms in rainbow trout and Chinook salmon. Genome. 2008;51:739–748. doi: 10.1139/G08-060. [DOI] [PubMed] [Google Scholar]
- Davey JW, Hohenlohe PA, Etter PD, et al. Genome-wide genetic marker discovery and genotyping using next-generation sequencing. Nat Rev Genet. 2011;12:499–510. doi: 10.1038/nrg3012. [DOI] [PubMed] [Google Scholar]
- Dellefors C, Faremo U. Early sexual-maturation in males of wild sea trout, Salmo trutta L., inhibits smoltification. Journal of Fish Biology. 1988;33:741–749. [Google Scholar]
- Dingle H. Animal migration: is there a common migratory syndrome? Journal of Ornithology. 2006;147:212–220. [Google Scholar]
- Dingle H, Drake VA. What is migration? Bioscience. 2007;57:113–121. [Google Scholar]
- Evanno G, Regnaut S, Goudet J. Detecting the number of clusters of individuals using the software STRUCTURE: a simulation study. Molecular Ecology. 2005;14:2611–2620. doi: 10.1111/j.1365-294X.2005.02553.x. [DOI] [PubMed] [Google Scholar]
- Folmar LC, Dickhoff WW. The parr-smolt transformation (smoltification) and seawater adaptation in salmonids - A review of selected literature. Aquaculture. 1980;21:1–37. [Google Scholar]
- Groot C. Migration of yearling sockeye salmon (Oncorhynchus nerka) as determined by time-lapse photography of sonar observations. Journal of the Fisheries Research Board of Canada. 1972;29:1431–1444. [Google Scholar]
- Gustafson RG, Waples RS, Myers JM, et al. Pacific salmon extinctions: quantifying lost and remaining diversity. Conservation Biology. 2007;21:1009–1020. doi: 10.1111/j.1523-1739.2007.00693.x. [DOI] [PubMed] [Google Scholar]
- Haner PV, Faler JC, Schrock RM, Rondorf DW, Maule AG. Skin Reflectance as a Nonlethal Measure of Smoltification for Juvenile Salmonids. North American Journal of Fisheries Management. 1995;15:814–822. [Google Scholar]
- Hecht BC, Thrower FP, Hale MC, Miller MR, Nichols KM. The genetic architecture of migration-related traits in rainbow and steelhead trout, Oncorhynchus mykiss. G3:Genes, Genomes, Genetics. 2012;2:1113–1127. doi: 10.1534/g3.112.003137. [DOI] [PMC free article] [PubMed] [Google Scholar]
- Hoar WS. The evolution of migratory behavior among juvenile salmon of the genus Oncorhynchus. Journal of the Fisheries Research Board of Canada. 1958;15:391–428. [Google Scholar]
- Hoar WS. Smolt transformation - evolution, behavior, and physiology. Journal of the Fisheries Research Board of Canada. 1976;33:1233–1252. [Google Scholar]
- Hohenlohe PA, Bassham S, Etter PD, et al. Population genomics of parallel adaptation in threespine stickleback using sequenced RAD tags. Plos Genetics. 2010;6:e1000862. doi: 10.1371/journal.pgen.1000862. [DOI] [PMC free article] [PubMed] [Google Scholar]
- Holecek DE, Scarnecchia DL, Miller SE. Smoltification in an impounded, adfluvial redband trout population upstream from an impassable dam: does it persist? Transactions of the American Fisheries Society. 2012;141:68–75. [Google Scholar]
- Jakobsson M, Rosenberg NA. CLUMPP: a cluster matching and permutation program for dealing with label switching and multimodality in analysis of population structure. Bioinformatics. 2007;23:1801–1806. doi: 10.1093/bioinformatics/btm233. [DOI] [PubMed] [Google Scholar]
- Johnsson JI, Clarke WC, Blackburn J. Hybridization with domesticated rainbow trout reduces seasonal variation in seawater adaptability of steelhead trout (Oncorhynchus mykiss) Aquaculture. 1994;121:73–77. [Google Scholar]
- Johnston SE, McEwan JC, Pickering NK, et al. Genome-wide association mapping identifies the genetic basis of discrete and quantitative variation in sexual weaponry in a wild sheep population. Molecular Ecology. 2011;20:2555–2566. doi: 10.1111/j.1365-294X.2011.05076.x. [DOI] [PubMed] [Google Scholar]
- Jonsson N, Jonsson B, Hansen LP. Long-term study of the ecology of wild Atlantic salmon smolts in a small Norwegian river. Journal of Fish Biology. 1998;52:638–650. [Google Scholar]
- Kang HM, Zaitlen NA, Wade CM, et al. Efficient control of population structure in model organism association mapping. Genetics. 2008;178:1709–1723. doi: 10.1534/genetics.107.080101. [DOI] [PMC free article] [PubMed] [Google Scholar]
- Kozfkay CC, Campbell MR, Meyer KA, Schill DJ. Influences of habitat and hybridization on the genetic structure of redband trout in the Upper Snake River basin, Idaho. Transactions of the American Fisheries Society. 2011;140:282–295. [Google Scholar]
- Le Bras Y, Dechamp N, Krieg F, et al. Detection of QTL with effects on osmoregulation capacities in the rainbow trout (Oncorhynchus mykiss) BMC Genetics. 2011;12:46. doi: 10.1186/1471-2156-12-46. [DOI] [PMC free article] [PubMed] [Google Scholar]
- Liedvogel M, Akesson S, Bensch S. The genetics of migration on the move. Trends in Ecology & Evolution. 2011;26:561–569. doi: 10.1016/j.tree.2011.07.009. [DOI] [PubMed] [Google Scholar]
- Limborg MT, Blankenship SM, Young SF, et al. Signatures of natural selection among lineages and habitats in Oncorhynchus mykiss. Ecology and Evolution. 2012;2:1–18. doi: 10.1002/ece3.59. [DOI] [PMC free article] [PubMed] [Google Scholar]
- Lipka AE, Tian F, Wang Q, et al. GAPIT: Genome association and prediction integrated tool. Bioinformatics. 2012 doi: 10.1093/bioinformatics/bts444. [DOI] [PubMed] [Google Scholar]
- Luikart G, England PR, Tallmon D, Jordan S, Taberlet P. The power and promise of population genomics: From genotyping to genome typing. Nature Reviews Genetics. 2003;4:981–994. doi: 10.1038/nrg1226. [DOI] [PubMed] [Google Scholar]
- Martinez A, Garza JC, Pearse DE. A Microsatellite Genome Screen Identifies Chromosomal Regions under Differential Selection in Steelhead and Rainbow Trout. Transactions of the American Fisheries Society. 2011;140:829–842. [Google Scholar]
- McLeese JM, Johnsson J, Huntley FM, Clarke WC, Weisbart M. Seasonal changes in osmoregulation, cortisol, and cortisol receptor activity in the gills of parr/smolt of steelhead trout and steelhead-rainbow trout hybrids, Oncorhynchus mykiss. General and Comparative Endocrinology. 1994;93:103–113. doi: 10.1006/gcen.1994.1012. [DOI] [PubMed] [Google Scholar]
- McMillan JR, Katz SL, Pess GR. Observational evidence of spatial and temporal structure in a sympatric anadromous (winter steelhead) and resident rainbow trout mating system on the Olympic Peninsula, Washington. Transactions of the American Fisheries Society. 2007;136:736–748. [Google Scholar]
- Miller MR, Brunelli JP, Wheeler PA, et al. A conserved haplotype controls parallel adaptation in geographically distant salmonid populations. Molecular Ecology. 2012;21:237–249. doi: 10.1111/j.1365-294X.2011.05305.x. [DOI] [PMC free article] [PubMed] [Google Scholar]
- Miller MR, Dunham JP, Amores A, Cresko WA, Johnson EA. Rapid and cost-effective polymorphism identification and genotyping using restriction site associated DNA (RAD) markers. Genome Research. 2007;17:240–248. doi: 10.1101/gr.5681207. [DOI] [PMC free article] [PubMed] [Google Scholar]
- Narum SR. Beyond Bonferroni: Less conservative analyses for conservation genetics. Conservation Genetics. 2006;7:783–787. [Google Scholar]
- Narum SR, Zendt JS, Frederiksen C, et al. Candidate Genetic Markers Associated with Anadromy in Oncorhynchus mykiss of the Klickitat River. Transactions of the American Fisheries Society. 2011;140:843–854. [Google Scholar]
- Narum SR, Zendt JS, Graves D, Sharp WR. Influence of landscape on resident and anadromous life history types of Oncorhynchus mykiss. Canadian Journal of Fisheries and Aquatic Sciences. 2008;65:1013–1023. [Google Scholar]
- Negus MT. Determination of smoltification status in juvenile migratory rainbow trout and Chinook salmon in Minnesota. North American Journal of Fisheries Management. 2003;23:913–927. [Google Scholar]
- Nichols KM, Broman KW, Sundin K, et al. Quantitative trait loci x maternal cytoplasmic environment interaction for development rate in Oncorhynchus mykiss. Genetics. 2007;175:335–347. doi: 10.1534/genetics.106.064311. [DOI] [PMC free article] [PubMed] [Google Scholar]
- Nichols KM, Edo AF, Wheeler PA, Thorgaard GH. The genetic basis of smoltification-related traits in Oncorhynchus mykiss. Genetics. 2008;179:1559–1575. doi: 10.1534/genetics.107.084251. [DOI] [PMC free article] [PubMed] [Google Scholar]
- Pascual M, Bentzen P, Rossi CR, et al. First documented case of anadromy in a population of introduced rainbow trout in Patagonia, Argentina. Transactions of the American Fisheries Society. 2001;130:53–67. [Google Scholar]
- Pritchard JK, Stephens M, Donnelly P. Inference of population structure using multilocus genotype data. Genetics. 2000;155:945–959. doi: 10.1093/genetics/155.2.945. [DOI] [PMC free article] [PubMed] [Google Scholar]
- Quinn TP. The Behavior and Ecology of Pacific Salmon and Trout. American Fisheries Society; Bethesda, MD: 2005. [Google Scholar]
- Quinn TP, Myers KW. Anadromy and the marine migrations of Pacific salmon and trout: Rounsefell revisited. Reviews in Fish Biology and Fisheries. 2004;14:421–442. [Google Scholar]
- Rice WR. Analyzing tables of statistical tests. Evolution. 1989;43:223–225. doi: 10.1111/j.1558-5646.1989.tb04220.x. [DOI] [PubMed] [Google Scholar]
- Rosenberg NA. DISTRUCT: A program for the graphical display of population structure. Molecular Ecology Notes. 2004;4:137–138. [Google Scholar]
- Sanchez CC, Smith TPL, Wiedmann RT, et al. Single nucleotide polymorphism discovery in rainbow trout by deep sequencing of a reduced representation library. BMC Genomics. 2009;10:559. doi: 10.1186/1471-2164-10-559. [DOI] [PMC free article] [PubMed] [Google Scholar]
- Schrock RM, Beeman JW, Rondorf DW, Haner PV. A microassay for gill sodium, potassium activated ATPase in juvenile Pacific salmonids. Transactions of the American Fisheries Society. 1994;123:223–229. [Google Scholar]
- Slate J, Gratten J, Beraldi D, et al. Gene mapping in the wild with SNPs: guidelines and future directions. Genetica. 2009;136:97–107. doi: 10.1007/s10709-008-9317-z. [DOI] [PubMed] [Google Scholar]
- Storz JF. Using genome scans of DNA polymorphism to infer adaptive population divergence. Molecular Ecology. 2005;14:671–688. doi: 10.1111/j.1365-294X.2005.02437.x. [DOI] [PubMed] [Google Scholar]
- Thrower FP, Hard JJ, Joyce JE. Genetic architecture of growth and early life-history transitions in anadromous and derived freshwater populations of steelhead. Journal of Fish Biology. 2004;65:286–307. [Google Scholar]
- Thrower FP, Joyce JE, Celewycz AG, Malecha PW. The potential importance of reservoirs in the western United States for the recovery of endangered populations of anadromous steelhead. In: Allen MS, Sammons S, Maceina MJ, editors. Balancing Fisheries Management and Water Uses for Impounded River Systems. American Fisheries Society; Bethesda, MD: 2008. pp. 309–324. [Google Scholar]
- Wedemeyer GA, Saunders RL, Clarke WC. Environmental factors affecting smoltification and early marine survival of anadromous salmonids. Marine Fisheries Review. 1980;42:1–14. [Google Scholar]
- Wespestad VG, Maguire J-J. Review of the state of the world marine fishery resources. Food and Agriculture Organization of the United Nations; 2011. B11. Northeast Pacific; pp. 151–161. ( www.fao.org/docrep/015/i2389e/i2389e.pdf) [Google Scholar]
- Wilcove DS, Wikelski M. Going, going, gone: Is animal migration disappearing? Plos Biology. 2008;6:1361–1364. doi: 10.1371/journal.pbio.0060188. [DOI] [PMC free article] [PubMed] [Google Scholar]
- Wringe BF, Devlin RH, Ferguson MM, et al. Growth-related quantitative trait loci in domestic and wild rainbow trout (Oncorhynchus mykiss) BMC Genetics. 2010;11:63. doi: 10.1186/1471-2156-11-63. [DOI] [PMC free article] [PubMed] [Google Scholar]
- Young WP, Wheeler PA, Fields RD, Thorgaard GH. DNA fingerprinting confirms isogenicity of androgenetically derived rainbow trout lines. Journal of Heredity. 1996;87:77–81. doi: 10.1093/oxfordjournals.jhered.a022960. [DOI] [PubMed] [Google Scholar]
- Yu JM, Pressoir G, Briggs WH, et al. A unified mixed-model method for association mapping that accounts for multiple levels of relatedness. Nature Genetics. 2006;38:203–208. doi: 10.1038/ng1702. [DOI] [PubMed] [Google Scholar]
- Zaugg WS, McLain LR. Changes in gill adenosine-triphosphatase activity associated with parr-smolt transformation in steelhead trout, coho, and spring chinook salmon. Journal of the Fisheries Research Board of Canada. 1972;29:167–171. [Google Scholar]
- Zaugg WS, Wagner HH. Gill ATPase activity related to parr-smolt transformation and migration in steelhead trout (Salmo gairdneri) - influence of photoperiod and temperature. Comparative Biochemistry and Physiology. 1973;45:955–965. doi: 10.1016/0305-0491(73)90156-9. [DOI] [PubMed] [Google Scholar]
- Zhang ZW, Ersoz E, Lai CQ, et al. Mixed linear model approach adapted for genome-wide association studies. Nature Genetics. 2010;42:355–360. doi: 10.1038/ng.546. [DOI] [PMC free article] [PubMed] [Google Scholar]
- Zimmerman CE, Reeves GH. Population structure of sympatric anadromous and nonanadromous Oncorhynchus mykiss: evidence from spawning surveys and otolith microchemistry. Canadian Journal of Fisheries and Aquatic Sciences. 2000;57:2152–2162. [Google Scholar]
Associated Data
This section collects any data citations, data availability statements, or supplementary materials included in this article.
Supplementary Materials
Fig. S1: Total raw, quality filtered, and quality filtered and barcode stripped reads from five RAD tag sequencing libraries
Fig. S2: Histogram of total quality filtered reads for each of 182 fish samples sequenced excluding seven samples with low yield sequence which were pruned before analyses
Fig. S3: Rainbow trout RAD-tag genetic linkage map adapted from Miller et al. (2012). Significant loci detected from eight individual association tests with each test represented by a different colored pill placed to the right of the linkage group. Only those significant RAD-tag loci (n = 88) that aligned perfectly to Miller et al. (2012) and that were mapped are represented here.
Table S1: Polymorphic RAD-tag loci detected in this study named after the marker nomenclature of Miller et al. (2012). Markers R00012-R40630 aligned perfectly to RAD-tag sequences in Miller et al. (2012), R40643-45607 aligned perfectly to sequences from Hecht et al. (2012), and R45622-49475 are polymorphic loci that did not align to either. Sequence includes the eight base sbfI recognition site (CCTGCAGG) on 5′ end and 59 bp of trimmed sequence. Chromosome assignment and position of RAD loci are reported for both Miller et al. (2012) and Hecht et al. (2012).
Table S2: Complete dataset used for GWAS, including life history classification SMOLT (1 = smolt, 2 = resident), ATPase (ATPase activity (μmoles/Pi/hr/mg Protein)), Sex (1 = male, 2 = female), coefficients of ancestry as inferred by the programs STRUCTURE and CLUMPP (Q1–Q4), and the 11,196 markers R00012 - R49475. Missing data is represented by “N” in all fields.
Table S3: Results of the eight GWAS analyses run, including linkage group assignment and genetic position in the two linkage maps (Miller_LGr, Miller_cM; Miller et al. (2012), Hecht_LG, Hecht_cM (Hecht et al. (2012)), HWE P-values in Yakima (Yak) and Upper Mann Creek (UMC), genotyping success (%Miss), and minor allele frequency (MAF). P-values for each significant loci based on a B-Y FDR adjusted α = 0.05 level for each GWAS model run are also shown. Colored cells are for ease of viewing and correlate across figures and tables to identify each model. Sums are presented for the total number of SMOLT and/or ATPase GWAS models each locus was detected as being significant in, with a grand total sum across all models presented for each locus.
Table S4: Blast2Go results for all 550 RAD-tag sequences detected for having a significant association with either the migratory life history trait or ATPase activity. RAD locus linkage assignment and position is given for both RAD linkage maps in Miller et al. (2012) and Hecht et al. (2012)
File S1: Overview of the steps and commands used in this study for the bioinformatic pipeline of Miller et al. (2012).